


Serviços Personalizados
Journal
Artigo
 Inglês (pdf)
 Artigo em XML
 Referências do artigo
 Enviar este artigo por email
Indicadores
-
 Citado por SciELO
 -
 Acessos
Links relacionados
-
 Similares em
SciELO
Similares em
SciELO
Compartilhar

 Permalink
Huitzil
versão On-line ISSN 1870-7459
Huitzil vol.15 no.2 Omitlán Jul./Dez. 2014
Científica
Estimating species richness and density of a bird community in a coastal lagoon on the Mexican Pacific
Estimación de la riqueza y densidad de especies de una comunidad de aves en una laguna costera del Pacífico mexicano
Mateo D.M. Ruiz Bruce Taylor1* and José Cruz Bojorges Baños2
1 Universidad del Mar. Ciudad Universitaria, Puerto Ángel, 70902, Oaxaca, Mexico.
2 Instituto de Recursos, Universidad del Mar. Km 2.5 carretera a Sola de Vega, Puerto Escondido, San Pedro Mixtepec, 71980, Oaxaca, Mexico.
* Present address:
Doctorado en Ciencias en Ecología y Desarrollo Sustentable,
El Colegio de la Frontera Sur.Carretera Panamericana y Periférico Sur s/n.,
San Cristóbal de Las Casas, 29290, Chiapas, Mexico.
E-mail: truiz@ecosur.edu.mx
Received: 10th February 2014
Revision accepted: 10th September 2014
Associated Editor: Iriana L. Zuria Jordan
Abstract
In this study we assess the bias in estimates of bird richness in a tropical wetland. We used 18 months of data from point counts to estimate the species richness in a coastal lagoon in Oaxaca and computed eight species richness estimators. We evaluated estimate inaccuracy using the sum of total richness that we obtained with combined sampling techniques between 2006 and 2010. We selected the richness estimator of minimum inaccuracy and used randomized species accumulation curves to investigate differences in species densities obtained with 10 and 20-minute counts. To ascertain if habitat type influenced richness estimates, we compared the bird diversity associated with contrasting mangrove and estuarine environments. The total richness for the lagoon was 185 species and the jackknife 2 richness estimator showed the minimum inaccuracy. The randomized accumulation curves of 10 and 20 minutes displayed partially overlapping confidence intervals and an increasing time lag between the count durations at equivalent densities. The rarefaction curves from contrasting habitat types showed significantly higher richness and species density in the estuary while the jackknife 2 estimator indicated similar sample coverage in both habitats. We identify important consequences of the sampling methodology that we used and conclude that point count sampling resulted in incomplete species detection but facilitated comparative analyses.
Keywords: point counts, total richness, richness estimator, inaccuracy, bird diversity, mangrove.
Resumen
En el presente estudio evaluamos el sesgo en las estimaciones de riqueza de especies de aves en un humedal tropical. Utilizamos 18 meses de datos provenientes de puntos de conteo para estimar la riqueza específica en una laguna costera de Oaxaca y calculamos ocho estimadores de riqueza. Evaluamos la inexactitud de las estimaciones utilizando la cifra de riqueza total que obtuvimos con una combinación de técnicas de muestreo entre 2006 y 2010. Seleccionamos el estimador de riqueza de inexactitud mínima y utilizamos curvas de acumulación de especies aleatorizadas para investigar las diferencias entre las densidades de especies obtenidas con recuentos de 10 y 20 min. Para determinar si el tipo de hábitat influyó en las estimaciones de riqueza, comparamos la diversidad avifaunística asociada a los ambientes contrastantes de manglar y estuario. La riqueza total para la laguna fue de 185 especies y el estimador jackknife 2 presentó la mínima inexactitud. Las curvas de acumulación aleatorizadas de 10 y 20 min presentaron superposición parcial de los intervalos de confianza y un desfase temporal creciente entre los lapsos de conteo a densidades equivalentes. Las curvas de rarefacción de tipos de hábitat contrastantes reflejaron una riqueza y densidad de especies significativamente mayor en el estuario, mientras que el estimador jackknife 2 indicó una cobertura de muestreo similar en ambos hábitats. Identificamos consecuencias importantes de la metodología de muestreo que utilizamos y concluimos que el muestreo con los puntos de conteo resultó en una detección de especies incompleta, pero facilitó el análisis comparativo.
Palabras clave: puntos de conteo, riqueza total, estimador de riqueza, inexactitud, diversidad de aves, manglar.
Introduction
Detecting all the species in a bird community is usually a demanding task and avian studies in ecology invariably rely on sampling if they aim to estimate the number of species that occur in a given habitat or area. Sampling units of equal dimensions are recommended for analysing spatial patterns of species richness (Whittaker et al. 2001) and in ornithology, point counts and transects are commonly used to standardize sampling effort. However, the exclusion of species observed outside standardized sampling units increases the probability of underestimation (Bojorges et al. 2006). Furthermore, not all species within the sampling unit will be detected and point counts are relatively poor at detecting small birds that forage close to the ground or that seldom vocalize (e.g., Trochilidae and Parulidae: Blake and Loiselle 2001). Sampling with mist-netting can improve the detection of certain species but there are inherent biases in both count methods and captures (Rappole et al. 1998). Other sources of negative bias that are particularly relevant in tropical environments are the high species richness, the high proportion of rare species, and the reduced detectability of birds in dense vegetation (Karr 1981, Brose et al. 2003, Mao and Colwell 2005).
Despite shortcomings in species detection, sampling methods of standardized effort provide a basis for making robust comparisons of the number of species observed between sites. Rarefaction curves allow the comparison of observed or estimated species richness at comparable numbers of individuals and it is also possible to do this with sample-based rarefaction if the abscissa is re-scaled to individuals (Gotelli and Colwell 2001). Despite this, ornithological studies tend to use randomized species accumulation curves as a function of samples (Macedo et al. 2007, Ugalde-Lezama et al. 2010, Bojorges-Baños 2011), representing species density rather than richness (Gotelli and Colwell 2001), which has implications when interpreting the results (Moreno and Halffter 2000, Moreno and Halffter 2001, Willot 2001).
As a consequence of incomplete sampling, using sample data to estimate the number of species that in reality occur is a key objective for conservation biology (Colwell and Coddington 1994, Brose et al. 2003), especially if estimates are accompanied by confidence intervals (Colwell et al. 2004). At least seven non-parametric methods and nine function-based extrapolation methods have been used to estimate bird richness (Boulinier et al. 1998, Herzog et al. 2002, Bojorges-Baños and López-Mata 2006, Archaux and Bakkaus 2007, González-Oreja et al. 2010, Ugalde-Lezama et al. 2010, Bojorges-Baños 2011), with non-parametric incidence-based estimators receiving greater use. However, on evaluating the accuracy of nine richness estimators with data on birds in Bolivia, Herzog et al. (2002) selected the parametric Michaelis Menten model over seven non-parametric statistics. In contrast, jackknife methods were identified as preferable for breeding birds in the USA (Boulinier et al. 1998) and for low diversity bird communities in an urban area of Mexico (González-Oreja et al. 2010).
Choosing a species richness estimator for a given context is complicated by the factors which influence them: the sampling method, the conditions in which sampling in done, and the characteristics of the community studied (Colwell and Coddington 1994, Brose et al. 2003). Unfortunately, calibrating estimators requires knowledge of total richness which is rarely available (Palmer 1990, Herzog et al. 2002, Brose et al. 2003), especially in species rich communities.
Ornithological studies in the Neotropical coastal zone have employed point counts, transects and mist netting to sample bird communities in mangrove forests. In these conditions, fixed-radius point counts aid in the detection of species (Macedo et al. 2007), avoid the need to take data while moving across difficult terrain (Lefebvre and Poulin 1997), and cover a standardized area. However, the duration of point counts used in coastal lagoons varies from 10 minutes to 1.5 hours (Lefebvre and Poulin 1997, Martínez-Martínez and Cupul-Magaña 2002, Macedo et al. 2007), raising an important methodological issue. Species detectability increases as a function of count duration, particularly for species with low detection probabilities, with concomitant implications when monitoring bird populations (Buskirk and McDonald 1995, Dawson et al. 1995, Lynch 1995, Drapeau et al. 1999). To date, the available evidence of point count duration affecting species detectability has come from terrestrial habitats, mainly at temperate latitudes.
The diverse fauna of mangroves is associated with an open ecosystem that in coastal lagoons has strong connections with estuarine environments (Lugo 2002). It would therefore be consistent if ornithological research in this context focused not only on mangrove stands, but included connected ecosystems. However, this has seldom been the case and estimates of avian diversity in coastal lagoons have usually been obtained exclusively from mangroves. Estimates of bird diversity from Neotropical mangroves include 82 and 57 species on the Panamanian Pacific and Caribbean (Lefebvre and Poulin 1997), 75 and 50 on the Colombian Pacific and Caribbean (Naranjo 1997, Chaves-Fonnegra et al. 2005), and 81 species in Brazil (Macedo et al. 2007). In Oaxacan mangroves values range from 68 to 72, while in the specific area of the present study 66 and 88 species have previously been estimated in the mangrove, including some observations from adjoining environments (Becerril 2001, Bojorges-Baños 2011). In contrast, Amador et al. (2006) employed a comparable sampling effort in mangrove forest and in open areas of a coastal lagoon in Baja California. They recorded between 22 and 33 species per transect in the area without trees and between 15 and 28 in the mangrove, documenting a total of 56 species.
In the present study we question the viability of using fixed-radius point counts to detect species in bird communities associated with the coastal lagoon of La Ventanilla-Tonameca, Oaxaca. We consider the inaccuracy of species richness estimators and raise two salient questions concerning the influence of count duration on the estimation of bird species density: What interaction exists between count duration and sampling effort? How does count duration affect species richness estimators? We also ask how the absence of mangroves in some sample units influences estimates of bird species richness or density, with a view to addressing the consequences of including areas outside mangroves when estimating avian diversity in coastal lagoons. Our three specific objectives were: 1) to evaluate the inaccuracy of standardized sampling and eight species richness estimators by calibrating estimates with a value of total richness; 2) to judge estimates of species density obtained with point counts of two different durations, and; 3) to interpret an applied comparative analysis of bird diversity from two contrasting habitat types in terms of bias in richness estimates.
Methods
Study area
The morphological structure of the coastal zone in Oaxaca consists mainly of flat or undulating plains along a narrow stretch between the Sierra Madre del Sur mountain range and the Pacific Ocean (Hernández et al. 2009). The study area was within the ecosystem of the La Ventanilla-Tonameca coastal lagoon, which is situated between 15°40'N and 96°34'W and has an approximate area of 750 ha. The climate in this location is classified as warm subhumid, with an annual temperature above 26°C and annual rainfall of approximately 900 mm (Trejo 2004). The site is within a wider precipitation region that receives an annual rainfall of 646 mm and an average of 91% of this occurs between May and October (Pérez-Morga et al. 2013).
The Tonameca River is the main source of fresh water, it enters the lagoon towards the western end and during rainy season a tidal channel crosses the barrier beach in front of the river. The area has a few scattered trees (Spondias sp.) but the hydrophytic community is dominated by rushes, canes, lilies and halophytic grasses, including Typha domingensis (southern cattail), Cyperus giganteus (giant flatsedge), Hymenachne amplexicaulis (bamboo grass), Nymphea ampla (dotleaf waterlily), and Pistia statiotes (water lettuce). Extensive mudflats are exposed by the tide and other hydrological dynamics.
At a distance of 5 km from the river mouth, the eastern end of the lagoon only connects with the ocean during years with sufficient rainfall. The trees of Rhizophora mangle (red mangle) and Laguncularia racemosa (white mangle) grow in this area, on flat land that is little exposed to tidal currents. The low velocity of water currents and the well-developed root system of this mangrove are characteristic of fringe forest (Lugo and Snedaker 1974), as is the physiographic structure of the stands (Tovilla et al. 2010). Further inland R. mangle is found growing in drainage basins of seasonal water courses in basin forest conditions (Lugo and Snadekar 1974). Although this mangrove is prone to periodic disturbance by hurricanes (Ruiz et al. 2013), the forest was in a mature phase when samples were taken for the present study.
Sampling design and methodology
We obtained samples from two areas of approximately 50 ha, with each area comprising one habitat type: mangrove or estuary without forest. Our usage of the habitat concept is broader than the species specific perspective (Whittaker et al. 1973) and we apply the term "habitat type" to the habitat of a bird community, as defined by vegetation, hydrology and topography (Fuller, 2012). Point counts were carried out in one station within each habitat type (station 1 = mangrove and station 2 = estuary without forest) and we hereafter refer to the combination of observations from stations 1 and 2 as the overall study. We established 24 point count sites, with the precise position dictated by accessibility. The average distance separating the 12 points situated in station 1 from those in station 2 was 3.34 km (SD=0.36).
Within stations, neighboring sites were separated by a minimum of 100 m, with an average of 140 m (SD=50; Ralph et al. 1992, Buskirk and McDonald 1995, Simon et al. 2002). The number of sites and the distance between them conform to an intensive point count methodology (Ralph et al. 1992), which we chose with the aim of acquiring good estimates of bird species richness in these rare and confined wetland habitats (Ralph et al. 1995). Counts of two durations were carried out within a standardized area of 0.78 ha, the equivalent of a fixed 50 m radius. Sampling was done on foot or in a paddle boat and each site was visited on a monthly basis for 18 months between November 2008 and April 2010. In station 2, environmental conditions in November 2008 and in January and June of 2009 made access to eight count sites impossible. It was therefore necessary to take eight additional counts in July 2009 and 16 in May of 2010, in order to obtain an equal sample size for both stations.
The first author carried out all counts during the first two hours of daylight, six visits per month were made, including four sites per visit, and sites were visited in a random sequence to exclude the effects of circadian rhythms. The number of individuals of all species seen or heard within the standardized area was recorded. While some birds in flight were included, we distinguished between those individuals that flew over the site without stopping and those that entered repeatedly to exploit resources or environmental conditions. In this way, we only included those individuals observed interacting with the site (Remsen 1994, Gómez de Silva et al. 1999). We divided a 20-minute count duration in two 10-minute intervals, which were not considered as independent, but rather as cumulative (Buskirk and McDonald 1995, Dawson et al. 1995, Lynch 1995). Only those birds not detected in the first 10 minutes were included in the second interval, with the specific intention of generating samples of differing durations but comparable in all other attributes (i.e. location, time, date and observer).
Our estimates of total richness for the overall study and constituent stations only included species observed interacting with the estuarine and mangrove habitat types. We combined species recorded during point counts (irrespective of the fixed radius), those detected during the approach to and movements between count sites, and those observed during random searches from 2006 to 2010. We also incorporated six additional species recorded within the mangrove forest in a previous study that combined random searches with mist netting (Bojorges-Baños 2011). Two other available surveys were not used to estimate total richness, because one had only recorded species that we ourselves recorded (Mellink et al. 1998) and the other included habitat types in addition to mangrove and estuary (Becerril 2001). Nonetheless, we identified species that the three recent surveys in the study area had not recorded (Mellink et al. 1998, Becerril 2001, Bojorges-Baños 2011). We report all results using the nomenclature, taxonomy and sequence of the American Ornithologists' Union check-list of North American birds (AOU 1998), including the fifty-fourth and previous supplements (Chesser et al. 2013).
Analyses of estimates
To generate a statistical expectation of observed species density (SOBS) for both 10 and 20-minute counts, we randomized the standardized sampling databases 100 times, using re-sampling with replacement in EstimateS software (Colwell 2009). We applied eight species richness estimators with the same software and procedure: Incidence-based Coverage Estimator (ICE), Abundance-based Coverage Estimator (ACE), Chao 1 (CH1), Chao 2 (CH2), first order jackknife (JK1), second order jackknife (JK2), Bootstrap (BS) and Michaelis-Menten (runs method: MM). To obtain representative sub-groups for further analyses of SOBS and the richness estimators, we extracted the 100 randomizations corresponding to each of six samples for each count duration (n=1,200), with the six samples separated by three-month intervals from 3 to 18 months.
Based on the estimated total richness of the overall study, we plotted the inaccuracy of SOBS and each estimator using the average squared relative error of representative sub-groups and evaluated estimator precision by visually inspecting the central dispersion of inaccuracy (Brose et al. 2003). We used Mann-Whitney U-tests to determine differences between the estimators (two-tailed α=0.05), analysing the numerical estimates rather than the inaccuracy measures. We calculated the percentages that maximum estimates of both count durations comprised of the total richness, using resampling without replacement and 1,000 randomizations. We refer to this percentage as estimate coverage, as an analogous term to Chao and Jost's use of sample coverage (2012).
We used the criteria of minimum inaccuracy (sensu Brose et al. 2003) to select one species richness estimator for further analysis. We generated randomized species accumulation curves of this richness estimator and SOBS to evaluate species density in the overall study with both point count durations (Gotelli and Colwell 2001). In order to obtain a temporally structured reference, we plotted the samples representing the six three-month intervals, with the total richness included as a reference. We obtained the estimates and confidence intervals of SOBS using the Mao Tau algorithm in EstimateS (Colwell et al. 2004, Colwell 2009). Following the justification of Payton et al. (2003), in which theoretical and simulation results are used to demonstrate the low rate of type I error in the comparison of 95% CI, we used the recommended 84% CI in the comparison of the two count durations to approximate a test with α=0.05. We applied 1,000 randomizations using re-sampling without replacement to generate averages and 84% CI for the selected species richness estimator. Owing to the conditional character of confidence intervals generated by re-sampling without replacement, these are omitted for the sample corresponding to 18 months. In order to evaluate the effect that count duration may have on estimator variables, we plotted the accumulated numbers of singletons, doubletons, uniques, and duplicates, using averages of 1,000 randomizations (Longino et al. 2002).
We used the species richness estimator with minimum inaccuracy and the count duration we judged as superior to apply a comparative analysis of bird diversity in stations 1 and 2, combining both species richness and species density in a graphical representation. We generated sample-based rarefaction curves with the abscissa re-scaled to individuals (Gotelli and Colwell 2001), presenting 84% CI that were computed with the Mao Tau algorithm for SOBS and that were generated with 1,000 randomizations using re-sampling without replacement for the selected species richness estimator (Payton et al. 2003). To indicate the species densities within the context of the temporally structured reference, we identified and plotted the samples corresponding to the number of individuals recorded for each three-month interval. To further explore comparisons of estimates between habitat types, we used total richness for each station separately to consider estimate coverage for SOBS and we used three-month intervals to review percentage values of SOBS relative to species richness estimator values (sampling coverage sensu Chao and Jost 2012).
Results
Standardized sampling consisted of 432 point counts, with a total sampling effort of 114 hours, 11,616 and 15,290 individuals being recorded with 10 and 20-minute counts respectively. One hundred and forty-six species were observed in the overall study with 10-minute counts and 155 with 20-minute counts. The total richness for the overall study was 185, including 89 species that were additional to the three recent surveys that we reviewed (Mellink et al. 1998, Becerril 1999, Bojorges-Baños 2011; Annex 1).
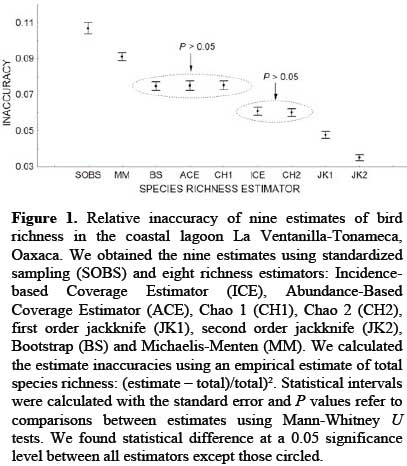
The SOBS estimates presented the greatest inaccuracy (Figure 1) with values significantly different to the richness estimators (P<0.05), 10 and 20-minute counts produced estimate coverages of 79% and 84%, respectively. The MM estimator generated values significantly below those of the non-parametric estimators (P<0.05) and achieved estimate coverages of 78% and 82% with 10 and 20-minute counts. BS, CH1 and ACE produced similar results (P>0.05), with estimate coverages for 10 minutes of 85%, 82% and 84%, respectively, and 89%, 89% and 90% for 20 minutes. There was no significant difference between CH2 and ICE (P>0.05) but these estimators did differ significantly from the others (P<0.05). Estimate coverage of CH2 was 83% with 10 minutes and 92% with 20, while corresponding values of ICE were 86% and 90%. Significant differences distinguished the jackknife models from the others and separated JK1 from JK2 (P<0.05). The estimate coverage with 10 and 20-minute counts was 90% and 95% with JK1 and 89% (164 species) and 99% (184 species) for JK2 (Figure 1).
The randomized species accumulation curve of observed species densities as a function of three-month intervals did not produce an asymptote and the plotted 84% CI of the 10 and 20-minute counts displayed intermittent overlap (Figure 2A). The difference between the plotted values of SOBS for the two point count durations diminished slightly as a function of accumulated samples, while the lag between equal densities became successively greater (Figure 2A). The selected richness estimator (JK2) did not produce an asymptote either, and the plots for 10 and 20-minute point counts presented divergent tendencies towards the right of the graph (Figure 2B). Plots of both the doubletons and the duplicates displayed a marked ascending tendency with 10-minute counts, in contrast with the other curves in Figure 3.
Based on our previous findings, we used SOBS and JK2 estimates from 20-minute counts for analytical comparisons between stations. With the resulting rarefaction curve, the SOBS values for station 1 were consistently lower than those of station 2 and the 84% CI did not overlap at comparable numbers of individuals or samples (Figure 4). The ratio of maximum SOBS/total richness was 87/115 species for station 1 and 127/149 for station 2, giving estimate coverages of 76% and 85%, respectively. With regard to sample coverage, the greatest difference between stations was at three months, with 71% in station 1 and 67% in station 2. In the remaining three month intervals, sample coverage increased from 74% to 80% in station 1 and from 74% to 79% in station 2, with the difference between stations exceeding 1% at one point only (1.4% at 15 months).
Discussion
Inaccuracy of standardized sampling The number of bird species detected during the 18 monthly counts at the 24 sites did not approximate the total richness that we obtained for the La Ventanilla-Tonameca coastal lagoon. Even without reference to total richness, incomplete sampling was evident in the standardized species density curves, which did not produce an asymptote (Figure 2A). Similar results can be found in other ornithological studies in tropical wetlands (Macedo et al. 2007, Bojorges-Baños 2011). Furthermore, the number of locally infrequent species remained high throughout the sampling: 14 singletons and 20 uniques persisted at 18 months (Figure 4). Despite this, our SOBS estimate coverage is comparable to (10-minute counts) or higher than (20-minute counts) the coverage reported in the only other comparison to total bird richness that we reviewed (Herzog et al. 2002).
The lack of an asymptote in SOBS could also be indicative of a community that is not delineated, either temporally, spatially or methodologically (Longino et al. 2002). Although the coastal lagoon is an operational ecosystem rather than an arbitrary unit (Palmer and White 1994), the open and complex nature of mangrove ecosystems (Lugo 2002) makes reaching an asymptote with the associated bird species an unlikely possibility. Some species only occur in the lagoon transiently during migration and others are characteristic of the adjacent marine or terrestrial ecosystems, but enter the wetland periodically. Detecting birds with these attributes requires a greater sampling effort than is needed for species which hold summer or winter territories in the lagoon. Thus, the particular characteristics of the coastal lagoon avifauna accentuate the negative bias that is inherent in standardized sampling.
Three species were only detected by mist-netting in the overall study while two more were detected by mist netting in the mangrove, where point counts failed. In accordance with previous observations (Blake and Loiselle 2001), these small passerines species included two Parulidae (Geothlypis tolmiei and Setophaga magnolia) and two species that forage at low levels (Arremonops rufivirgatus and Pheugopedius felix; Annex 1). Importantly, point counts failed to detect a further 27 species in the overall study. In addition to non-standardized sampling effort, increasing microhabitat diversity by including areas outside point count sites but within habitat types may have contributed to this discrepancy. Observations made during point counts but of individuals outside the fixed radius were common in conditions of extensive visibility in the estuary environment, particularly for shore birds and waterbirds. Species recorded outside standardized sampling in the mangrove were typically big and sometimes vocally noticeable (e.g., raptors, waterbirds, Amazona oratrix and Campephilus guatemalensis). Other species not recorded in point counts at either station included three crepuscular species (two Caprimulgidae and one Strigidae), two hummingbirds (Trochilidae) and five passerines (Annex 1).
If the objective of a study is to estimate total richness, then there are obvious advantages to accumulating observations over various years and combining sampling techniques (Taylor et al. 1976, Bojorges et al. 2006). The total richness of the study zone is very high relative to other ornithological studies in Oaxaca (Navarro et al. 2004). However, this is not an over-estimation because we implemented a protocol that promoted habitat-specific sampling and the inclusion of ecologically relevant species only (Remsen 1994, Gómez de Silva et al. 1999). As recommendations, we suggest using mist-netting as a complementary method to point counts, optimizing field trips by recording data between counts and outside radii, and exploiting random searches to overcome identification challenges.
On the other hand, if the objective is to use species richness for analysing spatial patterns or making robust comparisons, then using sample units of equal dimensions controls the effect of area (Whittaker et al. 2001) and a balanced sampling design allows more than one standardized method to be used (e.g., Rappole et al. 1998). If combining sampling methods influences the area sampled (e.g., if random searches go beyond fixed radii), then forgoing sample coverage and limiting analyses to point count data may be advantageous. Furthermore, graphical representations of species density as a function of samples, such as Figure 2, are potentially useful for planning studies of bird richness in similar environments (Moreno and Halffter 2001). Even when comparative analysis is not the central objective, we recommend that study design include at least one sampling method with standardized effort in units of equal dimensions, thus conserving the option of achieving unbiased comparisons.
For the present study, we recognize that bias stemming from non-independent observations limits statistical interpretation of data from an intensive point count sampling design (Ralph et al. 1992, Buskirk and McDonald 1995). However, the spatial configuration of mangroves can dictate sampling design and may limit the scale of analysis (Whittaker et al. 2001, Deppe and Rotenberry 2005). The spatial extent and seasonal variation of the La Ventanilla-Tonameca lagoon do not favour an extensive point count sampling design (sensu Ralph et al. 1992) with few repeated counts at each site. For the data we have, we think there is some justification for the rarefaction assumption of random mixing of samples or individuals (Colwell et al. 2004). We think that the statistics we provide are objective estimates of probabilities and that they help to distinguish patterns (Oksanen 2001). Furthermore, future data from replicate lagoons could be used to corroborate them (Oksanen 2001).
Inaccuracy of richness estimators
Derived estimates of species richness are dependent upon the input data and the attributes of our point count sampling methodology governed species richness estimator inaccuracy. Nonetheless, the relative inaccuracies of the eight models we evaluated provide some indication of estimator performance in the context of the present study. The greater inaccuracy of MM may have been due to a poor fit of the model to the data (O'Hara 2005) or the underlying relative abundance distribution (Brose et al. 2003). That the abundance-based CH1 model was statistically more inaccurate than the incidence-based counterpart (CH2) may be attributable to tendencies in the variables that comprise them. Because the ratio between singletons and doubletons was less than between uniques and duplicates, the abundance-based model produced relatively lower estimates than the incidence-based model.
If all other variables are kept constant, then estimates produced with jackknife models increase as a function of sample size. Thus, the use of 432 samples in the present study may have influenced high estimates with JK1 and JK2. The significant difference we found between JK1 and JK2 agrees with the work of Archaux and Bakkaus (2007) and the relatively low inaccuracy of these models is consistent with empirical results (Boulinier et al. 1998) and analyses of simulated landscapes (Brose et al. 2005). The JK2 curves in Figure 2B do not reach a stable asymptote; however, there is no certainty that an asymptote is achievable with non-parametric estimators (Longino et al. 2002). The correct interpretation of the derived estimates is, therefore, as a lower bound, and this is particularly true when rare species are present (Mao and Colwell 2005). This interpretation is also justifiable on account of bias stemming from double counts, as rare species whose individuals are counted more than once become less rare in the database and the resulting estimate is consequently reduced. Thus, with intensive point counts in a habitat patch of limited extension, richness estimators that incorporate rare species (e.g., singletons and doubletons) may present a negative bias.
The effect of point count duration
With regard to point count duration, the 10-minute counts entailed a reduction from 144 to 72 hours sampling effort and excluded only nine species. Based on the interpretation of confidence intervals as a lower bound on total uncertainty (Hahn and Meeker 1993), different point count durations did not detect significantly different numbers of species. On the other hand, the absence of a continuous overlap weakens the case for accepting the null hypothesis and concurs with previous studies in suggesting that different count lengths do produce significantly different estimates (Buskirk and McDonald 1995, Drapeau et al. 1999). The non-linear relationship between sampling effort and species accumulation captures the interaction between count duration and the number of samples taken (Figure 2A). At six months, the 20-minute estimate is 69% of the total richness and there is a time lag of almost three months until the 10-minute counts reach the same estimate coverage. At 12 months, the 20-minute counts reach 79% but the 10-minute estimate does not reach the same coverage until 18 months, thus the time lag between 10 and 20-minute counts increases from three to six months (Figure 2A). We interpreted this as evidence in favour of 20-minute counts, which were subsequently used in the comparison between stations. Furthermore, the weak convergence between the two randomized species accumulation curves suggests that, within practical time frames, a portion of the community detected with 20-minute counts will remain undetected with 10-minute counts.
The effect of count duration on the JK2 estimates was mainly evident in the constituent variables. The number of doubletons and duplicates detected with 10-minute counts continued to increase from the fourth month onwards and the doubleton and singleton curves eventually crossed, as did the curves of uniques and duplicates (Figure 3). In conjunction with differences in SOBS, this produced 10-minute count estimates that were low relative to 20-minute counts. Nonetheless, given the overlapping 84% CI between point count durations, limiting counts to 10 minutes could allow more sites to be visited within the same period of morning activity without obtaining significantly lower JK2 estimates. However, within a fixed time unit there is a direct trade-off between increasing the number of points visited by reducing count duration and decreasing the total time spent counting due to travel time between count sites (Buskirk and McDonald 1995). Perhaps due to the steepness of the apparent path of the sun when at low latitudes, we noticed a marked decrease in bird activity after early morning, leaving a relatively brief opportunity for sampling. Furthermore, in un-flooded conditions, movement on foot over saturated terrain and through vegetation was slow. Therefore, we believe 20-minute counts were justified in the present study on three accounts: increasing lag between count durations, decreasing trends in doubletons and duplicates, and sampling logistics in tropical wetlands.
Estimates from two habitat types
In our comparative analysis of bird diversity, the use of standardized sampling effort and area facilitated a graphical representation that displays the number of species both as a function of individuals and at comparable numbers of samples. The rarefaction curves of stations 1 and 2 gave clear evidence that greater species richness and density were found in the area without mangrove (Figure 4), concurring with observations made by Amador et al. (2006). This result highlights the significance of sampling outside mangroves when estimating bird richness in tropical wetlands. Interpreting the mangrove avifauna as representative of a coastal lagoon may lead to under-estimation, whereas unintentionally including areas of mudflats with other hydrophytic communities, when the study is in fact focusing on mangrove avifauna, would probably lead to over-estimation. These errors could be avoided by establishing sampling units well within habitat types and clearly stating the focal community under study.
The SOBS estimate for station 1 is similar to previous richness values recorded in La Ventanilla (Becerril 2001, Bojorges-Baños 2011) and other mangroves (Lefebvre and Poulin 1997, Chaves-Fonnegra et al. 2005, Macedo et al. 2007), although estimate coverage reiterates greater species detection when using combined sampling techniques. Indeed, the total richness estimate for station 2 is regionally high (Navarro et al. 2002) and that of station 1 exceeds richness estimates for Neotropical mangroves (Lefebvre and Poulin 1997, Naranjo 1997, Becerril 2001, Chaves-Fonnegra et al. 2005, Macedo et al. 2007, Bojorges-Baños 2011). While we have confidence in accepting a clear margin between SOBS and total richness within both stations, further comparisons of estimate coverage are flawed by the unstandardized sampling effort used to estimate total richness within stations. We perceive contradictory signals in the lesser estimate coverage but greater tendency towards an asymptote in station 1, relative to station 2. While possible explanations for differences between stations are easy to conceive (e.g., denser vegetation and use of mist-netting in station 1 increasing the difference between SOBS and total richness), the analysis underscores the difficulty in making comparisons when standardized sampling methods and effort are not used.
The relationship between SOBS and JK2 (i.e., sample coverage) only reflects standardized sampling and provides a more reliable basis than comparisons involving total richness estimates for habitat types. Differences in species composition (Annex 1) presumably led to heterogeneous detection probabilities between stations (Boulinier et al. 1998). However, the close similarity between the sample coverage in station 1 and 2 precludes discrimination between them in terms of JK2 performance and we suggests that the relaxed assumptions of species-specific detection probabilities made the model robust to differences in species abundance (Boulinier et al. 1998).
Conclusions
The analyses of data from standardized point count sampling in conjunction with an estimate of total richness has allowed us to draw some context-specific conclusions with regard to bias in estimates of bird diversity. Of the species richness estimators compared, the non-parametric models that are incidence-based displayed lower inaccuracy and the jackknife models were optimum. With 20-minute counts the JK2 model gave an estimate coverage very close to 100% and the database from this count duration produced variables that generated higher, and thus more accurate estimates. Finally, the presence or absence of mangroves in sample units had a significant effect on species richness estimates. Therefore, a balanced sampling design should be used to estimate bird richness in a coastal lagoon or a habitat-specific design should be used to sample either in mangroves or in mudflats with other hydrophytic communities.
Acknowledgements
The fieldwork and research for this article were supported by the Consejo Nacional de Ciencia y Tecnología (CONACyT, grant 2999) of Mexico and by the Universidad del Mar, Oaxaca. We wish to thank S.C. de C.V. Servicios Ecoturisticos La Ventanilla and the Aragón Arvea family for the loan of boats. We are grateful to R.A. López Pérez for his comments during the initial stages of the study and we sincerely appreciate the observations of two anonymous referees.
Literature cited
Amador, E., R. Mendoza Salgado and J.A. de Anda Montañez. 2006. Estructura de la avifauna durante el periodo invierno-primavera en el estero Rancho Bueno, Baja California Sur. Revista Mexicana de Biodiversidad 77:251-259. [ Links ]
AOU (American Ornithologists' Union). 1998. Check-list of North American birds, 7a ed. American Ornithologists' Union. Washington, DC, USA. [ Links ]
Archaux, F. and N. Bakkaus. 2007. Relative impact of stand structure, tree composition and climate on mountain bird communities. Forest Ecology and Management 247:72-79. [ Links ]
Becerril Morales, F. 1999. Caracterización de la avifauna en los sistemas lagunares Chacahua-Pastoría y Corralero-Alotengo, Oaxaca, Mexico (Año 1998-1999). Sistema de Investigación Benito Juárez-Consejo Nacional de Ciencia y Tecnología-Universidad del Mar, Puerto Ángel, México. [ Links ]
Becerril Morales, F. 2001. Distribución, abundancia y biología reproductiva en la comunidad de aves del estero La Ventanilla, Oaxaca. Instituto de Ecología, Universidad del Mar, Puerto Ángel, Mexico. [ Links ]
Blake, J.G. and B.A. Loiselle. 2001. Bird assemblages in second-growth and old-growth forests, Costa Rica: perspectives from mist nets and point counts. Auk 118:304-326. [ Links ]
Bojorges-Baños, J.C. and L. López-Mata. 2006. Asociación de la riqueza y diversidad de especies de aves y estructura de la vegetación en una selva mediana subperennifolia en el centro de Veracruz. Revista Mexicana de Biodiversidad 77:235-249. [ Links ]
Bojorges B., J.C., L. López-Mata, L.A. Tarango-Arámbula, J.G. Herrera-Haro and G.D. Mendoza-Martínez. 2006. Combinación de métodos de muestreo para registrar la riqueza de especies de aves en ecosistemas tropicales. Universidad y Ciencia 22:111-118. [ Links ]
Bojorges-Baños, J.C. 2011. Riqueza y diversidad de especies de aves asociadas a manglar en tres sistemas lagunares en la región costera de Oaxaca. Revista Mexicana de Biodiversidad 82:205-215. [ Links ]
Boulinier, T., J.D. Nichols, J.R. Sauer, J.E. Hines and K.H. Pollock. 1998. Estimating species richness: the importance of heterogeneity in species detectability. Ecology 79:1018-1028. [ Links ]
Brose, U., N.D. Martinez and R.J. Williams. 2003. Estimating species richness: sensitivity to sample coverage and insensitivity to spatial patterns. Ecology 84:2364-2377. [ Links ]
Buskirk, W.H. and J.L. McDonald. 1995. Comparison of point count sampling regimes for monitoring forest birds. Pp. 25-34. In: C.J. Ralph, J.R. Sauer and S. Droege (eds.). Monitoring bird populations by point counts. Pacific Southwest Research Station, Forest Service, U.S. Department of Agriculture, Berkeley, California. [ Links ]
Chaves-Fonnegra, A., M. Fiorenzano, A.M. Pantaleón-Lizarazú, D.F. Rodríguez-Gacha, A. Franco-Herrera and M. López-Victoria. 2005. Aves de un manglar en el PNN Tayrona, Caribe Colombiano. Boletín SAO 15:3-12. [ Links ]
Chao, A. and L. Jost. 2012. Coverage-based rarefaction and extrapolation: standardized samples by completeness rather than size. Ecology 93:2533-2547. [ Links ]
Chesser, R.T., R.C. Banks, F.K. Barker, C. Cicero, J.L. Dunn, A.W. Kratter, I.J. Lovette, P.C. Rasmussen, J.V. Remsen Jr., J.D. Rising, D.F. Stotz and K. Winker. 2013. Fifty-fourth supplement to the American Ornithologists' Union check-list of North American birds. Auk 130:558-571. [ Links ]
Colwell, R.K. and J.A. Coddington. 1994. Estimating terrestrial biodiversity through extrapolation. Philosophical Transactions of the Royal Society of London, Series B 345:101-118. [ Links ]
Colwell, R.K., C.X. Mao and J. Chang. 2004. Interpolating, extrapolating, and comparing incidence-based species accumulation curves. Ecology 85:2717-2727. [ Links ]
Colwell, R.K. (on line). 2009. EstimateS: Statistical estimation of species richness and shared species from samples. Versión 8.2. <viceroy.eeb.uconn.edu/estimates/> (Consulted on the 20th of July 2009). [ Links ]
Dawson, D.K., D.R. Smith and C.S. Robbins. 1995. Point count length and detection of forest Neotropical migrant birds. Pp. 35-43. In: C.J. Ralph, J.R. Sauer and S. Droege (eds.). Monitoring bird populations by point counts. Pacific Southwest Research Station, Forest Service, U.S. Department of Agriculture, Berkeley, California. [ Links ]
Deppe, J.L. and J.T. Rotenberry. 2005. Temporal patterns in fall migrant communities in Yucatan, Mexico. Condor 107:228-243. [ Links ]
Drapeau, P., A. Leduc and R. McNeil. 1999. Refining the use of point counts at the scale of individual points in studies of bird-habitat relationships. Journal of Avian Biology 30:367-382. [ Links ]
Fuller, R.J. 2012. The bird and its habitat: an overview of concepts. In: R.J. Fuller (ed.). Birds and habitat: relationships in changing landscapes. Cambridge University Press. New York, USA. [ Links ]
Gómez de Silva G., H., F. González-García and M.P. Casillas-Trejo. 1999. Birds of the upper cloud forest of El Triunfo, Chiapas, Mexico. Ornitologia Neotropical 10:1-26. [ Links ]
González-Oreja, J.A., A.A. de la Fuente-Díaz-Ordaz, L. Hernández-Santín, D. Buzo-Franco and C. Bonache-Regidor. 2010. Evaluación de estimadores no paramétricas de la riqueza de especies. Un ejemplo con aves en áreas verdes de la ciudad de Puebla, México. Animal Biodiversity and Conservation 33:31-45. [ Links ]
Gotelli, N.J. and R.K. Colwell. 2001. Quantifying biodiversity: procedures and pitfalls in the measurement and comparison of species richness. Ecology Letters 4:379-391. [ Links ]
Hahn, G.J. and W.Q. Meeker. 1993. Assumptions for statistical inference. The American Statistician 47:1-11. [ Links ]
Hernández Santana, J.R., M.A. Ortiz Pérez and M. Figueroa Mah Eng. 2009. Análisis morfoestructural del estado de Oaxaca, México: un enfoque de clasificación tipológica del relieve. Investigaciones Geográficas 68:7-24. [ Links ]
Herzog, S.K., M. Kessler and T.M. Cahill. 2002. Estimating species richness of tropical bird communities from rapid assessment data. Auk 119:749-769. [ Links ]
Karr, J.R. 1981. Surveying birds in the tropics. Studies in Avian Biology 6:548-553. [ Links ]
Lefebvre, G. and B. Poulin. 1997. Bird communities in Panamanian black mangroves: potential effects of physical and biotic factors. Journal of Tropical Ecology 13:97-113. [ Links ]
Longino, J.T., J. Coddington and R.K. Colwell. 2002. The ant fauna of a tropical rain forest: estimating species richness three different ways. Ecology 83:689-702. [ Links ]
Lugo, A.E. and S.C. Snedaker. 1974. The ecology of mangroves. Annual Review of Ecology and Systematics 5:39-64. [ Links ]
Lugo, A.E. 2002. Conserving Latin American and Caribbean mangroves: issues and challenges. Madera y Bosques 8:5-25. [ Links ]
Lynch, J.F. 1995. Effects of point count duration, time-of-day, and aural stimuli on detectability of migratory and resident bird species in Quintana Roo, Mexico. Pp. 1-6. In: C.J. Ralph, J.R. Sauer and S. Droege (eds.). Monitoring bird populations by point counts. Pacific Southwest Research Station, Forest Service, U.S. Department of Agriculture, Berkeley, California. [ Links ]
Macedo Mestre, L.A., R. Krul. and V. dos Santos Moraes. 2007. Mangrove bird community of Paranaguá Bay - Paraná, Brazil. Brazilian Archives of Biology and Technology 50:75-83. [ Links ]
Mao, C.X. and R.K. Colwell. 2005. Estimation of species richness: mixture models, the role of rare species, and inferential challenges. Ecology 86:1143-1153. [ Links ]
Martínez-Martínez, B.Z. and F.G. Cupul-Magaña. 2002. Listado actualizado de aves acuáticas de la desembocadura del Río Ameca, Bahía de Banderas, México. Ciencia y Mar 16:39-43. [ Links ]
Mellink, E., J. Luévano and I. Zuria. 1998. Nota sobre los Pelecaniformes, Ciconiiformes, gallitos marinos (Sterninae) y rayadores (Rynchopinae) de la costa chica de Oaxaca, México. Ciencias Marinas 24:367-388. [ Links ]
Moreno, C.E. and G. Halffter. 2000. Assessing the completeness of bat biodiversity inventories using species accumulation curves. Journal of Applied Ecology 37:149-158. [ Links ]
Moreno, C.E. and G. Halffter. 2001. On the measure of sampling effort used in species accumulation curves. Journal of Applied Ecology 38:487-490. [ Links ]
Naranjo, L.G. 1997. A note on the birds of the Colombian Pacific mangroves. Pp. 64-70. In: B. Kejerfve, L.D. Lacerda and E.S. Diop (eds.). Mangrove ecosystem studies in Latin America and Africa. United Nations Educational Scientific and Cultural Organization, Paris. [ Links ]
Navarro S., A.G., E.A. García-Trejo, A.T. Peterson and V. Rodríguez-Contreras. 2004. Aves. Pp. 391-421. In: A.J. García-Mendoza, M.J. Ordóñez and M. Briones-Salas (eds.). Biodiversidad de Oaxaca. Instituto de Biología, UNAM-Fondo Oaxaqueño-WWF, México. [ Links ]
O'Hara, R.B. 2005. Species richness estimators: How many species can dance on the head of a pin? Journal of Animal Ecology 74:375-386. [ Links ]
Oksanen, L. 2001. Logic of experiments in ecology: Is pseudoreplication a pseudoissue? Oikos 94:27-38. [ Links ] Palmer, M.W. 1990. The estimation of species richness by extrapolation. Ecology 71:1195-1198. [ Links ]
Palmer, M.W. and S.P. White. 1994. On the existence of ecological communities. Journal of Vegetation Sciences 5:279-282. [ Links ]
Payton, M.E., M.H. Greenstone and N. Schenker. 2003. Overlapping confidence intervals or standard error intervals: What do they mean in terms of statistical significence? Journal of Insect Science 3:6pp. [ Links ]
Pérez-Morga, N., T. Kretzschmar, T. Cavazos, S.V. Smith and F. Munoz-Arriola. 2013. Variability of extreme precipitation in coastal river basins of the southern mexican Pacific region. Geofísica International 52:277-291. [ Links ]
Ralph, C.J., G.R. Geupel, P. Pyle, T.E. Martin, D.F. DeSante and B. Mila. 1992. Manual de métodos de campo de aves terrestres. Pacific Southwest Station, Forest Service, U.S. Department of Agriculture, Berkeley, California. [ Links ]
Ralph, C.J., S. Droege and J.R. Sauer. 1995. Managing and monitoring birds using point counts: standards and applications. Pp. 161-168. In: C.J. Ralph, J.R. Sauer and S. Droege (eds.). Monitoring bird populations by point counts. Pacific Southwest Research Station, Forest Service, U.S. Department of Agriculture, Berkeley, California. [ Links ]
Rappole, J.H., K. Winker and G.V.N. Powell. 1998. Migratory bird habitat use in southern Mexico: mist nets versus point counts. Journal of Field Ornithology 69:635-643. [ Links ]
Remsen Jr., J.V. 1994. Use and misuse of bird lists in community ecology and conservation. Auk 111:225-227. [ Links ]
Ruiz Bruce Taylor, M.D.M., J.L. Rangel-Salazar and B. Cortés Hernández. 2013. Resilience in a Mexican Pacific mangrove after hurricanes: implications for conservation restoration. Journal of Environmental Protection 4:1383-1391. [ Links ]
Simon, J.C., T.K. Pratt, K.E. Berlin, J.R. Kowalsky, S.G. Fancy and J.S. Hatfield. 2002. Temporal variation in bird counts within a Hawiian rainforest. Condor 104:469-481. [ Links ]
Taylor, L.R., R.A. Kempton and I.P. Woiwod. 1976. Diversity statistics and the log-series model. Journal of Animal Ecology, 45:255-272. [ Links ]
Tovilla Hernández, C., F. Ovalle Estrada, J.C. de la Presa Pérez and D.T. González Castillo. 2010. Segundo informe: Inventario y monitoreo del estado actual de los bosques de manglar de Chiapas y Oaxaca. Laboratorio de ecología de manglares y zona costera, El Colegio de la Frontera Sur, Unidad Tapachula. [ Links ]
Trejo, I. 2004. Clima. Pp. 67-85. In: A.J. García-Mendoza, M. de J. Ordóñez and M. Briones-Salas (eds.). Biodiversidad de Oaxaca. Instituto de Biología UNAM-Fondo Oaxaqueño-WWF, México. [ Links ]
Ugalde-Lezama, S., J.L. Alcántara-Carbajal, J.I. Valdez-Hernández, G. Ramírez-Valverde, J. Velázquez-Mendoza and L.A. Tarángo-Arámbula. 2010. Riqueza, abundancia y diversidad de aves en un bosque templado con diferentes condiciones de perturbación. Agrociencia 44:159-169. [ Links ]
Whittaker, R.H., S.A. Levin and R.B. Root. 1973. Niche, habitat, and ecotope. American Naturalist 107:321-338. [ Links ]
Whittaker, R.J., K.J. Willis and R. Field. 2001. Scale and species richness: towards a general, hierarchical theory of species diversity. Journal of Biogeography 28:453-470. [ Links ]
Willot, S.J. 2001. Species accumulation curves and the measure of sampling effort. Journal of Applied Ecology 38:484-486. [ Links ]

