


 nova página do texto(beta)
 Inglês (pdf)
 Artigo em XML
 Referências do artigo
 Enviar este artigo por email
 Citado por SciELO
  Similares em
SciELO
Similares em
SciELO 
 Permalink
Introduction
The world’s population has continued to increase, in absolute terms, although its growth rate has decreased since the 1970s. For example, from 1980 to 2000, the world population went from 4,400 to 6,000 million, and by 2018, it had reached 7,594 million (World Bank, 2020). This increase in population has amplified the demand for energy consumption in recent decades. Specifically, energy consumption, production, and international trade tend to move together, so it is very important to analyze their inter-relationships (Nasreen & Anwar, 2014). Trade openness allows developing countries to import advanced technologies that are less energy intensive and produce more goods. Energy can, in turn, affect trade openness in the following way: energy is indispensable in the production process, and it is necessary for the transportation of traded goods. If energy plays an important role in increasing the flow of goods, then policies to reduce energy consumption may negatively affect trade flows and the benefits of this same trade (imports or exports) (Nasreen & Anwar, 2014).
Hypotheses about the connection between economic growth and environmental degradation have been among the most important topics studied empirically in the literature of ecological economics since the 1990s, especially since carbon dioxide emissions are a main factor affecting global warming (Narayan & Narayan, 2010). In fact, of all the greenhouse gases, carbon dioxide (CO2) emissions are the most problematic and difficult to manage, with a very long life span (50-200 years). Most CO2 emissions, the evidence shows, are generated by energy consumption from fossil-fuel sources and by cement production (Azomahou, Laisney, & Van Phu 2006; Wang, 2012).
This increase in energy consumption generates negative consequences in terms of environmental degradation. Achieving greater economic growth with lower resource use without compromising the quality of life of future generations should be one of the main concerns of all governments in the world, due to the growing threat of global warming and climate change. Therefore, an urgent problem for those responsible for environmental policy is to understand and predict how environmental quality will evolve as economic activity increases (Onafowora & Owoye, 2014).
Despite increasing attention to the issue of pollution and corresponding efforts to reduce its negative effects, fossil fuels continue to be the main source of global energy consumption. In the last 25 years, these fossil fuels have accounted for 81% of global energy use. Between 1989 and 2014 the use of oil decreased from 37% to 31%, while the use of natural gas increased from 19% to 21% -and of coal from 25% to 28%- during this same period (International Energy Agency [IEA], 2016).
Every year, 6.1 million people die from air pollution caused mainly by the production and consumption of energy. The production and use of energy are the most significant individual sources of air pollution, accounting for 85% of the particulate pollution and almost all of the sulfur and nitrogen oxides released into the environment. These three pollutants either directly cause air pollution in the atmosphere, or indirectly cause it through chemical reactions (IEA, 2016).
The environmental Kuznets curve (EKC) hypothesis indicates an inverted U-shaped relationship between different pollutants and the level of per capita income (Dinda, 2004). At low levels of development, the amount and intensity of environmental degradation is restricted to subsistence economic activity. As economic development accelerates with the intensification of agriculture, the extraction of other resources, and the start of industrialization, resource depletion rates exceed the rate of resource regeneration, and the generation of waste increases in quantity and toxicity. At the highest levels of development, structural change toward information-intensive industries and services, together with a greater awareness of environmental damage, environmental spending, and the application of environmental regulations and better technology, allows for a gradual reduction of environmental degradation (Panayotuo, 1993). Environmental pressures increase faster than income in the early stages of development, but subsequently, when the levels of economic growth are higher, environmental pressure slows down (Dinda, 2004). Recently, some of the research on the EKC hypothesis has included the consumption of renewable energy as one of the variables under study; including this variable helps support the hypothesis, because the increase in the share of renewable energy serves to reduce environmental pressure and dependence on fossil fuels (see for example Sarkodie & Ozturk, 2020).
The present paper focuses on the North American Free Trade Agreement (NAFTA) member countries as a particularly significant and telling case study. It is important to know if the EKC hypothesis is confirmed in this case, because the three North American countries are strongly interrelated and mutually integrated, as is reflected in their business relationships. For example, for the year 2015, Mexico’s exports to, and imports from, the United States represented 81.18% and 47.39%, respectively, of all Mexico’s exports and imports, while exports from the United States to Canada and Mexico constituted 18.62% and 15.72% of all U.S. exports, respectively. Further, although trade between Mexico and Canada still remains insignificant (World Bank, 2016), Canada’s exports to, and imports from, the U.S. accounted for 76.66% and 53.25% of all Canadian exports and imports, respectively.
Because of the close relationships involved, an analysis of the NAFTA member countries promises to reveal evidence about the relationship between trade openness and renewable energy consumption vis-à-vis environmental pollution in these countries, in addition to evidence about the relationship between pollution and economic growth. This evidence, in turn, can be taken into account in the elaboration of economic and environmental policies that allow for greater economic growth while reducing environmental degradation. Indeed, taking advantage of the economic benefits of trade and reducing environmental degradation should be the main objectives of this treaty. Through an econometric analysis with panel data for the period 1971-2014, the relationships among economic growth, consumption of renewable energy, trade openness, and environmental degradation in the NAFTA member countries are analyzed to answer the following questions: Is there a long-run relationship between economic growth, consumption of renewable energy, trade openness, and environmental degradation for the NAFTA member countries? What is the direction of the causal relationships, in Granger’s sense, among the variables for the NAFTA member countries? Is the EKC hypothesis confirmed?
The article contributes to the current literature in two ways. First, it is the first study to analyze the Kuznets environmental curve in the NAFTA countries, including trade openness (TO) and renewable energy consumption (RE) as additional variables in the analysis. Second, the study evaluates the proposal recently developed by Dumitrescu and Hurlin (2012) to test causality in heterogeneous panel data models.
This article is structured as follows: After this introduction, a brief literature review is provided. Then, the third section outlines the econometric methodology and provides more details about the data used for the analysis. The fourth section presents and interprets the results, and fifth section concludes the study.
Literature review
Review of theoretical literature
The EKC hypothesis indicates an inverted U-shaped relationship between different pollutants and the level of per capita income (Dinda, 2004). That is, as shown in Figure 1, at the early stages of development, environmental pressure increases faster than income while at higher levels of economic growth, it is slower (Dinda, 2004).
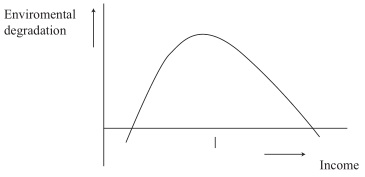
In the first stage of industrialization, the fastest growth causes greater use of natural resources and emission of pollutants, which impact the environment. People are indifferent to the consequences of the degradation of the environment due to economic growth. In the stage after industrialization, when income increases, people value the environment more and regulatory institutions become more effective so that pollution levels decrease (Dinda, 2004). The hypothesis explains that when the level of income of the country is low, there is a positive relationship between income and environmental degradation. When the country reaches a certain level of economic development, however, the relationship is negative (Al-Mulali Tang, & Ozturk, 2015). To test the EKC hypothesis, the following model can be used (Dinda, 2004):
where y is an indicator of environmental degradation, x is the level of income, and z are other variables that can influence the environment. From equation (1), several relationships between environmental impacts and modes of development/economic growth can be tested (Dinda, 2004). The hypothesis is fulfilled only when β2 > 0, β3 < 0 y β4 = 0.
in equation (1), and the turning point or inflection is obtained when
The EKC hypothesis establishes that emissions are a function of income and presumes a unidirectional causal relationship leading from income to emissions (Apergis & Payne, 2009). The hypothesis also carries with it important political implications. One concerns the inevitability of environmental degradation in the development path of a given country, that is, during the early stage of industrialization. Another concerns the effects of higher per capita income later in the development process, when economic growth goes from being an enemy of the environment to a friend. Here the question remains whether such late shifts can undo the environmental damage done previously, typically for extended periods of time (Panayotuo, 1993). All this being said, however, economic growth does seem to be a powerful way to improve environmental quality in developing countries. If economic growth is good for the environment, policies aiming to stimulate growth, such as trade openness or economic reform, should also be good for the environment (Panayotuo, 1993). It seems that in the long run, the best way to improve the environment is to become rich (Beckerman, 1992). In other words, when there is (as the EKC hypothesis predicts) an inverse relationship between economic growth and environmental degradation in an economy, it means that economic development causes an environmental improvement after per capita income reaches a critical threshold (Pontarollo & Mendieta Muñoz, 2020; Sarkodie & Ozturk, 2020). According to Zilio (2012), this pattern can be explained as follows: if the poorest sectors of society cannot cover their basic needs, such as nutrition, education, and healthcare, they will not demand environmental improvements (Zilio, 2012). Conversely, the richest societies will demand measures to achieve less environmental degradation and exert pressure to establish protective measures and stricter regulations (Dinda, 2004).
Finally, the literature in this area considers the impact of trade liberalization on the environment through three channels. The first channel is the scale effect due to the fact that trade liberalization increases the size of the market, production, and therefore emissions. The second is the technical effect, which refers to the importation of more efficient and environmentally friendly technology. The third is the composition effect, which suggests that trade liberalization can reduce or increase emissions depending on whether a given country has a comparative advantage when it comes to clean versus dirty industries (Antweiler, Copeland & Taylor, 2001). It is evident that this third channel, though it depends on the other two, will carry the strongest environmental impacts.
Review of empirical literature
Panayotuo (1993) was one of the first authors to prove the hypothesis that an inverted U relationship exists between environmental degradation and economic development, and to explore the economic policy implications of that hypothesis for employment, technology transfer, and development assistance. Based on cross-sectional data, their results support the hypothesis of an inverted U for a sample of developed and developing countries. This inverted U is called the EKC hypothesis because of its similarity to the relationship between inequality and development.
It should be noted that there is an extensive literature consisting of empirical studies of the EKC hypothesis; those studies have not, however, produced results about which there is a generalized consensus. The following studies that provide evidence in favor of the hypothesis: Adebola Solarin, Al-Mulalia, and Ozturk (2017); Ahmad, Du, Lu, Wang, and Li (2017); Al-Mulali et al. (2015); Hanif and Gago de Santos (2017); Ike, Usmanab, and Sarkodie (2020); Riti, Song, Shu, and Kamah (2017); Sarkodiea and Ozturk, 2020; Sinha and Bhattacharya (2017); Yang, Lou, Sun, Wang, and Wang (2017); Zhang et al. (2017); Zhao, Guo, and Zhao (2018); Zoundi (2017). Studies that found evidence contradicting the EKC hypothesis are: Alshehry and Belloumi (2017); Ben Jebli and Ben Youssef (2015); Catalán (2014); Cheng, Ren, and Wang (2019); Lin, Omoju, Nwakeze, Okonkwo, and Megbowon (2016); Özokcu and Özdemir (2017); Ozturk and Al-Mulali (2015); Pablo-Romero and De Jesús (2016); Pontarollo and Mendieta Muñoz (2020); Shujah-ur-Rahman, Chen, Saud, Saleem, and Bari (2019); Vlontzos, Niavis, and Pardalos (2017). In other studies, the evidence is mixed; for example: Alam, Murad, Noman, and Ozturk (2016); Al-Mulali, Ozturk, and Solarin (2016); Apergis, Christoua, and Gupta (2017); Azam and Kham (2016); Liu, Kim, Li- ang, and Oh-Sang (2018); Sterpu, Soava, and Mehedintu (2018); Urban and Nordensvärd (2018); likewise, there are many studies of the direction(s) of causality between the variables of economic growth and carbon dioxide emissions, but these studies, too, have not reached a consensus on the results (see for example, Alshehry & Belloumi, 2015; Cowan, Chang, Inglesi-Lotz & Gupta, 2014; Chang, 2010; Soytas & Sari, 2009; Zhang & Cheng, 2009). In addition to analyzing the relationship between these variables, researchers have included additional economic variables to avoid the problem of the omitted variable, such as energy consumption, capital, labor, exports, imports, trade openness, and foreign direct investment (FDI) (see, for example, Al-Mulali et al., 2015; Apergis & Payne, 2009). Research on the EKC hypothesis has also included the consumption of renewable energy as one of the variables under study, because the evidence shows that the increase in renewable energy consumption can help reduce environmental pressure and dependence on fossil fuels (see, for example, Al-Mulali et al., 2016; Cheng et al., 2019; Liobikiene and Butkus, 2017; Liu, Zhang & Bae, 2017; Nassani, Aldakhil, Abro, & Zaman, 2017; Sarkodiea & Ozturk, 2020; Shafiei & Salim, 2014; Shujah-ur-Rahman et al., 2019; Sugiawan & Managi, 2016; Zoundi, 2017).
Building on this work, the present study includes trade openness (TO) and the consumption of renewable energy (RE) as additional variables. In the case of trade openness, it is important to mention how trade relationships have affected pollution after the implementation of NAFTA in 1994, since the affected countries are now strongly interrelated as trading partners.
Methodology and data
According to previous studies (for example, Apergis & Payne, 2009; Hamit-Haggar, 2012), the long-run relationships among CO2 per capita, RE, GDP per capita, GDP per capita squared, and TO, can be tested with the following model:1
where i indicates the cross section (the three countries), t is the time range of the data period, and eit represents the error term. The parameters β1, β2, β3, and β4 represent the long-run elasticity from energy consumption, GDP, GDP squared, and TO with respect to CO2 emissions, respectively.
It is expected that β1 < 0 because an increase in the use of renewable energy can generate a decrease in emissions. To test the EKC hypothesis (β2 > 0, β3 < 0), an increase in the level of income implies an increase in emissions during the early stages of development and thus the U-inverted form is expected. For its part, β4 > 0; its value can be positive because energy plays an important role in trade flows.
In the analysis of time-series variables, it is important to know the order of integration and verify if there is co-integration between the variables to avoid obtaining spurious results. The econometric literature suggests that unit root tests in panel data have greater power than time-series unit root tests. By combining time-series data and cross-sectional data, a greater number of observations can be achieved, as well as more degrees of freedom, more variability, less collinearity, and greater efficiency (Baltagi, 1995). The most commonly used unit root tests with panel data are the LLC test (Levin, Lin, & Chu, 2002); the IPS test (Im, Pesaran & Shin, 2003); Fisher-type tests using ADF, or ADF-Fisher; and the PP test, or PP-Fisher (Choi, 2001; Maddala & Wu, 1999).
The LLC test assumes a common unit root process, while the other three tests allow an individual root unit process. The following ADF model is considered in the LLC root test:2
In this test, it is assumed that the parameter ρi is identical for the cross sections, ρi =ρ for all i, while the lags pi can vary freely. Testing for unit root, the null hypothesis must be specified as follows: H0: βi = β = 0 for all i, against the alternative hypothesis Hi: βi = β < 0 for all i of no unit root. For the IPS test, the same model (3) is considered but it differs from the LCC test because it assumes that ρi varies between the cross sections. In this way, the null hypothesis can be written as H0: βi = 0 for all i, against the alternative H1: βi < 0, i = 1, ..., N1; βi = 0, i = N1, ..., N for all i. The acceptance of the alternative hypothesis allows some series to be integrated.
The most common Ordinary Minimum Screening (OLS) technique for estimating the coefficients of panel-data models turns out to be biased and produces inconsistent estimates when the variables are co-integrated. Recently, new methods have been developed to estimate co-integration relationships using panel data, such as the Fully Modified OLS (FMOLS) and Dynamic OLS (DOLS) estimators (Kao & Chiang, 2001; Pedroni, 2001; Phillips & Moon, 1999).
These approximations produce estimators of coefficients that are asymptotically unbiased and normally distributed (Kao & Chiang, 2001; Pedroni, 2001). Pedroni (2001) argues that the FMOLS estimator behaves relatively well, and that even in small samples it generates consistent estimates and allows the endogeneity of its regressors and the serial correlation to be controlled. Due to these considerations, the present study uses both FMOLS and DOLS estimators for co-integrated heterogeneous panels. Additionally, two additional estimation methods were applied to test the robustness of the results (Generalized Method of Moment [GMM]; Robust Least Squares [RLS]).
The co-integration analysis tests the existence or not of a long-term relationship between the variables. Granger (1988) points out that if the variables are co-integrated, there must be a causal relationship in at least one direction. One of the important issues in the econometrics of panel data is the heterogeneity of cross-sectional units. To deal with this issue, a new proposal is considered that involves a standardized panel statistic with good results even in small samples.
This proposal was recently developed by Dumitrescu and Hurlin (2012) to test causality in heterogeneous panel-data models. They noted that in such contexts, there are two dimensions to be considered: the heterogeneity of the causal relationship, and the heterogeneity of the regression model used. Therefore, the null hypothesis of homogeneous non-causality (that is, there is no causal relationship between the panel units) is presented against the alternative that there are two subgroups: one characterized by a causal relationship between two variables, and the other characterized by no causal relationship between these two variables. The rejection of the null hypothesis does not entail knowing the number or identities of the particular units of the panel for which that hypothesis has been rejected (Dumitrescu & Hurlin, 2012).
This study uses annual data from the NAFTA countries for the period 1971-2014. The variables included are GDP per capita (in constant dollars of 2010), CO2 per capita (in metric tons), and trade openness (defined as exports plus imports as % of GDP). Data for these variables were taken from the World Bank (2020). The data for Re (measured in thousand toe, tonne of oil equivalent) were taken from the Renewable Energy Indicators of the Organization for Economic Cooperation and Development (OECD, 2018). All variables are expressed in natural logarithms.
Analysis of results
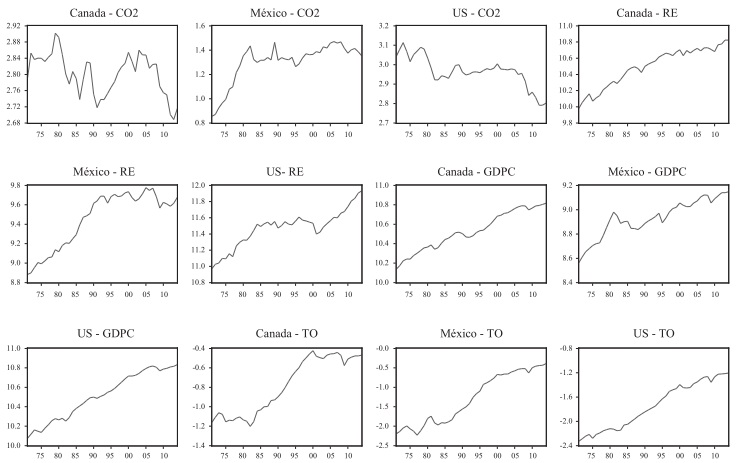
Figure 2 shows data for the variables used in the analysis. In the case of CO2, Mexico and Canada both show a growing trend with large jumps in some years. Overall, though, the three countries exhibit a decreasing trend in this variable since 2005. In relation to RE, Canada shows a growing trend during this period, while the United States and Mexico level off during the years 1985 to 2000 and 1990 to 2010, respectively. But both countries trend upward, with respect to RE, after those periods. In relation to the GDP variable, all three countries show a growing trend during the years of the analysis, with Mexico being subject to some peaks and valleys at different points in this period. Finally, the TO variable shows a growing trend in the three countries for much of the period, though with a slowing-down trend in the case of Canada after 2000.
The growth of trade promotes economic interdependence through imports, exports, and foreign investment. For this reason, because this article analyzes the NAFTA countries, it is very important to first apply a cross-sectional dependence test in the series before applying standard panel unit root tests (Ahmed, 2017; De Hoyos & Sarafidis, 2006; Pesaran, 2007).
Table 1 shows the results of the test for cross-sectional dependency. For all variables other than the CO2 variable, the null hypothesis of cross-sectional dependence is rejected at 1% significance; for the CO2 variable, the null hypothesis cannot be rejected. Therefore, for most of the variables, there is cross-sectional dependence, and the variables of each country are correlated with each other.
Table 1 Results of Pesaran (2004) test for cross-sectional dependence
| Variable | CO2 | GDP | GDP Squared | RE | TO |
|---|---|---|---|---|---|
| CD statistic | -0.221 | 10.899*** | 10.901*** | 10.248*** | 11.272*** |
| P value | 0.824 | 0.000 | 0.000 | 0.000 | 0.000 |
Note: *** denotes the rejection of the null hypothesis at the 1% level.
In order to know the order of integration of the variables and the possible presence of co-integration, the unit root tests are applied first. Table 2 shows the results of the LLC, IPS, ADF-Fisher, and PP-Fisher tests. These tests show that the existence of the unit root cannot be rejected for all the variables in levels; but they are stationary in first differences at a level of significance of 1%, from which it can be concluded that they are integrated in order 1. However, it is very important to apply unitary root tests that generate consistent results in the absence of cross-sectional independence and heterogeneity across countries in the panel (Riti et al., 2017).
Table 2 Results of unit root tests with panel data
| Variable | Deterministic Parameters | LLC Test | IPS Test | ADF-Fisher Test | PP-Fisher Test |
|---|---|---|---|---|---|
| CO2 | CT | 0.165 | 0.235 | 4.377 | 2.919 |
| GDP | CT | -0.167 | -0.714 | 7.581 | 5.421 |
| GDP squared | CT | -0.073 | -0.741 | 7.559 | 5.284 |
| RE | CT | 0.029 | 1.349 | 2.924 | 2.875 |
| TO | CT | 1.137 | 1.416 | 1.557 | 2.019 |
| First difference | |||||
| ∆CO2 | C | -9.862*** | -8.729*** | 68.431*** | 67.701*** |
| ∆GDP | C | -8.491*** | -6.564*** | 48.763*** | 46.620*** |
| ∆GDP squared | C | -8.518*** | -6.571*** | 49.513*** | 46.560*** |
| ∆RE | C | -8.668*** | -9.709*** | 77.294*** | 79.952*** |
| ∆TO | C | -9.574*** | -7.775*** | 59.836*** | 58.960*** |
Note: *** denotes the rejection of the null hypothesis at the 1% level. C denotes constant and CT denotes constant and trend.
Table 3 shows the unit root results of these new tests. The tests confirm that the variables are integrated in order one; all variables have unit roots in levels but are stationary in first differences. To test the presence of an equilibrium or long-run relationship among the integrated variables of the same order, two co-integration tests with panel data are used in this investigation: the Pedroni (2001) and Kao (1999) tests.
Table 3 Results of Cross-sectional Augmented Dickey Fuller (CADF) and Cross-sectional Im, Pesaran, and Shin (CIPS) panel unit root test (Pesaran, 2007)
| Variable | Deterministic Parameters | CADF | CIPS |
|---|---|---|---|
| CO2 | CT | -1.103 | -2.469 |
| GDP | CT | -0.325 | -1.601 |
| GDP squared | CT | -0.283 | -1.480 |
| RE | CT | 1.569 | -1.561 |
| TO | CT | -1.545 | -2.045 |
| First difference | |||
| ∆CO2 | C | -6.214*** | -5.405*** |
| ∆GDP | C | -2.750*** | -3.913*** |
| ∆GDP squared | C | -2.650*** | -3.894*** |
| ∆RE | C | -4.567*** | -6.190*** |
| ∆TO | C | -5.525*** | -4.805*** |
Note: *** denotes the rejection of the null hypothesis at the 1% level. C denotes constant and CT denotes constant and trend.
The Pedroni cointegration test includes seven statistics; the results of the test are presented in Table 4. The null hypothesis of non-cointegration is rejected by the Panel v, Panel PP, ADF Panel, Group PP, and ADF Group statistics; that is, the test shows that there is in fact a long-run relationship among the variables.
Table 4 Results of Pedroni co-integration test
| Test | Statistic |
|---|---|
| Panel v | 2.908** |
| Panel rho | -1.049 |
| Panel PP | -2.244** |
| Panel ADF | -1.591* |
| Grupo rho | -0.226 |
| Grupo PP | -2.371*** |
| Grupo ADF | -1.750** |
Note: ***, **, and * denote the rejection of the null hypothesis at the 1%, 5%, and 10% levels, respectively.
With the Kao test in Table 5, the null hypothesis of non-cointegration is rejected at 5% significance; this result confirms that there is a long-run or equilibrium relationship among the variables. The most common OLS technique for estimating the coefficients of panel-data models turns out to be biased and produces inconsistent estimates when the variables are co-integrated. In the present study, the FMOLS, DOLS, GMM and RSL estimators are used.
Table 5 Results of Kao co-integration test
| Test | Statistic |
|---|---|
| ADF | -1.952** |
| P-value | (0.025) |
Note: ** denotes the rejection of the null hypothesis at the 5% level.
According to Table 6, with the FMOLS, DOLS, GMM and RSL estimators, all the variables are statistically significant at 1% except the TO in the case of the DOLS. The long-run elasticity of GDP is positive; this result implies that as economic activity increases, carbon dioxide emissions increase.
Table 6 Results of estimation of long-run parameters
| Variable | DOLS Coefficients | FMOLS Coefficients | GMM Coefficients | RSL Coefficients |
|---|---|---|---|---|
| GDP | 6.999*** | 8.689*** | 11.249*** | 11.278*** |
| GDP squared | -0.329*** | -0.418*** | -0.525*** | -0.526*** |
| RE | -0.267*** | -0.105*** | -0.032*** | -0.032*** |
| TO | -0.002 | -0.065*** | -0.218*** | -0.215*** |
Note: *** denotes the rejection of the null hypothesis at the 1% level.
In addition, the EKC hypothesis is supported by the results for the NAFTA countries since the coefficient of the GDP is positive and GDP squared is negative, and both are statistically significant. These results indicate that economic development causes an environmental improvement after reaching the required inflection point for the level of per capita income in these countries. At the same time, the coefficients of TO and RE are negative with all estimators, meaning that trade openness and renewable energy contribute to reduce polluting emissions. Trade openness can help to import or export machinery and products friendlier to the environment. Therefore, these countries should encourage policies that promote free trade and the production and consumption of renewable energy that does not harm the environment.
It is evident that trade openness has helped these NAFTA countries to benefit from trade and reduce polluting emissions, although currently the three countries are renegotiating NAFTA because it is argued, mainly by the United States, that it has been an unfair treaty for them due to the U.S. trade deficit with Mexico. The mercantilist vision of Donald Trump rests on a zero-sum game, whereby what one country earns, the other loses. Hence, according to Trump, the trade deficits were not good and had to be eradicated in a line of argument that goes back to the mercantilists of the 16th century (Esquivel, 2017).
The new United States-Mexico-Canada Agreement (USMCA), which is in the process of being approved by the three countries, represents a new chapter in relation to the environment (Chapter 24). In general terms, in the new agreement, the three countries agree to combat oceanic garbage that affects marine ecosystems, ban commercial whaling, and stop illegal species trafficking, among other environmentally deleterious activities (USMCA, 2019). However, in terms of energy use, the new agreement continues to promote fossil-fuel dependence, not the transition to renewable energy. This feature of the agreement ignores the problem of climate change and foregrounds only economic interests. There are a series of actions carried out by the United States that show the evidence of this, such as the exit of this country of PARIS CLIMATE AGREEMENT in 2017. According to the IEA (2019), after three years of partial stabilization of CO2 from fuel combustion, those emissions began to increase again in 2017 and 2018, coupled with a stagnation in the growth of renewable energies.
Once the existence of a long-term relationship among the variables has been confirmed, there must be a causal relationship in at least one direction (Granger, 1988).
According to Table 7, in the long term, there is indeed a causal relationship running from the RE, TO, and economic activity variables toward polluting emissions. This causal relationship is established at a level of significance of 1%, which implies that these variables have an important weight and help to better predict the behavior of this last variable. There is also a causal relationship running from RE, TO, and environmental pollution toward economic activity; this relationship is established at a level of significance of 10%. In the short term, meanwhile, there are bidirectional causal relationships between polluting emissions and economic activity, and between TO and economic activity; these relationships are established at a level of significance of 10% or better. Finally, there is a unidirectional causal relationship running from GDP toward RE; this relationship is established at a level of significance of 1%.
Table 7 Results of Granger causality test results
| Dependent variables | ∆CO2 | ∆GDP | Short run ∆GDP squared |
∆TO | ∆RE | Long run ECT-1 |
|---|---|---|---|---|---|---|
| ∆CO2 | - | 15.292*** | 0.056 | 0.982 | 0.029 | -0.176*** |
| ∆GDP | 5.657*** | - | 0.678 | 2.448* | 0.342 | -0.055* |
| ∆GDP squared | 2.889* | -0.146 | - | 2.939* | 0.182 | -0.830 |
| ∆to | 4.377** | 5.384*** | 5.827*** | - | 1.021 | -0.055 |
| ∆Re | 0.201 | 5.453*** | 1.074 | 0.727 | - | -0.058 |
Note: ***, ** and * denote statistical significance at the 1, 5 and 10% level, respectively.
It should be underscored that these results were generated from an analysis where the existence of heterogeneity between the units of the analysis is not considered. However, one of the key issues in the econometrics of panel data is the heterogeneity of cross-sectional units. To deal with such issues, a recent proposal developed by Dumitrescu and Hurlin (2012) to test causality in heterogeneous panel data models can be factored into the analysis. To this end, the null hypothesis of homogeneous non-causality (that is, there is no causal relationship among the panel units) is presented against the alternative that there are two subgroups: one characterized by a causal relationship between two variables, and the other characterized by no causal relationship between these two variables.
According to Table 8, there is a causal relationship running from economic activity toward carbon dioxide emissions; as expected, higher production generates higher energy consumption and greater environmental pollution. There is a bidirectional causal relationship between TO and polluting emissions; both variables are complementary, and each one provides important information that can help predict the behavior of the other. There is a unidirectional causal relationship running from economic activity to TO. This relationship implies that the production of the NAFTA countries influences trade, and reflects the fact that a large part of the production of these countries is for trade with each another. There is also a unidirectional causal relationship running from TO to the consumption of RE; that is, more trade is expected to generate greater economic activity and energy consumption, which in turn leads to greater emphasis on RE.
According to Esquivel (2014), if the benefits of NAFTA are analyzed in terms of the agreement’s immediate objectives (trade and investment), the results are relatively favorable, albeit with a clear loss of dynamism in recent years. However, if NAFTA is evaluated in terms of its final objectives, the results do not seem to be favorable. When overall economic growth is considered, the agreement’s performance was very poor: the gaps between business partners and net migration figures were not closed; nor were there improved salary levels or decreased poverty levels. Arguably, however, the lack of good economic results cannot be exclusively attributed to NAFTA. The absence of such favorable results may be due to other economic policy decisions or to the lack of other specific actions that could have helped to enhance the advantages brought about by NAFTA (Esquivel, 2014).
Table 8 Results of the heterogeneous causality test
| Null hypothesis | Wald test | Decision |
|---|---|---|
| GDP does not homogeneously cause CO2 | 5.598*** | Reject |
| CO2 does not homogeneously cause GDP | 1.214 | Accept |
| GDP squared does not homogeneously cause CO2 | 5.440*** | Reject |
| CO2 does not homogeneously cause GDP squared | 1.132 | Accept |
| TO does not homogeneously cause CO2 | 4.182** | Reject |
| CO2 does not homogeneously cause TO | 3.089** | Reject |
| RE does not homogeneously cause CO2 | 1.440 | Accept |
| CO2 does not homogeneously cause RE | 1.303 | Accept |
| GDP squared does not homogeneously cause GDP | 1.464 | Accept |
| GDP does not homogeneously cause GDP squared | 1.409 | Accept |
| TO does not homogeneously cause GDP | 1.809 | Accept |
| GDP does not homogeneously cause TO | 6.547*** | Reject |
| ER does not homogeneously cause GDP | 1.006 | Accept |
| GDP does not homogeneously cause RE | 0.869 | Accept |
| TO does not homogeneously cause GDP squared | 1.869 | Accept |
| GDP squared does not homogeneously cause TO | 6.352*** | Reject |
| RE does not homogeneously cause GDP squared | 1.013 | Accept |
| GDP squared does not homogeneously cause RE | 0.921 | Accept |
| RE does not homogeneously cause TO | 0.451 | Accept |
| TO does not homogeneously cause RE | 3.419** | Reject |
Note: *** and ** denote the rejection of the null hypothesis at the 1% and 5% levels, respectively.
It is, however, very difficult to distinguish the effects of NAFTA from other factors (Ramírez, 2003). Relevant factors include, for example, the accumulated appreciation of the peso (which caused lower-than-expected growth of exports and greater-than-expected growth of imports); the social discontent that was reflected in the armed movement of the Zapatistas initiated on January 1, 1994 (allegedly in response to Mexico’s entry into NAFTA); and the political uncertainty generated by the assassination of the PRI candidate (Luis Donaldo Colosio) on March 23, 1994, as well as the Secretary General of the PRI (Mario Ruiz Massieu) in September of the same year. These events resulted in a currency crisis in 1994-95, as capital inflows were not sustained in the long term. Other important factors include the deceleration of demand from the United States be- ginning in 2001 and the upheaval of the world economy in 2007-2008.
Conclusions and policy implications
The relationship between economic growth and environmental degradation has been one of the most important hypotheses analyzed empirically in the recent literature in ecological economics. The growth in population worldwide increases the demand for goods and services, and thereby increases the demand for energy consumption. Despite greater attention to the issue of pollution and corresponding efforts to reduce its negative effects, however, fossil fuels continue to dominate global energy consumption.
As a case study revealing many of the key issues involved in ecological economy and econometrics, this article analyzes the EKC hypothesis for the NAFTA countries during the period 1971-2014. The study assumes that these countries are strongly interrelated and integrated, as shown in their trade relations, and that they have benefited from the trade that began to be stimulated by this treaty in 1994. Because of this strong interrelationship, unit root tests, cointegration, and causality tests with panel data were used. The results show that the series are integrated of order one and that there are long-run relationships among the variables under study. For these countries, the EKC hypothesis is confirmed, meaning that economic development causes an environmental improvement after reaching the inflection point of per capita income in these countries.
The RE and TO variables have a negative impact on pollution; this impact implies that greater TO and increased use of RE will contribute to reduce polluting emissions. Unfortunately, this causal relationship, confirmed by the present paper, is not reflected in the new trade agreement between the three North American countries. Instead, in the Environment Chapter of the new agreement, fossil fuels continue to be promoted, not a transition to renewable energy.
The analysis also reveals a unidirectional causal relationship running from economic activity to CO2 emissions, as expected, because currently, despite efforts to use renewable energy sources, the use of energy from fossil fuels still predominates strongly in the production of goods and services. The study establishes, too, a causal relationship between economic activity and TO, given that much of the production of goods and services from these countries is destined for international trade. At the same time, when it comes to TO and polluting emissions, there is a bidirectional causal relationship. This result confirms the importance of comprehensively planning out the trade and environmental policies of the NAFTA countries, in a manner that allows for the production and trade of goods and services that are friendlier to the environment in the region.
In sum, the benefits of free trade can be exploited without neglecting the environmental consequences of economic activity. In extending this research, other important variables that can affect environmental degradation, such as financial development, human capital, and urban population density, will need to be considered. In addition, other pollution measures will need to be used, as well as tests for the possible presence of structural changes in the economies under investigation.

