


 nueva página del texto (beta)
 Inglés (pdf)
 Artículo en XML
 Referencias del artículo
 Enviar artículo por email
 Citado por SciELO
  Similares en
SciELO
Similares en
SciELO 
 Permalink
Introduction
During the last few decades, firms, governments and society have an increasing interest to include Corporate Social Responsibility (CSR) into the firm’s business strategy (e.g. Jenkins, 2005; Lankoski 2009; Lundgren, 2011; Orlitzky, Schmidt, & Rynes, 2003; Siegel & Vitaliano, 2007, among others). Researchers consider interest in CSR as the “latest manifestation of a long-standing debate over the relationship between business and society” (Jenkins, 2005). Recent attention by the media and academic literature has focused on the environmental impact of firms. Yet, this notion has expanded to include issues such as human rights, community strengthening, diversity, employees’ rights, among others. This paper provides empirical evidence supporting the institutional theory of CSR, which helps understand under what conditions corporate social responsibility could take place.
The definition of CSR may vary according to different authors. For instance, McWilliams and Siegel (2007) describe CSR as “actions that appear to further some social good, beyond the interest of the firm and that which is required by law.” The Business for Social Responsibility (bSr) define it as “achieving commercial success in ways that honor ethical values and respect people, communities, and the natural environment.” Anguinis (2011) refers to corporate social responsibility as “context-specific organizational actions and policies that take into account stakeholders’ expectations and the triple bottom line of economic, social, and environmental performance.”
For this article, we consider a similar definition of CSR as “actions that imply corporate beyond-compliance behavior in the social and/or environmental arena” (Lundgren, 2011). CSR implies a behavior beyond the prevailing legal or regulatory requirements. As noted, this includes not only environmental measures but also community building, human rights protection, employee relations, gender representation and diversity, among others.
For this article, we consider a similar definition of CSR as “actions that imply corporate beyond-compliance behavior in the social and/or environmental arena” (Lundgren, 2011). CSR implies a behavior beyond the prevailing legal or regulatory requirements. As noted, this includes not only environmental measures but also community building, human rights protection, employee relations, gender representation and diversity, among others.
The data we use comprises publicly traded companies listed on the main international stock exchanges, mainly focusing on uS enterprises. We focus on large companies as they have data publicly available.1
Institutional theory of CSR (Campbell, 2007; Frynas & Yamahaki, 2016; among others), states that firms need to conform to social norms in a business environment because they cannot survive without a certain level of external social approval (legitimacy). Under this theory, we analyze the following questions: What are the determinants of a firm to engage in CSR and under what conditions is it likely to occur?
First, we take the economic approach of this theory (new institutional economics). It states that firm strategies and practices will become similar within a defined institutional environment as similar firms face similar institutional pressures (Frynas & Yamahaki, 2016). Under this theory, the prevailing macroeconomic context may affect the firm’s decisions on CSR (Branca, Pina & Catalao-Lopes, 2012). We focus on the firm’s CSR behavior regarding fluctuations in the business cycle. Unfortunately, there hasn’t been enough research about the actual fluctuations in CSR investments. The empirical literature discussing the determinants of CSR both through the institutional and strategic side is small, and its lessons are mixed.
Second, we contribute with an analysis of peer effects on CSR. Within the institutional framework, if there is a system of industrial self-regulation, corporations will be more likely to act in socially responsible ways (Campbell, 2007). According to Martin (2002), an effective way to increase corporate social responsibility is through corporate peer pressure. There is a strong possibility that firms will behave in more socially responsible ways if they have peer pressure from other corporations in their industry (Liang, Liang, & Zhan, 2017). We test if this proposition takes place for big corporations in the US.
Third, we focus on Campbell’s proposition: Corporations are more likely to act in socially responsible ways if they are engaged in institutionalized dialogue with unions, employees, community groups, investors, and other stakeholders (Campbell, 2007). The focus of this analysis is to see if community attitudes towards social responsibility topics affect the way firms decide on whether to act in socially responsible ways.
We contribute to the institutional theory by narrowing the gap between available evidence and information required for making theoretical assumptions about the role of consumers and other firms on the company’s decision to engage in CSR.
We build a firm-level panel dataset using data mainly from uS and Canadian firms. The datasets we include are: COMPUSTAT and KLD containing CSR activities and firm characteristics for a period spanning 12 years (1998-2010); and complement the panel with data on industry value added using the US Department of Commerce (Bureau of Economic Analysis) data. We include data on labor force attitudes towards key areas of CSR (e.g. environment, human rights and diversity) using American National Election Surveys (ANES) to assess the linkages (or lack thereof) between workers and firms.
Our results show a strong and positive relationship between growth in value added in the firm’s industry and the decision to engage in CSR. It supports the new institutional economics theory where firms invest in CSR when facing a similar economic environment.
This relationship, while strong for most firms, does not hold for top-performing firms, who seem to engage in CSR regardless of their industry value added.
Peer effects are relevant for a firm’s decision to engage in CSR up to a point, when the agglomeration of firms engaging in CSR is no longer relevant for another firm to engage in CSR within the same industry. Our results are similar to the results found by Liang, Liang, & Zhan (2018). They found that CSR practice can influence or be influenced by peer firms or industry dynamics.
The results also complement the institutional theory of CSR where particular groups within society affect a firm‘s decision to engage in CSR. Overall, workers preferences are not driving a firm to engage in CSR, proving a weak link between the firm’s engagement in CSR and workers’ attitudes. However, there is evidence that attitudes towards diversity have enough relevance to influence the firm‘s decision to engage in diversity CSR activities.
Relation to the literature
Campbell (2007) describes the institutional theory on CSR with eight propositions. He answers the question: under what conditions do firms act in socially responsible ways? His research uses an institutional analysis and comparative political economy approach to answer that question. Our paper complements the theory with empirical research focusing on three of Campbell’s propositions.
Corporations will be less likely to act in socially responsible ways when they are experiencing relatively weak financial performance and when they are operating in a relative unhealthy economic environment where there is a limited possibility for near-term profitability.
Corporations will be more likely to act in socially responsible ways if there is a system of well-organized and effective industrial self-regulation in place to ensure such behavior, particularly if it is based on the perceived threat of state intervention or bROAder industrial crisis and if the state provides support for this form of industrial governance.
Corporations will be more likely to act in socially responsible ways if they are engaged in institutionalized dialogue with unions, employees, community groups, investors, and other stakeholders.
Does the macroeconomic context affect Corporate Social Responsibility?
There are few papers that empirically research the economic conditions on CSR adoption. Branca, Pina, and Catalao-Lopes (2012) show that firms expect to reduce CSR spending when the business cycle is unfavorable. However, their analysis only looks at the corporate giving dimension of CSR without taking into consideration other CSR activities such as environmental, human rights, diversity. Campbell (2007) argues that firms will not behave socially responsible when they are operating in an unhealthy economic environment, however he does not provide empirical evidence. Hsiang-Lin, Hsiang-Hsuan, and Tzu-Yin (2010) test Campbell’s argument by including the inflation rate, industrial production index and the consumer confidence index as the economic variables. They find that firms in countries with higher consumer confidence levels and lower inflationary levels will act in more socially responsible ways. They only estimate results for financial firms in a country level setting.
The closest research to our analysis in terms of the cyclicality of CSR is Branca, Pina, and Catalao-Lopes (2012). Although we look at related issues in a similar context, we have very different approaches. Branca, Pina, and Catalao-Lopes (2012) take a time series approach by estimating the cross-correlation pattern of CSR giving and firm revenues with real GDP. They find a significant co-movement between real GDP and CSR giving. In contrast, we use panel data to estimate the relationship between the growth in industry value added and the probability of a firm to engage in CSR activities.
Our approach has several advantages and provides new insights. We offer more precise and reliable estimates on the impact of the business cycle on CSR by using firm’s data. Branca, Pina, and Catalao-Lopes (2012) focus on giving as the only measure of CSR, using IRS data. But data limitations do not allow them to control for any other firm’s characteristics.
How do firms react to their peers’ adoption of Corporate Social Responsibility?
Even though research on CSR has been increasing, researchers know little about how CSR can influence or be influenced by peer firms or industry dynamics. To my knowledge, few studies have tried to determine the peer effects of corporate social responsibility (see Cao, Liang,& Zhan, 2015; Leary & Roberts, 2014; Liu & Wu, 2015; Servaes & Tamayo, 2014). This research presents evidence on how firms react to their peers’ adoption of CSR. They find that the effects are stronger amongst peers with higher competitive pressure and a more transparent information environment (Cao, Liang, & Zhan, 2015). Liu and Wu (2015) show that when a firm’s competitors exhibit a higher level of CSR, the firm is more likely to engage in CSR activities.
Our contribution looks at peer effects by analyzing the proportion of firms within the same industry that adopt socially responsible practices and the firm’s decision to engage in CSR for a particular firm in the same industry, using controls defined later on.
A potential problem is the probability of a firm’s CSR and the competitor’s CSR being driven by the same industry level shocks. It could lead to peer effects appearance. Similarly, if the firm and its competitors are geographically close, region-level shocks may also affect the interpretation. To deal with this issue, we include industry times year fixed effects and state times year fixed effects in the analysis (see Liu & Wu, 2015). This way, we control for any time-varying trends in the industry and region level.
Is there a link between community attitudes and Corporate Social Responsibility?
From the workers’ preferences perspective,2 the closest paper is Marquis, Glynn, and Davis (2007). They provide a framework to look at how the community and culture pressure firms to implement CSR. Marquis, Glynn, and Davis (2007) suggest that communities are important influencers on corporate action. There are two main reasons for this argument. First, the set of rules and norms in place in the community serve also as a benchmark for legitimizing CSR (see also Margolis & Walsh, 2003; Marquis, Glynn, & Davis, 2007). Second, CSR activities orient towards the community where the corporation’s executive lives (Marquis, Glynn, & Davis, 2007). However, Marquis, Glynn, and Davis (2007), and Campbell (2007) provide none empirical analysis of their framework. Several studies in the US have shown that this is the case by using small samples of firms across the country. Most of these researches are study cases, for example Galaskiewicz and Wasserman (1989) looks at local giving patterns of Minneapolis based companies and how network effects influence them.
To the best of our knowledge, there is no study that includes workers’ attitudes from ANES into the analysis of CSR and data on firms from COMPUSTAT and KLD for the period we consider (1998-2010).
Data
Data for this research comprises a panel dataset of 4 785 large publicly traded companies listed on the main international stock exchanges, with observations from 1998 to 2010. We have four main sources of data to look at corporate social responsibility; it’s relationship with the macroeconomic environment and to labor force preferences: KLD ranges from 1998 to 2010 (12 years); COMPUSTAT, which covers the same years; industry value added from the US Department of Commerce (Bureau of Economic Analysis) with observations from 1998 to 2010; ANES includes data on workers opinions towards key areas of CSR (e.g. environment, human rights and diversity) for the period from 1998 to 2009.
Our data set consists of a sample of 3 068 large publicly traded companies listed on the main international stock exchanges, with 98% of the sample registered as US firms. The sample covers nine industries defined according to the Morgan Stanley Capital International’s (MSCI) Global Industry Classification Standards (GICS): Oil and gas (7%), materials (8%), industrials (19%), consumer discretionary (22%), consumer staples (7%), healthcare (12%), information technology (17%), communication services (2%), utilities (5%).3
KLD (Kinder, Lydenberg, Dominwe research and analytics)
An annual dataset on environmental, social, and governance ratings, published at the end of each calendar year. It identifies the company information (Name, Ticker, unique security identifiers), and provides 50 CSR indicators organized in seven categories: The environment, community, human rights, employees, diversity, production and corporate governance. Table 1 describes the seven areas covered by KLD and their components.4 The number of firms in the sample has a substantial increase in 2003, and from that year onward KLD added CSR ratings for all firms belonging to the Russell1000Index.5
Table 1 Corporate Social Responsibility indicators and components
| Indicator | Components | Indicator | Components | |
|---|---|---|---|---|
| Environmental | Beneficial Products and Services | Diversity | Representation (women and minorities) | |
| Pollution Prevention | Board of Directors (women and minorities) | |||
| Recycling | Work/Life Benefits | |||
| Clean Energy | Women and Minority Contracting | |||
| Management Systems | Gay and Lesbian Policies | |||
| Other | Employment of Under represented Groups | |||
| Community | Charitable Giving | Other | ||
| Innovative Giving | Product | Quality | ||
| Community Engagement | Benefits to Economically | |||
| Other | Disadvantaged | |||
| Human Rights | Indigenous Peoples Relations | Access to Capital | ||
| Strength | Product Safety | |||
| Human Rights Policies and initiative | Marketing/Contracting | |||
| Employee Relations | Union Relations | Concern | ||
| Cash Profit Sharing | Antitrust | |||
| Employee Involvement | Customer Relations Concern | |||
| Health and Safety | ||||
| Supply Chain Policies, Programs and Initiative | Governance | Reporting Quality | ||
| Other | Public Policy |
Source: www.msci.com
Compustat
It is an annual database of financial, statistical, and market information on publicly traded companies. Characteristics include indicators such as total assets, earnings, industry classification, sales, number of employees, among others. Such characteristics would most likely account for time varying conditions faced by the firm.
Industry value added
Data from the Bureau of Economic Analysis, which includes the value added by industry sector. Data is available from 1998 to 2010.
Labor force opinion
Data from American National Election Studies survey; a bi-annual survey on the state of the individual’s attitudes towards an array of issues. In particular, we use information about workers’ attitudes (on a 0 to 100 scale, 100 being positive) towards diversity, unions and environmentalists. ANES codes data by state and we match it to the state location of the firm. Although this might not directly capture the workers’ opinions each individual firm faces, it would provide a proxy for the attitudes prevailing in the American electorate.
Methodology
We run a set of fixed effects regressions to estimate the relation between CSR adoption and the business cycle, peer effects and CSR, and the relation between CSR and labor force opinions. All results presented account for heteroscedasticity and serial correlation.
We assume a linear probability model (LMP), where changes in the explanatory variables have a linear effect on the change in the probability of adopting CSR and we make no arbitrary choice of a nonlinear regression function (Wooldridge, 2002). It is difficult to estimate using alternatives like fixed effects Probit using standard methodologies.6 Hence, we estimate equation 1 with a linear probability model in which: CSRijt is an indicator variable that equals one when firm i from industry j engages in any CSR activity at time t, and zero otherwise; Growthjt-1 is the growth in value added observed for industry j at time t-1; Xijt is a set of firm characteristics (see below); t is a linear trend capturing the overall growing importance of CSR over time; and uijt is an i.i.d idiosyncratic error term.
While T is not sufficiently large in our sample, we allow uijt to follow an AR(1) process: uijt =ρuijt-1+ϵijt.7 The magnitude of the estimated coefficient of interest (β) does not change dramatically and remains statistically significant.
Peer effects
To analyze how the proportion of firms within the same industry affect the decision to engage in CSR for a particular firm in the same industry, we estimate equation 2, where αi and Xijt are defined as before. We further include year fixed effects (γ), and interest lies in θ and Θ.
Labor force opinions
We exploit state-level variation in workers attitudes (towards specific issues) to assess if these attitudes influence the likelihood of firms to engage in (overall and thematic) CSR. We estimate equation 3 using a fixed effects LMP.
Controls
Besides economic activity (measured here with the growth of value added), there are other factors that can influence CSR activities. We include these factors in the regression to control for their potential influence on CSR decisions. We consider several control variables (Xijt) related to the firm’s characteristics. The specialized literature on CSR always include these variables. They include firm size; return on assets interacted by the number of employees, as another measure of the firm’s size, advertising intensity, R&D expenses, and the Hirschman-Herfindahl Index (HHI).
According to Belu and Manescu (2013) firm size is relevant for economic performance. Bigger firms will have higher variation on profitability. Market structure is important for CSR since it affects CSR adoption decision (Bagnoli & Watts, 2003). Results can vary significantly depending on the market structure. If markets are competitive, monopolistic or oligopolistic market power enables some firms to always to earn unusual returns.
Return on Assets (ROA) is a profitability measure that expresses the amount of net income, plus interest payments, but before preferred dividend per unit of average current and last year’s assets (Belu & Manescu, 2013). We measure firm size as the number of employees of the firm in logs; advertising intensity is the log advertising expenses; R&D intensity is the log of R&D expenses. We define the Hirschman-Herfindahl Index for each industry at the six-digit NAICS code level. Computed by adding the square of the market share of all players operating in an industry in a year.8 As displayed in Table 2, the control variables have values similar to the existing literature.
Table 2 Summary statistics
| Variable | Mean | Std. Dev. | N |
|---|---|---|---|
| ROA (Return on Assets in logs) | 0.771 | 0.18 | 15,865 |
| Emp (Number of employees in thousands) | 16.355 | 56.96 | 23,063 |
| ROA * Emp | 17.219 | 57.916 | 15,743 |
| HHI (Herfindahl Index) | 0.187 | 0.177 | 23,368 |
| R&D (log of R&D expenditures) | 0.072 | 0.527 | 23,368 |
| Advert (log of Advertisement expenditures) | 4.113 | 7.275 | 23,368 |
| Growthjt-1 (Growth in Value added) | 0.03 | 0.111 | 19,809 |
| Diversity (CSR diversity index) | 0.5 | 0.07 | 14,442 |
| Unions (Union relations index) | 0.564 | 0.055 | 14,442 |
| Environment (CSR environment index) | 0.65 | 0.046 | 13,601 |
| pfirms (# firms CSR/#firms industry) | 0.560 | 0.172 | 23,368 |
Source: Own elaboration.
Summary statistics
We start with 4,785 firms, resulting in an unbalanced panel with an average length of 5.5 years. An important feature of the empirical strategy is firm fixed effects inclusion. To have enough within-firm variation, we refine the sample to firms with at least 4 years of data. This results in a final sample of 3 068 firms with an average length of 6 years. Table 2 includes summary statistics for the sample.
Results
Corporate Social Responsibility and growth by industry
We assess the relationship between growth of value added and the probability of a firm engaging in CSR. Estimation results are in Table 3. Column 1 reports the results of a linear probability model with fixed effects and in the next columns we account for the possibility of mis-specification because of autocorrelation in data.
Table 3 Corporate Social Responsibility and growth of value added by industry
| Corporate Social Responsibility | |||||
|---|---|---|---|---|---|
| (1) | (2) | (3) | (4) | (5) | |
| OLS | Logit | AR(1) | AR(ρ) | ||
| Growthjt-1 | 0.16*** | 1.53*** | 0.075*** | 0.10*** | 0.16*** |
| (0.057) | (0.31) | (0.029) | (0.029) | (0.035) | |
| Control Variables | Yes | Yes | Yes | Yes | Yes |
| Firm fixed effects | Yes | Yes | Yes | Yes | Yes |
| Observations | 13,491 | 6,591 | 11,248 | 13,139 | 13,491 |
| Number of id | 2,243 | 1,003 | 2,144 | 2,123 | |
| Number of groups | 2,243 | ||||
Notes: Robust standard errors clustered at the industry level are in parentheses. The control variables are Number of employees (in logs), ROA*Employees, HHI Index, ln R&D expenditures, ln Advertisement expenditures, and time trend (year). All regressions control for firm fixed effects. *** is significant at the 1% level; ** is significant at the 5% level; * is significant at the 10% level.
Source: Own elaboration.
We find that the coefficient on the growth of value added, Growthjt-1, is positive and statistically significant even after accounting for autocorrelation. Column 2 reports the estimates of equation 1 with autocorrelation of order AR1. The coefficient on the growth of value added Growthjt-1 is positive and statistically significant. Also, given that the confidence intervals of the coefficients on Growthjt-1 overlap, we keep the most parsimonious model with no autocorrelation for the rest of the paper. For a further check of results in Table 3, we include the dependent variable difference by looking at the firm’s transitions to engage in CSR or stop doing CSR activities;9 the results hold with positive and significant coefficients as seen in the Appendix Table A1.
Gazelles vs. Elephants
Even though the overall results reflect that the economic environment at the industrial level (i.e. Growthjt-1) is important on a firm’s decision to engage in CSR, we estimate the heterogeneous treatment by the firm’s economic performance.10
In Table 4, industry’s Growthjt-1 is insignificant for top performers “Gazelles” (top 25 percent) related to CSR. For “Elephants” (bottom 75 percent), even when controlling for the firm’s characteristics and a time trend, an increase in Growthjt-1 leads to an increase in the probability to engage in CSR. The result coincides with the proposition that most corporations will be more likely to engage in CSR when they are experiencing a healthy environment (Campbell, 2007). However, for top performers, there could be other more significant factors that determine whether a firm engages in socially responsible activities.
Table 4 Heterogeneous effects: Gazelles vs. Elephants
| Corporate Social Responsibility | ||
|---|---|---|
| (1) | (2) | |
| Elephants | Gazelles | |
| Growthjt-1 | 0.23*** | -0.018 |
| (0.063) | (0.071) | |
| Control variables | Yes | Yes |
| Firm fixed effects | Yes | Yes |
| Observations | 10,025 | 3,466 |
| R-squared | 0.016 | 0.020 |
| Number of id | 2,032 | 791 |
Notes: Robust standard errors clustered at the industry level are in parentheses. The control variables are Number of employees (in logs), ROA*Employees, HHI Index, ln R&D expenditures, ln Advertisement expenditures, and time trend (year). All regressions control for firm fixed effects. *** is significant at the 1% level; ** is significant at the 5% level; * is significant at the 10% level.
Source: Own elaboration.
Decision to transition to CSR (D-CSR)
Table 5 shows marginal effects of a multinomial logit. The probability to engage in CSR when there is a ten-percentage increase in Growthjt-1, increases the probability of adopting CSR by 1.7 percentage points (equivalent to 25 percent), regarding not adopting. Similarly, a ten-percentage increase in Growthjt-1 decreases the probability of disengaging in CSR by 4 percentage points (equivalent to 62 percent).
Table 5 Marginal effects: Multinomial logit
| Corporate Social Responsibility | ||
|---|---|---|
| (1) | (2) | |
| Engage | Disengage | |
| Growthjt-1 | 0.17** | -0.40*** |
| (0.072) | (0.066) | |
| Control variables | Yes | Yes |
| Firm fixed effects | Yes | Yes |
| Observations | 3,605 | 3,605 |
Notes: Robust standard errors clustered at the industry level are in parentheses for the last two columns. The control variables are Number of employees (in logs), ROA*Employees, HHI Index, ln R&D expenditures, ln Advertisement expenditures, and year. All regressions control for firm fixed effects. *** is significant at the 1% level; ** is significant at the 5% level; * is significant at the 10% level.
Source: Own elaboration.
Our results confirm the theory that firms will be more likely to engage in socially responsible activities when there is a healthy economic environment for each industry.
Peer effects and the decision to engage in Corporate Social Responsibility
Following Cao, Liang, and Zhan (2015) results, and complementing Campbell’s proposition, we find that an increase in the proportion of firms engaging in CSR within an industry increases the probability of a firm that was not engaged before in CSR to do it (see Table 6). This is true up to a point after which the proportion of firms is less relevant in the decision.
Table 6 Peer effects and Corporate Social Responsibility
| (1) | (2) | (3) | |
|---|---|---|---|
| CSR | D-CSR | Intensity | |
| pfirms (# firms CSR/|# firms Industry) | 1.40*** | 1.35*** | 1.37*** |
| (0.10) | (0.12) | (0.31) | |
| pfirms2 | -0.62*** | -0.81*** | -0.53* |
| (0.085) | (0.11) | (0.29) | |
| Control Variables | Yes | Yes | Yes |
| Firm fixed effects | Yes | Yes | Yes |
| Time fixed effects | Yes | Yes | Yes |
| Geography*year fixed effects | Yes | Yes | Yes |
| Industry*year fixed effects | Yes | Yes | Yes |
| Observations | 13,491 | 13,540 | 15,743 |
| R-squared | 0.084 | 0.036 | 0.119 |
| Number of id | 2,243 | 2,250 | 2,281 |
Notes: Robust standard errors clustered at the industry level are in parentheses. The control variables are Number of employees (in logs), ROA*Employees, HHI Index, ln R&D expenditures, ln Advertisement expenditures, and year. All regressions control for firm fixed effects, time fixed effects, geography* year, and industry* year fixed effects. *** is significant at the 1% level; ** is significant at the 5% level; * is significant at the 10% level.
Source: Own elaboration.
The analysis suggests that when 79 percent of the industry engages in CSR, the probability of another firm engaging in CSR given their peers also doing it decreases (see Figure 1).
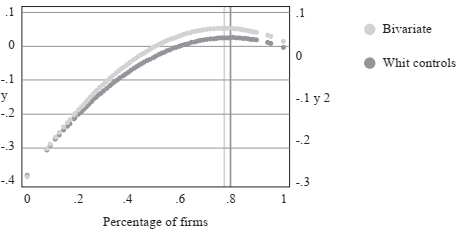
Note: The breaking point for the bivariate regression is 0.769; controlling for firm’s characteristics, the breaking point increases to 0.792.
Source: Own elaboration.
Figure 1 Proportion of firms that engage in Corporate Social Responsibility
Overall, the results coincide with those of Cao, Liang, and Zhan (2015) and Liu and Wu (2015) that CSR activities of its competitors partly shape a firm’s CSR policy. The result is consistent with the theory that firms consider CSR as strategic (Siegel and Vitaliano 2007; Fernandez-Kranz and Santalo 2010; Belu and Manescu 2013), and with Campbell (2007), Martin (2002) statements, that a way of facilitating increased corporate social responsibility is through corporate peer pressure.
We provide results of peer effects in Table 6, which presents evidence for 3 different dependent variables: CSR (Column (1)), D-CSR (Column (2)), and Intensity (Column (3)). The intensity measure is the amount of CSR strengths defined by KLD within a firm.11
The coefficients of Pfirm and Pfirm2 have the expected signs and are significant, showing that their peers in their industry affect the decision to engage in CSR until a point when it becomes less relevant.12 Column (3) reports how peers in the same industry affect the intensity in which a firm engages in CSR. Contrary to CSR and D-CSR, peer effects are not concave for intensity. The higher the percentage of firms engaged in CSR the higher the CSR intensity of a firm.
So far we have shown that there is evidence that an increase in growth in value added by industry also increases the probability of a firm to engage in Corporate Social Responsibility. This effect seems to be stronger for firms that are not the best performers of their industry. Peers within an industry have an influence in a firm’s decision to engage in CSR up to a point. In the following section we also include the analysis of workers attitudes and its effect on the firm’s decision to do CSR.
Labor force preferences and Corporate Social Responsibility
As explained above, several studies argue that communities’ choices put pressure on firms to engage in corporate social responsibility. Following McWilliams and Siegel (2001), their demand theory suggests that consumer’s value CSR attributes, and companies incorporate CSR into their marketing strategies because “they wish to exploit the appeal of CSR to consumers”. Pomering and Dolnicar (2009) conducted research to investigate if consumers know of CSR activities when facing real consumption decisions. They found that worker’s awareness levels of CSR activities are low in Australian banking sector. We wish to analyze if there is a link between the worker’s preferences and the firm’s corporate social responsibility.
Our results (see Table 7) show a weak link between CSR and workers. Overall, worker’s attitudes towards specific topics relevant to CSR activities do not have an effect in a firm’s decision to engage in these activities.
Table 7 Diversity attitudes have a positive effect on a firm’s engagement in diversity activities (Diversity-CSR)
| Corporate Social Responsibility | |||
|---|---|---|---|
| (1) | (2) | (3) | |
| Diversity | Unions | Environment | |
| Div (CSR diversity index) | 0.0017** | ||
| (0.00079) | |||
| Unions (CSR union relationship index) | -0.10 | ||
| (0.0015) | |||
| Environment (CSR environment index) | 0.11 | ||
| (0.0012) | |||
| Control Variables | Yes | Yes | Yes |
| Time fixed effects | Yes | Yes | Yes |
| Firm fixed effects | Yes | Yes | Yes |
| Observations | 9,724 | 9,724 | 9,039 |
| R-squared | 0.069 | 0.048 | 0.058 |
| Number of id | 2,141 | 2,141 | 2,140 |
Notes: Robust standard errors clustered at the state level are in parentheses. The control variables are Number of employees (in logs), ROA*Employees, HHI Index, ln R&D expenditures, ln Advertisement expenditures, and year. All regressions control for firm and time fixed effects. *** is significant at the 1% level; ** is significant at the 5% level; * is significant at the 10% level.
Source: Own elaboration.
Table 7 refines the sample by only selecting CSR activities relevant to community attitudes towards specific topics. Column (1) presents the results for only CSR activities related to diversity. We found a positive and significant relationship from the community attitude towards diversity and diversity as a socially responsible approach.
This suggests that firms consider views towards diversity relevant enough to engage in diversity practices as a form of corporate social responsibility.13 However, attitudes towards unions and the environment have no significant effect on CSR activities. Modeling these specifications with a Logistic regression confirms the results (see results in the Appendix Table B4). Marginal effects also point in the same direction regarding attitudes towards diversity.
Even though theory states that the community has a positive influence on firms’ engagement on corporate social responsibility, our results can only confirm a weak link between the community’s preferences and corporate social responsibility. Our findings are like the ones from Pomering and Dolnicar (2009) although we look at different industries and for the US instead of Australia.
Conclusions
This paper analyses the effect that economic activity, peer pressure and workers preferences have in CSR. The evidence suggests that firms engage in CSR practices in times of economic prosperity for each industry. We also provide further evidence that peer effects are important on a firm’s decision to take part in CSR. When the proportion of firms engaged in CSR increases, the probability of a firm that hasn’t engaged before increases. However, the proportion of firms engaged in CSR becomes less relevant after almost 80 percent.
Regarding workers preferences, we find that pressure from workers can also explain the firm’s decision to adopt CSR but only for diversity topics. We find that the labor force preferences towards diversity have a strong positive effect on adopting diversity CSR measures. However, there was not enough evidence to see an effect of any other workers preferences influencing the firm’s decision to engage in CSR activities.
These findings might have policy implications. Policymakers aiming at promoting corporate socially responsible behaviors could stimulate CSR activities in a few firms and this would lead other firms to follow. Since community behavior influences the firm’s decision on engaging with CSR, policymakers could provide initiatives to raise public awareness on corporate social responsibility. We need further research to understand the relationship between workers preferences (and CSR awareness) and the firm’s engagement in corporate social responsibility.

