


 nueva página del texto (beta)
 Inglés (pdf)
 Artículo en XML
 Referencias del artículo
 Enviar artículo por email
 Citado por SciELO
  Similares en
SciELO
Similares en
SciELO 
 Permalink
Introduction
In 1979, the President of Mexico presented a Law initiative to implement the Value-Added Tax (VAT), replacing the Federal Tax on Mercantile Incomes (FTMI). To that date, the FTMI had a 30 year old antiquity, it had been an alternative for obsolete burdens that only increased taxpayers’ fiscal obligations; during the FTMI’s validity, the general rate was 4% over the price of the goods and services, apparently the rate wasn’t high, however, the burden was repetitive, meaning when passing from a consumer to another, the good or service experienced a 4% rate again, making the consumers pay the triple or even more, depending on the echelons of the productive chain, adding to the FTMI’s inconvenience the lack of regulation for its accreditation (Presidencia de la República, 1978). In 1978, the FTMI operated with six different rates: the general rate of 4%, the 5% for popular automobiles, 7% for restaurants with alcoholic drink sales, 10% for compact cars, fragrances, photographic devices and other articles, 15% for big automobiles and 30% for luxury cars and articles (Comisiones Unidas de Hacienda, Crédito Público y Seguros, y de Estudios Legislativos, 1978).
The equivocations on the operation of taxes previous to the contemporaneous Value-Added Tax had been shared in other countries where the situation of applying burden in every step of the productive chain was also present, until reaching the final sale of the goods, causing serious damage due to the accumulative effects, as what had been happening in Mexico with the FTMI; but eventually each nation brought down the mistakes of the past when implementing their counterparts of the VAT. The first country to do so was France in 1945 (Reséndez, 2015), Spain followed (Bastante, 1982), and also Denmark, Sweden, Norway, Italy, United Kingdom, countries of Africa and almost every country in Latin America (Comisiones Unidas de Hacienda, Crédito Público y Seguros, y de Estudios Legislativos, 1978).
According to the Initiative to establish the Value-Added Tax Law, presented by the Presidency in 1978, the proposed rate was of 10% nationally, with an exception of the preferential zone considered as borderline region, in which the proposed rate was of 6%, by then, beside the 20 kilometers border line, the states of Baja California Norte and Baja California Sur3 were considered in the preferential zone as well. The VAT would tax the sale of goods, the rendering of independent services, the granting of use or enjoyment of tangible goods and its imports (Presidencia de la República, 1978). In their first version (Reséndez, 2015) exceptions of taxation were included, such as agricultural and livestock products without industrial processing, the machinery and fertilizers of agriculture, and the sale of lands and houses; the tax calculation was primarily based on the total value of activities performed by the merchants and industrialists, for which tax payment had to be made, and they could accredit the VAT that their suppliers had transferred to them (Presidencia de la República, 1978).
The inclusion of Quintana Roo in the “borderline region” was proposed in the Law initiative presented by the President of Mexico in 1979.This inclusion caused the application of the 6% rate in the state since 1980, instead of the prevailing general rate of 10% in that time (Presidencia de la República, 1979). The general rate of 10% and the preferential rate of 6% in the borderline region remained until 1982, nevertheless in 1980 the President of Mexico proposed the extension of a 0% rate to all foods, to the sale and temporal use or enjoyment of machinery and equipment necessary for their production, fertilizers, pesticides and other agricultural sanitation products, as well as the rendering of electricity services for water pumping for irrigation in agricultural uses; the new valid rate to the previous concepts since 1981, excluded them from the exemption given in the Law initiative of 1978 (Presidencia de la República, 1980).
The proposal for implementing the new 0% rate had the objective of accrediting the VAT payed by producers in the purchase of all supplies and services needed to elaborate and commercialize the food they had produced. The main objective of that proposal was to favor and promote the elaboration of agricultural, livestock and fishing products, and so to improve the quality of life of the most underprivileged people in the country (Presidencia de la República, 1980).
In December 1982, the President of Mexico proposed a considerable change in the general VAT rate that would be valid in 1983, setting it at 15%. On the same proposal, a 6% rate to tax the sale of medicines and industrialized food products was established, also a “high” rate to tax the sale and import of goods was set; the non-industrialized foods and the ones that integrated the basic basket remained taxed to the rate of 0%. On the other hand, an exemption of tax was established to the independent professional services, exclusively those related to medicine, only when the rendering required a medicine title4 (Presidencia de la República, 1982).
In 1983 the rate of 6% was still in force to apply to the value of acts and activities for which the tax had to be paid, but only those that were made by residents in the preferential zone of borderline regions in the north and south of the country; there also existed the 20% rate, applicable to the sale and import of luxury articles, fire weapons and aircrafts, independent professional services to users of credit cards, cable television, those that allowed practice of some sport activities and the membership fees for restaurants and clubs (Diario Oficial de la Federación, 1982).
The Initiative for the Federation’s Revenue Law for the fiscal year of 1988, proposed taxing with the general VAT rate all independent services given in borderline regions of the country, because it was unfair to apply them the rate of 6% unlike all other taxpayers with similar activities in the rest of the country, also it would allow a better tax collection by the federal treasury (Presidencia de la República, 1988).
Since 1989, the 0% rate extended to the sale and import of all food products, including the industrialized and the patent medicines, which would benefit the purchasing power of the citizens (Presidencia de la República, 1988). The general rate of 15%, the 6% rate for borderline regions, with its exceptions according to the activity, and the 20% rate over luxury goods and articles, stayed in force until December 1991.
On November 21st 1991 an Initiative released by the President of Mexico argued the interest to strengthen the purchasing power of consumers; he proposed to establish a general rate of 10% for the purpose of boosting the voluntary fulfillment of the taxpayers and a more controlled tax collection due to the homologation. This new Initiative also propounded the disappearance of the preferential treatment in the borderline regions of the country, including Quintana Roo, since according to the executive, they had a highly competitive level on their goods and services; the 0% rate would keep being applied to all products destined to alimentation and to patent medicines, both tax rates of 10% and 0% remained valid until 1995 (Presidencia de la República, 1991).
Another initiative under dictum in the year of 1994 proposed that in the VAT Law they were expressively subject to the rate of 0% sales of hydroponic greenhouses, equipment integrated to them and related services, such as pest eradication, slaughtering and others; additionally the services given in educative subjects of kindergarten were included in the exemptions of taxation (Presidencia de la República, 1994).
In mid-March 1995 the Congress received a Bill in which the President proposed increasing the general VAT rate from 10% to 15%, to begin its validity since April 1st of the same year; such action intended to increase federal revenue and strengthen state treasuries. The 10% rate would remain only in the borderline regions of the country, with the condition that the taxed acts or activities were carried out by residents of those areas and the delivery of goods or services were effected in that region; the excluded activities to apply the preferential VAT rate in borderline regions included the sale of properties (subject to the general rate of 15%) (Presidencia de la República, 1995).
In the same Reform that took effect in April 1995 was established that the sale of processed foods and patent medicines would remain taxed by the rate of 0%, but only sales realized to the final consumer, which entailed the tax general rate of products made in the earlier stages of production, adding drinks different to milk to this condition. In the case of acts carried out by the Federation, the Federal District, states, municipalities, decentralized bodies and public institutions of social security that gave rise to the payment of fees (excluding those that were for drinking water services) would be exempt from tax (Presidencia de la República, 1995).
The forcefulness for giving privilege to the sale of some basic products, forced the new Decree of November 1995 to consolidate the rate of 0% for processed foods and patent medicines at all stages of the production process until their sale to the final consumer (Presidencia de la República, 1995).
In December 2002 it was proposed to include the Municipality of Caborca in Sonora state, in the list of territories with the preferential VAT rate of 10%, to promote trade and improve its economy, as consumers in that area preferred to purchase goods abroad; thus, between 1995 and 2009 were imposed the overall rate of 15%, the 10% rate in borderline regions, and the 0% rate for medicines and unprocessed food (Presidencia de la República, 2002).
On October 20th 2009, the Commission of Finance and Public Credit ruled the Decree Project presented by the President of Mexico on September 10th of the same year, which reformed, added and repealed various tax provisions, omitting significant changes in the Value-Added Tax. On that occasion, the Commission of Finance and Public Credit didn’t fully endorse the measures proposed by the Executive on taxation, and considered necessary to amend the Value Added Tax Law for 2010 by applying an increase of one percentage point to the overall rate of 15%, setting it on 16%, and in the same way, the preferential rate in border areas and regions would be risen from 10% to 11%. The justification laid in the extreme need to cover public expenditure and to have resources to enable the country to meet programs that combat poverty (Comisión de Hacienda y Crédito Público, 2009). That same day the proposal of increasing the general and preferential VAT rates was approved by the Congress (Cámara de Diputados LXI Legislatura, 2009).
In the Law initiative presented on September 8th 2013, the removal of preferential rates for the borderline regions was proposed, leading to approve a general rate of 16% nationwide; to justify such change, the existence of inequality between the taxation of borderline regions and the rest of the country was argued, as well as the fact that these regions presented a low tax revenue, and their 11% preferential rate entailed a difficult tax management for the government. It was also argued that the difference in both general and preferential rates was not beneficial for consumers in the border lines and regions, as there was no positive impact on the prices of goods and services; so that the substantiation to apply the preferential rate had disappeared (Presidencia de la República, 2013). The Initiative was approved by Congress on October 31st 2013, and the approval of the general VAT rate of 16% throughout the national territory became in force since January 1st (Cámara de Diputados LXII Legislatura, 2013).
The need to reform the VAT Law was insistently argued, because of the low tax collecting that only represented the 3.74% regarding the Gross Domestic Product (GDP), which compared with other Latin American countries and members of the OECD that recorded between the 6.5% and 6.9% of their GDP, was significantly lower (Presidencia de la República, 2013).
As seen in this section, the VAT has been awarded with many changes, the last one being perhaps the most controversial, because it caused the disappearance of the preferential rate for the borderline regions. In this work, a primal hypothesis was raised, about judging if the increment of the VAT rate to 16% could be considered significant for tax collection, finding statistically significant changes in the VAT collection; the measurements to ten comparatives indicate even significant medium level changes, under meta-analysis criteria.
Outline of fiscal policy and administration
To understand the way in which the federal administration collects and transfers VAT to the states, it’s necessary to define fiscal federalism (Gutiérrez, 2015; Oates, 1972, 1999), as an agreement of parties, each one representing different margins of governance defined by geographic boundaries, also different, in order to maximize fiscal benefits under better control. In addition, federalism seeks to achieve efficiency (Chíguil, 2014) through the same regulatory scheme that allows homogeneous taxation, avoiding serious complexities; dealing with 32 different types of administration and control of taxes, such as the VAT or Income tax, would put the fiscal administration in a very chaotic situation.
In December 1979, when arguing the need for a harmonious national fiscal system that avoided as far as possible the overlapping of federal, state and municipal tax burdens, which could cause an excessive charge to taxpayers, the government of Quintana Roo decided to join the so-called National System of Fiscal Coordination (NSFC) contemplated in the Fiscal Coordination Law (FCL) (Congreso de la Unión, 1978). This decision served as an agreement that the collection of federal taxes, among which the VAT and Income tax were included, should be collected and administered by the Federal Treasury, and depending on the revenue obtained from all states added to the NSFC, the Federal Treasury would transfer financial resources to each entity, but by percents used for the calculation of the General Fund Shares and the Supplemental Financial Fund Shares (Secretaría de Hacienda y Crédito Público, 2015).
In the original adhesion of Quintana Roo signed in 1979, it was predicted that for cases where taxpayers only alienate products or services in a single state, the annual tax burden in charge of those taxpayers would be assigned to the same state, as well as the tax payed for the import of goods; for the case of taxpayers doing business in more than one state in the country, a weighting would be estimated from dividing the amount resulting from the multiplication of applying VAT rates to each taxed activity by the amount of establishments the taxpayer had in each entity; by the amount obtained from performing the same multiplication in all the taxpayer’s establishments.
Since the entry into force of the FCL, there had been carried out thirty-six different adjustments, nine of these in the 80’s, eleven more during the decade of the 90’s, twelve changes between 2000 and 2009, and the four amendments left were recorded in December 2011, December 2013, August 2014 and the last one was posted on April 27, 2016. The law, considering NSFC’s objectives to abate the gaps between the various entities of the country, states that resources initially administered by the Federal Treasury are sent to states and municipalities through two large groups of transfers, called Ramo 28 with compensatory goals and the so-called Contributions or Ramo 33, with compensatory aim; in spite of the transfer system,5 the NSFC has been listed as distant from an optimum point, among other things, for creating such a high dependence on federal administration taxes; with respect to the total tax revenue of the states, about 30% depend on federal shares, 54% on contributions (also federal) and only 7% are obtained from local revenues.
Contributions and shares are part of the country’s fiscal policy, which includes the estimated income, taxes among them, as well as public spending, containing the contributions and shares destined for all states; both elements come together in what is called Economic Project, which, in short, is a proposition on the distribution and purposes of the public resources estimated in the Federation’s Revenue Law for the subsequent fiscal year prepared by the Executive through the Secretary of Finance and Public Credit.
The Budget cycle begins with the Planning, the stage when the objectives of each budgeted program are compared and aligned with the National Goals, considering the economic situation at the global and national level for decision-making and the estimation of economic stability in the country. Some indicators used for the above are: GDP, the price of a barrel of oil, the exchange rate of the dollar, inflation, international interest rate and the US economy growth. All these scenarios and macroeconomic variables, corresponding to the next fiscal year, are sent to the Congress by the Executive in the month of April each year.
At the end of June, once the Initiative of the Federation’s Revenue Law has been made, the Executive sends the structure of budgetary programs for the following year to Congress, whom will be in charge of the agencies and related entities. During the budget year, the revenues previously estimated are allocated to financial public spending of budget revenue programs; every September 8th, the Executive sends to the Congress the Economic Package for analysis, discussion and modification.
The Congress and the Senate have every October 20th and 31st as deadlines, respectively, for the approval of the Federation’s Revenue Law; once the Law is approved, no later than November 15th of the same year, the Expenditure Budget of the Federation is approved by the Congress. Once the Budget is approved, each agency and entity to which resources for public programs were assigned, exercises the expenses under the previously determined calendar.
Already in the distribution of resources to all entities of the country, which corresponds by concept of federal contributions, it is transmitted to the states, but conditioned to items and concrete concepts for application in accordance with the Federation without any possibility of reallocation; for its part, what corresponds to federal shares, can be considered within the resources and sovereign decision of each state, its application rests under decision of each federal entity.
Tax revenues and performance of VAT
Tax revenues are those from contributions, among which the Income Tax (IT), the Value Added Tax (VAT), the Special Tax on Production and Services (STPS), the General Import Tax (GIT), the Exploration and Extraction of Hydrocarbons Tax (EEHT) stand out, as some others already repealed but that its collection is still managed, such as the particular case of the Business Flat Tax (BFT) and the Tax on Cash Deposits (TCD), moreover the Tax over New Automobiles (TNA) (Servicio de Administración Tributaria [SAT], 2016).
After the Income Tax (IT), the second in importance is the VAT, which is collected by the Tax Administration Service (TAS) in each of the states, according to their adherence to the NSFC, and administered by the Federal Treasury.
Table 1 Tax collection in Mexico, period 2000-2015 (In million pesos)
| Period | Tax Revenues | IT | VAT | STPS | Others |
| 2000 | $581,703.40 | $258,754.20 | $189,606.00 | $81,544.10 | $51,799.10 |
| 2005 | $810,510.90 | $384,521.80 | $318,432.00 | $49,627.10 | $57,930.00 |
| 2010 | $1,260,425.00 | $626,530.40 | $504,509.30 | $4,463.80 | $124,921.50 |
| 2015 | $1,793,631.50 | $948,751.70 | $539,083.90 | $257,036.40 | 48,759.50 |
Source: Table made with data from TAS.

Source: Figure generated with data from TAS.
Figure 1 Tax collection in Mexico, period 2000-2015 (In millions pesos)
In the specific case of Quintana Roo, and considering the various changes made to the VAT Law regarding the exchange rate, including the preferential situation for border regions, the collection shows a good performance, at least when considering figures at current prices.
By the year 2000, the preferential rate of 10% had been applicable in the state of Quintana Roo for eight years, and continued its validity until December 2009. As can be seen in Figure 2, increases in the VAT rate effectively meant an increase in tax collection; during the life of the 10% rate a steady increase in the total amounts collected until 2006 were observed, when revenue decreased by 15.42% compared to 2005. The total tax collection for the next two years remained stable until 2009, the year in which an increase of 22.96% could be observed, compared to 2008. By 2010, when the preferential rate for border areas was raised to 11%, there was an improvement of 37.37% in VAT collection in Quintana Roo, which proved that the decision to increase the preferential rate in one per cent was the right one, if what the Federal government wanted was to increase the collection of the tax then. VAT collection continued heightening during the following years in which the rate of 11% remained in force.

Source: Own elaboration.
Figure 2 Position of the state of Quintana Roo at national level under the VAT collection, period 2000-2015 (In million pesos)
With the Initiative for 2014 presented by the President of Mexico the general VAT rate was approved in the entire country, meaning a possible increase in tax collecting for Quintana Roo, since the rate would rise a five percent. The total VAT collected in the state in 2014 was 7,175.9 million of pesos, approximately 70% above the 4,205.20 million of pesos collected in 2013. Due to the positive results of the decisions made by the Federal Government in 2014, everybody would believe that the situation would improve for the year 2015, after a year of the elimination of preferential rates; however, in 2015 the total amount of tax collection was 5,984.80 million of pesos, a 16.60% less than in 2014. According to the above, Figure 2 shows, at first glance, better performance in the collection of VAT in the state with respect to other entities; however, the research question proposed in the previous section comes up: Can the changes in tax collection of VAT in Quintana Roo be considered statistically significant over time?
During the preparation of this work, a search for studies and previous articles that evaluated the performance of Value Added Tax (VAT) from different aspects was made, an example of this are Tax Statistics presented by the OECD, covering the period 2009 - 2014, noting an increase in tax collection in all countries associated to it, including Mexico, phenomenon attributed to the increase in tax rates; the agency said that the increase in tax rates was made mainly on VAT and Income Tax, what included Mexico within the countries that contributed to an increase of 0.2 percentage points of GDP in 2014, attributing the result to the Fiscal Reform that took place in December 2013 (Organización para la Cooperación y el Desarrollo Económicos, 2015).
In regard to the approval of the general VAT rate in the border lines and regions (effective from January 1st 2014), an article that aims to present an assessment of the behavior of the basic economic indicators associated to that approval was found, with the purpose of exploring its main impacts (Fuentes, Ruiz, González, & Brugués, 2016). The authors noted the recessive, distributive and inflationary effect of the approval of the general VAT rate on the northern border, along with reduction of consumers, who eventually preferred to shop on the other side of the border, most notably since June 2014. It was concluded that cross-border trade suffered a decline due to fiscal equalization, a phenomenon that politics underestimated by eliminating the preferential rate of 11% (Fuentes, Ruiz, González, & Brugués, 2016), however, this article does not present calculations nor statistical tests, so it does not imply sustainability in this work.
Since January 2013, Ramirez Cedillo already considered important the option of a tax reform that generalized the VAT rate as a measure to the poor tax collection observed in Mexico (Ramírez, 2013), he attributed the success of the tax in other countries to its ease of administration, revenue collection capacity and stability of income with independence of economic cycles; despite not making use of statistical methods to express his conclusions, Ramirez considered possible to generalize the VAT without necessarily having a welfare loss for taxpayers and consumers with lower incomes, and could also result in higher revenues compared to those collected until that date. Thus also he said that among the virtues ascribed to the generalization of the VAT was a decrease in tax evasion and avoidance (Ramírez, 2013).
The work of Huesca, Robles and Araar (2015) presented an evaluation of the tax reform in Mexico in 2014, with specific interest in knowing the effects on the northern border of the country, focusing on nonparametric ratings that would provide them with estimates of inequality under the allocation level principle, income level and range suggested by the author Kakwani (1977) obtaining an indicator of the level of progressiveness that could be established from the increase in the VAT rate for the border regions, concluding bluntly that the absorption of tax burden was not only not progressive but should be listed as clearly recessive, as well as violating the principle of tax equity, in this sense the author’s work represents an important referential element, but needs to be complemented by this study, because although the same methods to understand the impact of the rate change were not applied, it is also true that these authors limited their analysis to the northern border of the country, unknowing which results were reported in the southern part of Mexico, specifically in Quintana Roo .
In the same line of evaluation with an approach to border regions in northern Mexico, Davis (2011), through a method of discontinuous regression that employs referential digits before and after of purchases taxed with VAT, with the intention of knowing the local effect, in this case the northern border, allowed him to argue the presence of economic distortion caused by the demarcation of the preferential rate, caused by consumers’ purchases in localities with a different rate to 11%, in force at the time for the border region of northern Mexico, however, considering that by 2016 the VAT rate is the same for the whole country, also suggests the need to carry out further studies, as the one presented in this article, to know how efficient the changes have been for the state of Quintana Roo that besides had changed firstly from 10% to 11%, to this date the general rate of 16% has been imposed for the entire country.6
Valuation methods for changes in revenue
Considering the VAT collection from January 2003 until August 2015, the monthly average is close to $273,222,000 million of pesos, if the states’ tax collections are compared, to the year 2011 Quintana Roo occupied 16th place, at the end of 2012 its revenues increased and was placed nationally in 14th place, then improved its positioning in 12th place, if taken into account the revenue recorded from January to August 2015.
This shows that, at least in the national position, the state has been improving its participation in the collection of this tax, which makes it meritorious to conduct an analysis in greater detail that allows to judge if in Quintana Roo, changes can be considered significant in the period from January 2003 until August 2015; it should be noted the importance of measuring changes in revenue in the state since its repositioning at national level can also be caused by changes in collection efficiency in other states of the country.
Originally it was proposed to analyze the tax collection from 1995 to 2015, however, in the official response it was declared the absence of official information concerning the years 1995-2002, leaving for an arranged analysis to be developed, a series of data whose monthly amplitude is of 152 observations, grouped in thirteen years, the last of these, 2015 with information until the month of August (Servicio de Administración Tributaria, 2015).
To set the measurement of changes in tax collection three different methods will be considered, the first two considered as classics in the statistical evaluation of significance, by Normal Distribution with P Value to Z (Chen & Nadarajah, 2014; Comet, et al., 1999; Gelman, 2013; Kazmier, 2006) as well as with T distribution and its corresponding P value (Lange, Little, & Taylor, 1989; Levin, Krehbiel, & Berenson, 2014; Papastathopoulos & Tawn, 2013); additionally a third method, with two parameters, both belonging to the meta-analysis (Borenstein, Hedges, Higgins, & Rothstein, 2009; Glass, 1976; Hedges, 1983; Hedges & Rhoads, 2010; Ledesma, Macbeth, & Cortada de Kohan, 2008; Lee & Glass, 1977; Morales, 1993; Morris & DeShon, 2002), the delta parameter δ to measure changes in the standardized average and the coefficient r to provide the size of the effect on each year’s tax collection, the latter being elements that will define not only the presence or absence of significance, but a particular level in each case.
Significance with criteria of Normal Distribution and T Distribution7
First, tests comparing the difference of averages corresponding to two different years will be made, starting with the comparative 2003-2004, then with 2004-2005 and so on until finishing with the comparative 2014-2015, in observing the changes in the VAT rate, and even the economic situation of different periods, may have influenced in a higher or lower tax revenue, for all cases are considered as Main hypothesis in each comparative that μω ≠ μφ where μφ corresponds to the average of the most recent period, while μω represents the average of the oldest period, and σω the standard deviation also of the oldest period; ϵ represents the error.
To accept or reject the hypothesis in each case the result will be taken into consideration for Z value (Comet, et al. 1999; Ziegler, 2001) despite being a classic method it has been considered efficient even on other statistical tests, plus it can be complemented with meta-analysis (Chen & Nadarajah, 2014; Zaykin, 2011), which will express the number of times of standard deviations found in each case; the P value will also be determined (Romano, Shaikh, & Wolf, 2010; Wai-Yip & Yetman, 2013) (Gelman, 2013) for each Z value8 determined, according to the following (Levin, Krehbiel, & Berenson, 2014; Wackerly, Mendenhall, & Scheaffer, 2010):
Where
Considering only the Z value, the Main hypothesis will be accepted when:
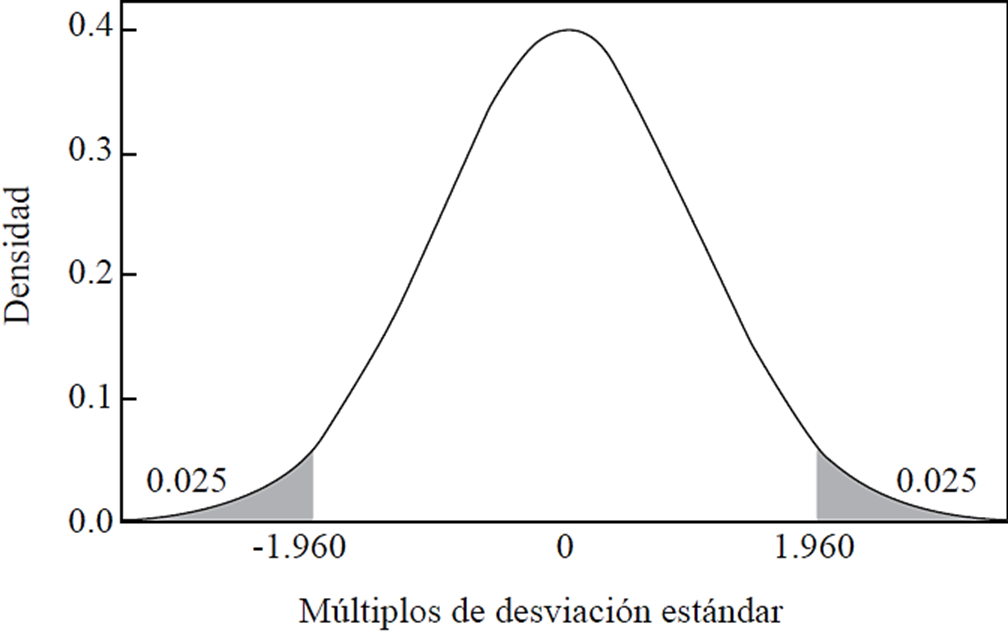
Source: Figure generated with Minitab 17.
Figure 3 Limits for considering significance of α = 0.05 to both ends Normal Distribution
It is considered evaluating the statistical significance by means of T value, which uses the approximate standard deviation (Lange, Little, & Taylor, 1989; Peel & McLachlan, 2000; Bollerslev, 1987), for this article each comparison will be considered, the one that corresponds to the latest known year, rather than the one that corresponds to the oldest year, as indicated in note 4 of the previous page
Only considering the T value, the Main hypothesis will be accepted when
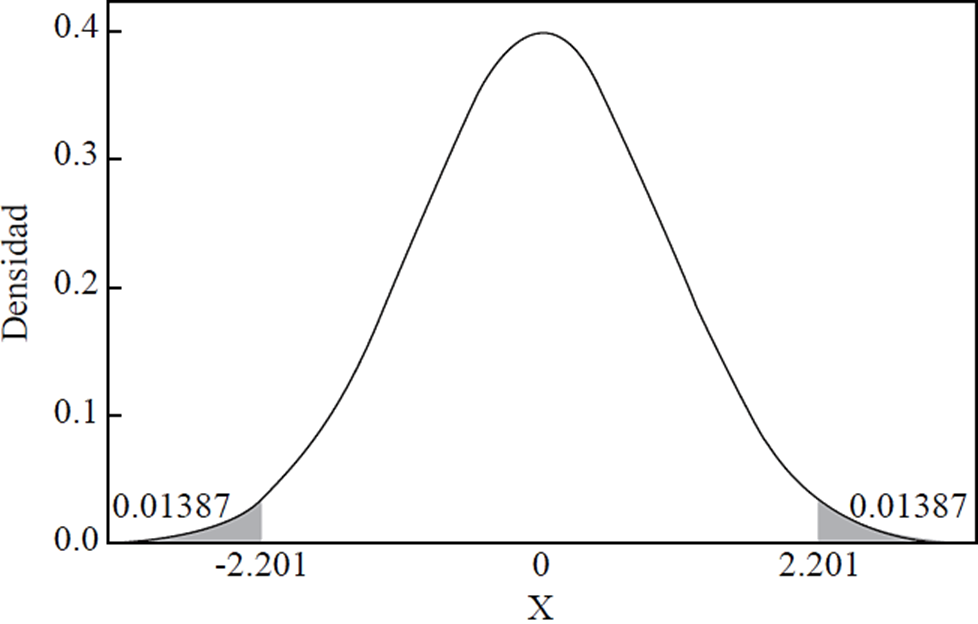
Source: Figure generated with Minitab 17.
Figure 4 Limits for considering significance of α = 0.05 to both ends T Distribution
From Z value as from the T value, the estimates for each case of the P value will be obtained depending on each distribution, with significance of α = 0.05 comparisons of the average revenues will be made, starting with the corresponding period to 2003 compared to 2004, then the averages of 2004 will be compared with respect to 2005’s and so on until obtaining the value for the averages of the year 2014 compared to 2015.
Level of changes through meta-analysis
Taking as precursors to Glass (1976), Lee (1977), Hedges (1983), Borenstein, Higgins and Rothstein (2009), the meta-analysis has been considered as a quantitative methodology (Cotton & Tuttle, 1986) that emerges from previous analysis, usually denominated classic, among which the comparison of averages is (Ledesma, Macbeth, & Cortada de Kohan, 2008; Morales, 1993) but having as a shared condition the same interest in the proof of some specific hypothesis, for this case μω ≠ μφ, one of the reasons that justify the studies as this one are contrasted by one or some of the parameters of meta-analysis is, precisely, not just to accept or reject tacitly the significance of a change in the average but to know, with clearly established criteria by the precursors of this movement, if the changes can be considered as low, medium or high significance.
As part of the meta-analysis, it is recognized that the statistical δ represents the result for the averages difference, and for this study the following criteria are assumed (Morris & DeShon, 2002; Rice & Harris, 2005; Ruscio, 2008 )
As what relates to the coefficient of correlation rφω is recognized by most of the precursors of meta-analysis as the effect size, the result will invariably be subject -1 ≤ rφω ≤ + 1 where a greater number obtained will mean a greater effect of change, assuming for this study the following criteria (Rice & Harris, 2005; Ruscio, 2008; Morris & DeShon, 2002):
δφω both to rφω shall be considered the T values obtained for the classical significance analysis, concentrated in Table 2, using Equations (10) and (11) the following was obtained:
Table 2 Evaluation of significant changes
| Periods compared | μφ | μω | ϵφ | ϵω | Z | P Value |
T | P Value |
¿Significance? |
| YES / NO | |||||||||
| 2003 - 2004 | 160.97 | 131.95 | 12.804 | 6.35 | 4.57 | 0.000 | 2.27 | 0.045 | YES |
| 2004 - 2005 | 184.72 | 160.97 | 19.898 | 12.80 | 1.85 | 0.064 | 1.19 | 0.258 | NO |
| 2005 - 2006 | 156.22 | 184.72 | 15.925 | 19.90 | -1.43 | 1.848 | -1.79 | 0.101 | NO |
| 2006 - 2007 | 157.33 | 156.22 | 25.867 | 15.92 | 0.07 | 0.945 | 0.04 | 0.967 | NO |
| 2007 - 2008 | 155.09 | 157.33 | 61.023 | 25.87 | -0.09 | 1.069 | -0.04 | 0.971 | NO |
| 2008 - 2009 | 190.72 | 155.09 | 14.817 | 61.02 | 0.58 | 0.559 | 2.40 | 0.035 | YES |
| 2009 - 2010 | 261.99 | 190.72 | 11.526 | 14.82 | 4.81 | 0.000 | 6.18 | 0.000 | YES |
| 2010 - 2011 | 302.37 | 261.99 | 13.122 | 11.53 | 3.50 | 0.000 | 3.08 | 0.011 | YES |
| 2011 - 2012 | 312.33 | 302.37 | 13.779 | 13.12 | 0.76 | 0.448 | 0.72 | 0.485 | NO |
| 2012 - 2013 | 350.43 | 312.33 | 11.069 | 13.78 | 2.77 | 0.006 | 3.44 | 0.005 | YES |
| 2013 - 2014 | 597.99 | 350.43 | 17.196 | 11.07 | 2.36 | 0.000 | 14.40 | 0.000 | YES |
| 2014 - 2015 | 748.10 | 597.99 | 20.948 | 17.20 | 8.73 | 0.000 | 7.17 | 0.000 | YES |
Source: Own elaboration.
Table 3 Evaluation of significant changes by means of parameters δ and r
| Periods
compared |
δφω | Significance | rφω | Significance |
| 2003 - 2004 | 1.367 | great significance | 0.564 | great significance |
| 2004 - 2005 | 0.720 | moderated significance | 0.339 | moderated significance |
| 2005 - 2006 | -1.079 | great significance, negative | -0.475 | moderated significance, negative |
| 2006 - 2007 | 0.026 | very little significance | 0.013 | very little significance |
| 2007 - 2008 | -0.022 | very little significance, negative | -0.011 | very little significance, negative |
| 2008 - 2009 | 1.450 | great significance | 0.587 | great significance |
| 2009 - 2010 | 3.729 | great significance | 0.881 | great significance |
| 2010 - 2011 | 1.856 | great significance | 0.680 | great significance |
| 2011 - 2012 | 0.436 | moderated significance | 0.213 | moderated significance |
| 2012 - 2013 | 2.076 | great significance | 0.720 | great significance |
| 2013 - 2014 | 8.681 | great significance | 0.974 | great significance |
| 2014 - 2015 | 4.321 | great significance | 0.908 | great significance |
Source: Own elaboration.
Subsequently the results of significance, obtained by the three methods, are compared to identify whether if changes of sign or ascents from very little to great significance are presented.
Results and conclusions
In ten out of twelve of the comparisons presented in this article we have found the presence or absence of significance, according to the P value under Normal Distribution (Z) criteria and also T Distribution, as well as the parameters of the meta-analysis; only in the comparative 2005-2006 discrepancy was presented in the results, which is due to the Z and T values which were within the limits in each case, in addition to the negative sense in the tax collection, phenomenon attributed to the impact of Hurricane Wilma in 2005 that, by Official Decree, allowed taxpayers to pay federal taxes on a deferred basis; this particular case is a clear example of the need to complement classic estimates with meta-analysis, because under the first classic estimate the hypothesis μω ≠ μφ would simply be rejected, however, if we take into account not only the tacit rejection with the limit Valor P > 0.05, but also with levels as the proposed by meta-analysis, then this comparison wouldn´t even be of great significant change.
Table 4 Evaluation of significant changes by means of parameters δ and r
|
PZ,T
Value |
δφω | rφω | ||
| Periods compared | Significance | Significance | Significance | Discrepancy* |
| 2003 - 2004 | YES | great significance | great significance | NO |
| 2004 - 2005 | NO | moderated significance | moderated significance | NO |
| 2005 - 2006 | NO | great significance, negative | moderated significance, negative | YES |
| 2006 - 2007 | NO | very little significance | very little significance | NO |
| 2007 - 2008 | NO | very little significance, negative | very little significance, negative | NO |
| 2008 - 2009 | YES | great significance | great significance | NO |
| 2009 - 2010 | YES | great significance | great significance | NO |
| 2010 - 2011 | YES | great significance | great significance | NO |
| 2011 - 2012 | NO | moderated significance | moderated significance | NO |
| 2012 - 2013 | YES | great significance | great significance | NO |
| 2013 - 2014 | YES | great significance | great significance | NO |
| 2014 - 2015 | YES | great significance | great significance | NO |
* Discrepancy was considered only in those cases where the significance was denied by methods of P Value with 0.05 significance and on the other hand, the results by meta-analysis indicated moderated or great significance; also in cases where significant change would have been determined by means of P value while in the parameters of meta-analysis would’ve resulted very little or negative significance.
Source: Own elaboration.
The results of the article show that taxes, in 2010, increase from 10% to 11%, and in 2014, the increase was from 11% to 16%, which clearly demonstrated that the rate change was effective, reflecting in a greater tax revenue in the state of Quintana Roo, dispelling some opinions regarding the danger of experiencing the impact of financial strategies with hiring hotel and tourist services in other countries to avoid increase in costs. In this sense the results show that the increases to VAT enable greater tax collection not only in the immediate next year after implementing the new higher rate, but over longer periods, as can be seen from the results listed as of great significance in increasing the tax collected in the comparatives from the year 2010 until part of 2015.
It is noteworthy that before the tax increases, from 2003 to 2008, in most cases little significance was observed and even, as mentioned above, in which it corresponded to 2005 compared to 2006 it can be considered as medium/moderated to great significance the reduction of taxes; this situation is a factor to be taken into account for future decrees seeking to or defer the payment of tax in case of natural disasters, because its negative impact on public resources is, as demonstrated, of a great significance that would require a strict budget adjustment.
Considering the significance only by the normal and T distribution parameters, seven comparisons would be accepted, however, when considering effect sized parameters as the conclusive decider, from levels of medium/moderated and until consider major change in the averages, there should be accepted 10 of the comparatives, only hypotheses μ2006 ≠ μ2007 μ2007 ≠ μ2008μ would be rejected, therefore, the effect of having increased the VAT for the state of Quintana Roo was at least of medium/moderated significance.
At last, we present this work so the methodology used in it could be applied to the northern borderline regions as well, with the prevision of counting on the specific tax revenue of any borderline state that is pretended to be measured, which in consequence, could serve as a way to evaluate public policies that affect the tax burden of taxpayers.

