nueva página del texto (beta)
 Inglés (pdf)
 Artículo en XML
 Referencias del artículo
 Enviar artículo por email
 Citado por SciELO
  Similares en
SciELO
Similares en
SciELO 
 Permalink
Introduction
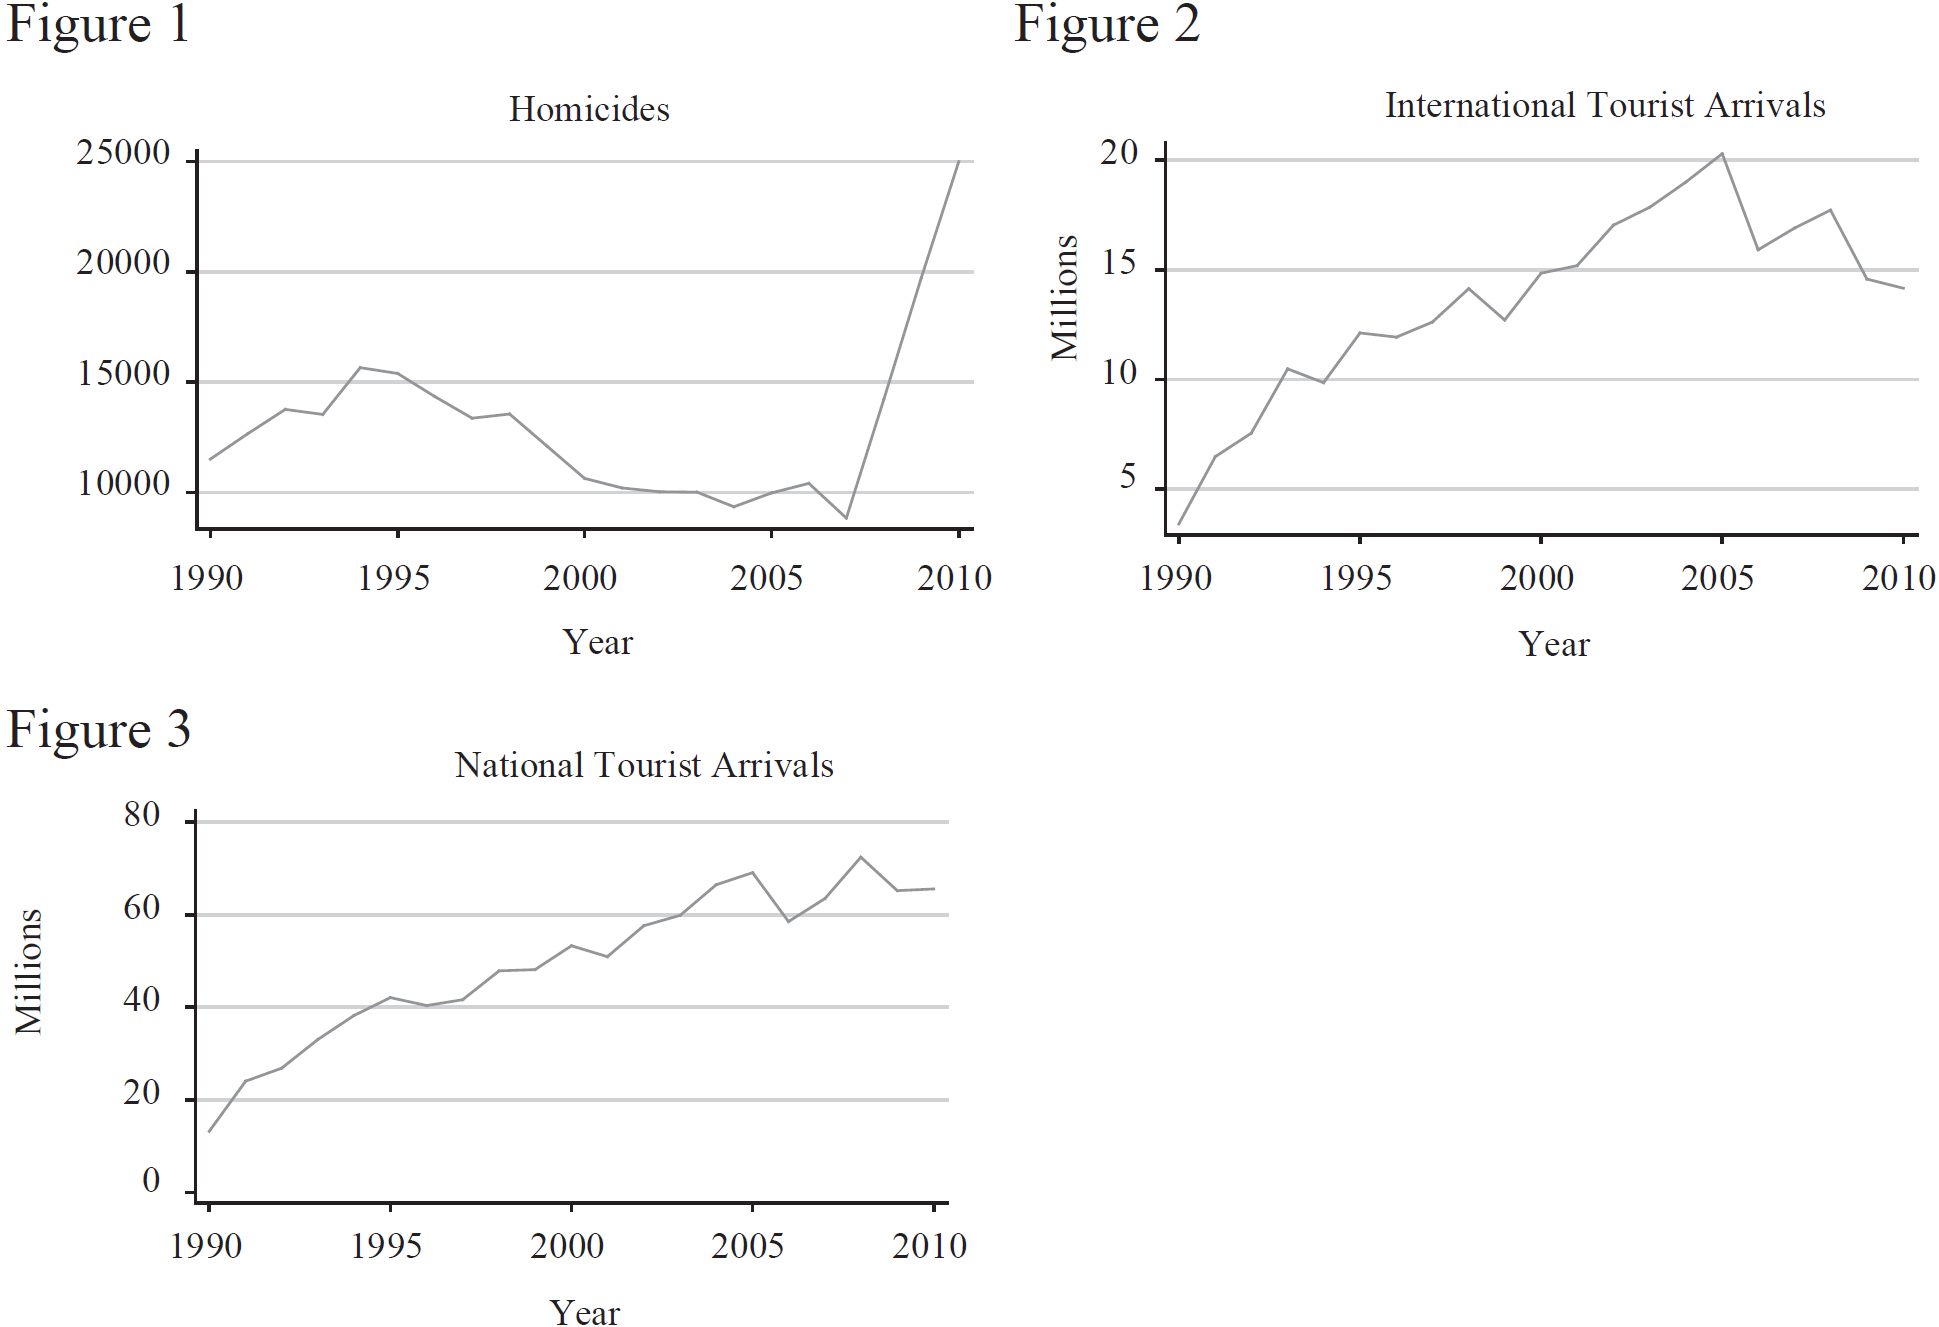
Does violent crime deter tourists from visiting México? According to the United Nations World Tourism Organization (UNWTO 2016), México was ranked in 2016 as the 8th place to visit in the preferences of international tourists. Conversely, the country was ranked 142 out of 163 countries by the Global Peace Index (2017), with 163 being the most violent country. In the year 2006 the Mexican government decided to give a frontal fight to the different drug trafficking organizations (henceforth DTOs) operating all across the Mexican territory. As a result of this strategy violent crime in the form of homicides started to dramatically increase (Ríos 2012). Thus, it was not uncommon to read since the end of 2006 the headlines of international and national newspapers reporting the increasing wave of violence in México. This has had a negative impact on the Mexican society. For instance, Braakman (2012) provides evidence on some of the non-monetary costs of crime in México. His results show that men and women in México change their behavior in response to victimization risks or actual victimization. These changes include the carry of a weapon for men and the change of transportation methods for women.
Moreover, after the intensification of violence from early 2007 onwards, analysts in the U.S. and México argued that there was a strong similarity between terrorism and attacks by the DTOs in México.2 Other scholars directly maintain that the Mexican DTOs are terrorists and explain that the tactics, organization and their goals are homogenous to those used by terrorist organizations, (Longmire and Longmire 2008). For instance after the detonation of hand grenades in a crowded public square in Morelia, capital of the state of Michoacán on México´s Independence Day in September 2008, local and international media have gone as far as qualifying these attacks as terrorism. Local newspapers reported the getaway of tourists on the following day.3 Further examples of terrorism-like events occurred in 2008, 2010 and 2011 in the states of Sinaloa, Chihuahua, Tamaulipas and Nuevo León where vehicles deliberately went off either in parking lots or near to police stations.4 Following on this, more than one country5 has recommended their citizens not to choose this country for holidays. Travel warnings for international tourists describe this kind of events in their alerts and express their worries about the integrity of people, as pointed out by the Australian Department of Foreign Affairs and Trade in their Travel Advice for México: “Travellers may become victims of violence directed against others”.6 It has been documented in Neumayer (2004) that tourists are sensible to violent events happening in their holiday destination and which can harm their physical integrity. He points out that if violent events repeatedly occur and increase their intensity, the authorities of the origin of tourists start warning their citizens against visiting that particular destination. Despite the importance of the tourism industry for the Mexican economy, there is no empirical evidence analyzing the extent to which violent crime affects tourism in México. This paper aims at filling this gap in the literature. For this purpose, I use a unique dataset on tourist arrivals in each of the 31 Mexican states and México City. The advantage of these data is the distinction between arrivals of international tourists from those of local tourists for the 1990-2010 period. I expect international tourists to be more intimidated by crime than local tourists. The latter benefit from their location in the country and thus directly know what is occuring, while the former are mainly informed by what they read, hear or see in the news. In this respect, different scholars in economics, criminology and psychology have studied the implications of these information asymmetries for tourism as a result of political conflicts among countries and terrorism. For instance, Fielding and Shortland (2009) analyze how the US tourist flows to Israel are affected as a result of the actual intensity of the Israeli-Palestinian conflict and the intensity reported in US television news coverage. Their results suggest that if alternative sources of information are costly, then tourists may infer the current level of risk in travelling to Israel from the television news. A similar conclusion is provided by Romer et al. (2003) who argue that viewing local television news is related to increased fear of and concern about crime. Furthermore, Sunstein (2003) argues that one or two terrorist incidents will have a significant impact on thought and behavior of people, with exaggerated risk perceptions being a likely result of the substantial publicity given to such incidents. Following on this, due to social interactions, knowledge about terrorist incidents spreads rapidly through the population and this in turn greatly aggravates fear. Earlier on, Morley (1998) highlighted that individuals are assumed to overcome missing information about destinations thanks to the contact with people which previously visited those countries. Moreover, Clerides et al. (2008) argue that information gaps are solved thanks to the activity of tour operators and travel agencies. They find that tour operators provide a better matching for quality with price and result in a more efficient market outcome. Given these previous studies it is plausible to argue that violent crime in México is likely to facilitate a generic impression of unrest being spread all over the country.
Due to the availability of tourism flow data, the period of study is restricted to 1990-2010. However this period takes into account the scaling up of crime during the years 2007-2010 when the Mexican government started to directly fight organized crime. The findings show that international tourist flows are more affected than local tourist flows after controlling for violent crime, income, price level, urbanization, weather, and infrastructure. As a starting point I propose a dynamic panel data model with fixed effects. According to Nickell (1981) the inclusion of the lagged dependent variable in a model with fixed effects results in biased estimates when the time dimension of the panel is small. Thus, in order to correct for this bias I implement the Least Square Dummy Variable estimator (LSDVC) developed by Bruno (2005a, 2005b) for unbalanced dynamic panel models. Next I propose the use of two instruments to account for the potential reverse causality in the tourist arrivals and violent crime variables. This procedure allows me to account for the potential reverse causality only but not for the bias arising from the lagged dependent variable. Following on this, I obtain the fitted values of the first stage regression from the 2SLS procedure and use them in the LSDVC estimation instead of the violent crime variable. This allows me to control not only for the lagged dependent variable bias but also for the potential reverse causality in the variables tourism arrivals and violent crime.
The rest of the paper is organized as follows: “Leterature review” provides a review of the literature on tourism demand and crime. “Data and method” explains the data selection based on the literature on tourism demand and presents the empirical methodology. “Empirical results” discusses the results, while the last section concludes. The conclusion is followed by an appendix including graphs and robustness checks.
Literature review
Tourism demand and crime
The literature on crime and tourism is small. Most work on the impact of crime on tourism concentrates on qualitative evidence as for instance, De Albuquerque and McElroy (1999) for the Caribbean, and Ferreira and Harmse (2000) for South Africa. Both studies rely on comparing available tourist crime victimization data in order to illustrate how crime affects tourism. De Albuquerque and McElroy (1999) first revise the recent history of violent and property crime in several Caribbean destinations and then highlight three hypotheses regarding the link between tourism and crime. The first of these hypotheses states that tourists in mass destinations are more likely to be victims of serious crimes than residents. The second hypothesis looks at the crime and victim type, and claims that tourists are more likely to be victimized by property crime and residents by violent crime. Lastly, the third hypothesis argues that the victimization rates are influenced by tourist density levels. Albuquerque and McElroy (1999) use data on victimization of tourists provided by the Royal Barbados Police Force for the period 1989 till 1993 and data of Barbados` resident victimization rates. By residents they refer to the inhabitants of Barbados and not to local tourists. Basically they compare the datasets of tourist victimization with the resident´s dataset and arrive at their conclusions without implementing any econometric methodology. They acknowledge the need to explore whether overall crime rates and victimization come along with mass tourism development, or whether observed crime rates are influenced by island-specific determinants. In the same vein Ferreira and Harmse (2000) offer a qualitative study for South Africa. They gather statistics on the 37 most committed crimes in the main urban areas of this country for the year 1997. Their work does not offer an econometric analysis and concentrates in the comparison of crime across the main South African urban areas. Moreover they also describe that tourists can change their preferences for a specific holiday destination if crime is present and in this way a so called spillover effect is expected. Different to the previous studies, the work by Levantis and Gani (2000) is one of the few quantitative studies on the issue. They study how crime affects the arrivals of tourists in four small Caribbean and four South Pacific islands states. As dependent variable they use the country`s share of total tourism flows to the region. They prefer this tourism measure over tourist expenditure, because the former better captures the deterrent effect of crime on travel to the desired destination. This is similar to Neumayer (2004), who also prefers tourism flows as a dependent variable since this is a more precise variable than tourists` expenditures. Levantis and Gani (2000) construct time series data from 1970 to 1993. Regarding the crime variable they argue that is not possible to compare crime rates across nations since the data availability and crime classifications are different across their sample. After constructing an index of the incidence of crime for each country in order to compare the trends in crime. They find that crime negatively affects the demand for tourism.
Tourism and crime in México
Several developing countries have seen tourism as a strategy for economic development. As the United Nations World Tourism Organization documents, tourism provides about 9.6% of the world´s total employment. This includes jobs indirectly supported by the industry. Furthermore, it accounts for 28.2% of the world´s exports of services (UNWTO 2017). More specifically, for México the tourism industry contributed 7.4% of the country´s GDP in the year 2016 and is after oil exports and remittances the third source of foreign currency for the country (WTTC, 2017). As of now there is no empirical evidence arguing that organized crime is targeting the tourism industry in México as a way to exert political pressure on the Mexican government. According to Dell (2011), the motivation for violence among the DTOs is the fight to take over the control of the routes of drugs from México to the United States. Following on this, the increasing violence in México consists primarily of drug traffickers killing each other. More recently, Ríos (2012) has investigated why violence has dramatically increased in the last 4 1/2 years in México. According to her research, the wave of violence hitting México can be explained, on the one hand, by homicides as a result of traffickers fighting each other when competing for territories and on the other, by the enforcement operations taken by the Mexican Federal Government to arrest drug traffickers. These enforcement operations have had a negative externality on the country. Ríos (2012) calls this a self-reinforcing equilibrium; more precisely, the situation in which the government weakens the structure of the DTOs and this in turn fuels the incentives of DTOs to fight among them and eliminate the weakest DTOs. In the short run the costs of this strategy are reflected in an increase in violence. In the long run, the DTOs will weaken enough so that violence will stop. Undoubtedly, this situation has put lot of burden on the Mexican society and damaged the reputation of the country. Given that tourism represents one of the most important industries in México, I analyze whether there is an effect of violence on the tourism industry.
Data and method
The data used in the paper is a panel dataset across 31 Mexican states and México City during the 1990-2010 period. The following specification estimates the tourists arrivals (TA it ) (logged), in state i in year t as a function of past tourist arrivals, InTA it-1 , homicides InH it and a vector of control variables Z it :
where v
i
denotes state fixed effects to control for unobserved state specific heterogeneity in the panel dataset,
Having described the two main variables of interest I turn now to the vector of control variables (Z it ) which includes other potential determinants of tourist arrivals reported in state i during year t. I select these control variables from the existing literature on the subject.
The literature on tourism demand has focused on the study of international tourism while neglecting the study of national/local tourism. This literature can broadly be divided in two groups: The first group corresponds to contributions whose aim is to forecast tourism statistics as number of nights of stay, expenditures by tourists and /or the number of tourists arriving. For instance, the work by Witt and Witt (1995), Lim (1997a, 1997b and 1999) and Li et al. (2005) provide a good overview of articles on tourism demand forecasting. The second group of contributions concentrates on explaining its determinants. Within this group, the papers by Crouch (1994), Poirirer (1997), Cothran and Cothran (1998), Sonmez (1998), Sonmez and Graefe (1998), Neumayer (2004), and Clerides et al. (2008) provide an overview of the determinants of international tourism flows. Crouch (1994) reviews the literature on the determinants of international tourist flows. He argues that research in the 1980´s has found income elasticities of demand above unity confirming in this way the view that foreign travel is a luxury good.
I use the natural logarithm of the gross domestic product per capita in state i during year t as a proxy. I expect a positive and significant effect. A better economic environment enhances appropriate conditions for the stay of tourists. Furthermore researchers have used a wide variety of variables to represent prices in their models. In the context of international tourism demand, the variables used to represent prices have been foreign currency prices of tourist goods and services in destinations, the cost of transportation between origin and destination country and the effect of exchange rate variations on purchasing power. Put differently, as consumers, tourists also decide where to go based on the price of the goods they want to purchase; for instance holiday packages, which in some cases include flights and hotel reservations. In order to account for the differences in prices I use the price levels9 of the main cities in each Mexican state and México City. These data were computed by the Mexican Central Bank and are used in the construction of the main national inflation index. Since the summer 2011, INEGI is responsible for conducting the inflation measurement and for reporting it to the Federal Government and to the public. However, since I only consider the period 1990-2010, these data are taken from the Mexican Central Bank. I expect a negative and significant impact of this variable. Higher prices can induce tourists to visit some other cheaper destination. Another important determinant of tourism demand is nature. Within this literature, one of the earliest studies addressing how climate in the tourist destination affects the arrival of tourists is the work by Abegg and Koenig (1997) in which they evaluated how predicted changes in weather conditions affected the winter tourism industry in Switzerland. They found that under “winter-normal” climate conditions, 85% of all Swiss ski areas are reliable for the practice of winter sports. Nevertheless if temperatures would rise by two grades Celsius, this number would drop to 63%. Along these lines the papers by Faulkner (2001) and Murphy and Bayley (1989) have offered qualitative assessments as to how to deal with natural disasters in tourist locations. Following on this and given the geographic location of México with a coast length of 7,828 kilometers on the Pacific Ocean side and with a coast length of 3,249 kilometers on the side of the Gulf of México and the Caribbean Sea, the country experiences throughout a year several tropical storms which derive in hurricanes of high intensity. Thus, I use the number of hurricanes which caused the worst floods in state i during year t and construct a dummy variable which takes the value of one if a state was hit by a hurricane in year t. In general, a hurricane can hit more than one state in the same year. The data are from the Meteorological National Service10 and from the Engineering Institute of the National Autonomous University of México (UNAM).11 I also include a control variable which accounts for urbanization. This is the amount of people living in urban areas as a share of total population in state i during year t. I expect a positive and significant effect of this variable since urban areas are known for providing a wide range of amenities for tourists, for instance health services and public transport. This variable is drawn from the population census data compiled by INEGI. Additionally, I control for the transport infrastructure within the country by using the log of the number of kilometers of roads available in state i during year t. The data are from the Transportation and Communications Ministry of each state. These statistics are as well provided to INEGI and form part of the statistical yearbooks of each state too. I would expect a positive and significant effect of this variable on the arrivals of tourists. Once in the country, tourists might be willing to visit other cities or towns near to their first destination. It is true that some tourists would prefer to use air transportation. However, there is not much variation trough time in the number of airports in each state.
Endogeneity
It can potentially be the case that the number of tourists visiting a country originates more crime. Tourists are new to the destination they visit; this lack of information puts them in a riskier situation more easily than local people. Thus, criminals may see in them an easier prey. This applies to both national and international tourists. Moreover, while I am not aware of any variable which at the same time exerts any form of variation in the number of tourist arrivals and the number of homicides and is omitted from my specification, in general, the endogeneity problem in an econometric model can not only be due to the reverse causality as outlined above but also due to third omitted variables which affect both of the variables involved.
In order to account for potential endogeneity I employ a Two Stage Least Squares (2SLS) model. The validity of an estimation based on this method relies on the choice of a proper instrument. The instrumental variable must fulfil two criteria. The first one refers to the relevance of the instrument, i.e., it must induce sufficient exogenous variation in the explanatory variable in question, in particular,
I propose the use of two instruments in an attempt to control for endogeneity in the model: The first instrument is the adult illiteracy rate within the population older than 15 years across the 31 Mexican states and México City. The data come from the Ministry of Education of México. This variable is intended to be a proxy for social exclusion. The rationale here is that social exclusion directly affects the increase in violent outcomes. For instance, the work by Caldeira (2000); Heinemann and Verner (2006), Borjas (1995); Katzman (1999), Buvinic, Morrison and Orlando (2002) and Beato (2002) show that socially excluded communities have higher illiteracy rates, higher numbers of homicides, higher percentages of employment in the informal sector and higher child mortality. Following on this, illiteracy impedes the opportunities for participation in the labour market and thus reduces the income of individuals and their chances to be included in society. For instance, using data from two groups of British adults born in 1958 and 1970, Parsons (2002) found a significant association between repeated offending and poor literacy or numeracy scores, particularly among young men.
In addition to these arguments, the work by Lochner and Moretti (2004) states that education may affect crime in several ways. First, it increases the wage rate of individuals, thereby increasing the opportunity cost of committing a crime. Second, if arrested, the punishment would be more costly for the more educated than for the less educated, i.e., the time out of the labor market due to incarceration represents a higher opportunity cost for those educated. They find that education significantly reduces crime. Based on this, it is reasonable to expect that illiteracy exerts variation in the homicide variable. On the other hand, there is no reason to suspect that illiteracy is directly correlated with the dependent variable, i.e., tourists arrivals, in particular when controlling for economic welfare in the estimation. As outlined in the second section of the paper, tourism demand is influenced by different factors than illiteracy.
The second instrument is a proxy for the severity of punishment of committing a homicide. According to Becker´s model of crime and punishment (Becker 1968) an individual would compare the expected utility of participation in legal and illegal activities. If punishment is more severe, it follows that the cost of deviating from “good behavior” is higher and the crime rate is reduced. Thus, such a variable would induce a direct variation in the homicide rate but does not directly influence the arrival of tourists. Following this literature, I construct a variable which proxies for the severity of punishment by calculating the rate of incarceration of people who have committed a homicide across the Mexican States and México City within the period 1990-2010. For this aim I use the data coming from INEGI. This dataset registers the criminals who have been arrested on charges of homicide and who have been dictated an imprisonment sentence. Thus I divide the number of imprisoned persons with sentence in state i at time t by the amount of homicides which took place in state i at time t and multiply this by one hundred. There is an important point to make here: It could be that more homicides lead to a higher incarceration rate, however the number of imprisonment sentences depends on the quality of the judiciary system and thus an increase in homicides does not necessarily mean that the incarceration rate will increase as well. The judiciary system in each country is responsible for effectively punishing those individuals who have committed a homicide. However, as documented in the media13 and in the literature, impunity is a rampant problem of the judiciary Mexican system and the incarceration of innocent people is not an exception, (Zepeda 2004). Furthermore, as documented by the UDLAP Global Impunity Index GII-(2017), the correlation between the number of individuals incarcerated for homicide and reported homicide cases in México is low. This is a strong argument in support of the relevance condition for this instrument together with the validity tests for the instruments presented and discussed in next section. Additionally, there is no reason to expect that tourists base their decision to visit México depending on how many people get incarcerated due to homicides throughout the country.
Empirical results
Table 1 presents the baseline results capturing the effect of homicides on the arrival of overall tourists, international tourists and national tourists implementing the model outlined above.14 Beginning with column 1 in table 1, the results show that, when using the homicide data from INEGI and holding other factors constant, a one percent increase in homicides leads to 0.12 percent decrease in tourism, at the 5% significance level. It is interesting to ask whether this effect is similar or not for international and national tourists. I expect that international tourist are more deterred by violent crime than national tourists. The latter have more information about what is happening in the country. Thus, they have the advantage of better knowing where violence is worst and where not. The former receive the information about crime in México through the international news. When a criminal event of high impact takes place, this is promptly communicated in the international media. Following on this, the countries of origin of the international tourists warn their people not to visit certain places in the country or better to choose completely other destinations for holiday. In order to consider this, column 2 shows the effect of violent crime/ homicides on the arrival of international tourists. When holding other factors constant, a one percent increase in homicide leads to a 0.31 percent decrease on the international tourist arrivals. This effect is significant at the one percent level. It is interesting to see that the effect of violent crime on international tourism is bigger than tourism in general. Next, I look at whether this effect is the same or not for national tourists. This is done in column 3 which shows that, holding other factors constant, the effect of homicides on national tourist arrivals is a significant decrease of 0.9 percent at the 10% significance level. In general this first table of results shows that violent crime actually deters both types of tourists however this effect seems to be stronger for the international visitors.15
Table 1. Tourist Arrivals, Total, International and National (1990-2010): State fixed Effects estimations
| (1) | (2) | (3) | |
| Variables | Tourists Arrivals: Total | Tourists Arrivals: Foreign | Tourists Arrivals: National |
| LDV (log) t-1 | 0.580*** (0.0629) | 0.474*** (0.0860) | 0.635*** (0.0521) |
| Homicide (log) | -0.123** (0.0570) | -0.307*** (0.105) | -0.0944* (0.0537) |
| Price level | -0.0265 (0.0225) | -0.0424 (0.0410) | -0.0336* (0.0194) |
| State per capita GDP (log) | 0.0187 (0.318) | 0.490 (0.550) | -0.0161 (0.300) |
| Urbanization | 0.0282** (0.0126) | 0.0603** (0.0268) | 0.0296** (0.0113) |
| Storms | -0.0293 (0.0415) | -0.0357 (0.0809) | -0.0338 (0.0391) |
| Roads (log) | -0.00795 (0.0826) | -0.133 (0.220) | 0.0183 (0.0777) |
| Constant | 5.038** (1.825) | 3.631 (3.389) | 3.960** (1.776) |
| Hausmant test p > chi2 | 0.00 | 0.00 | 0.00 |
| Year and State dummies | YES | YES | YES |
| Number of States | 31 | 31 | 31 |
| Number of Observations | 497 | 492 | 494 |
| R-squared | 0.535 | 0.326 | 0.603 |
| Method | Fixed Effects | Fixed Effects | Fixed Effects |
Robust standard errors clustered by state in parentheses *** p<0.01, ** p<0.05, * p<0.1
Source: Own elaboration
Relying on these results, it is not possible yet to give a definitive answer to the research question of the paper. According to Nickell (1981) and Hsiao (1986), in a short fixed effects panel model, the correlation between the error term and the lagged dependent variable may render the estimates of the parameters biased and inconsistent. This issue is quite serious in panel data sets with a small number of time series observations. Increasing the number of units would not lead to better estimates if the number of time series observations remains small (Anderson and Hsiao, 1982). In order to obtain consistent estimators, one possibility could be to implement instrumental estimators. Nevertheless it is important to note that, although GMM and IV estimators possess good asymptotic properties, these estimators are still biased in a finite sample application, when n is small, (Bruno 2005a, 2005b).
Kiviet (1995 and 1999) introduced a method for implementing the corrected Least Square Dummy Variable (LSDVC) for balanced panels. Bruno (2005a) generalizes the bias approximation of Bun and Kiviet (2003) and extends the analysis for unbalanced panels. If the panel is unbalanced and
The bias-correction procedure involves consistent estimates as a first step. These consistent estimates are based on one out of the three following estimators, namely the Anderson-Hsiao, Arellano-Bond and Blundell-Bond estimators. I choose the Blundell-Bond (1998) system GMM estimator since it is superior with respect to the other two in terms of efficiency (Baltagi 2008).16 Table 2 presents the results of the model when implementing the Dynamic Bias Corrected Estimator (henceforth LSDVC) proposed by Bruno (2005a, 2005b).
Table 2. Tourist Arrivals, Total, International and National (1990-2010): Dynamic Bias Corrected Estimator
| (1) | (2) | (3) | |
| Variables | Arrivals: Total | Arrivals: Foreign | Arrivals: National |
| LDV (log) t-1 | 0.697*** (0.0483) | 0.567*** (0.0515) | 0.730*** (0.0461) |
| Homicide (log) | -0.118* (0.0678) | -0.295** (0.134) | -0.0896 (0.0673) |
| Price level | -0.0317 (0.0276) | -0.0485 (0.0512) | -0.0383 (0.0329) |
| State per capita GDP (log) | 0.101 (0.405) | 0.481 (0.645) | 0.0977 (0.333) |
| Urbanization | 0.0332* (0.0201) | 0.0662* 0.0338 | 0.0355* (0.0193) |
| Storms | -0.0124 (0.151) | -0.0278 (0.0957) | 0.0302 (0.0506) |
| Roads (log) | 0.0124 (0.151) | -0.108 (0.296) | -0.0457 (0.130) |
| Year and State dummies | YES | YES | YES |
| Number of States | 31 | 31 | 31 |
| Number of Observations | 497 | 492 | 494 |
| Method | LSDVC | LSDVC | LSDVC |
Bootstrapped standard errors in parentheses *** p<0.01, ** p<0.05, * p<0.1
Source: Own elaboration
The estimates of homicides coefficients in table 2 are similar in magnitude to the previous Fixed Effects specification. Looking at the first column and keeping all other variables constant, a one percent increase in homicides leads to a reduction of 0.12 percent in the arrivals of tourists in general; this is statistically significant at the 10% level. Further, column 2 shows the results for the foreign tourist arrivals specification. In this model a one percent increase in homicides results in fewer arrivals of foreign tourists by 0.30 percent, all else equal. This result is similar to its corresponding Fixed Effects version in Table 1. However, the result under the LSDVC estimator is significant only at the 5% level. Until this point the results in table 2 are similar to those in table 1. Looking next at column 3, and contrary to the Fixed Effects specification, the arrivals of national tourists seem not to be affected by violent crime since the significance of the violent crime variable disappears in this model. Thus, violent crime has a bigger negative effect on the arrival of international tourists than on the arrival of national tourists.17 As previously mentioned, this can be due to information asymmetries in the sense that national tourists might be better informed than the international tourists and thus, they may be less concerned about high criminality in states in general as long as they know how to avoid risky situations.
With respect to the control variables, table 1 shows that prices matter for the local tourists only. We see that, holding other factors constant, a one percent increase in the price level reduces the arrivals of national tourists by 0.3 percent. In contrast, price levels are not a significant determinant of international tourism flows. Most of the international tourists visiting México are coming from the United States, Canada and European countries belonging to the European Monetary Union. It could be argued that since the international tourists possess a higher purchasing power, prices are more a concern for local tourists. However, this effect is only significant at the 10% level. Furthermore this variable is no longer significant in table 2.
Arguably, the higher the concentration of people in cities, the higher are the victimization rates of crimes as pointed out by Gaviria and Páges (2002) in their study on Patterns of crime victimization in Latin American cities. However, cities not only have problems but also advantages as agglomeration of services and amenities which are attractive for tourists. Thus, holding other factors constant, a one percent increase in the share of people living in urban areas leads to a 0.3 percent increase in the arrival of tourists. This effect is significant at the 5% level in table 1 under the fixed effects specification. Table 2 shows for this variable a coefficient of 0.033 percent, at a significance level of 10%. Additionally, international tourists are more attracted to urban areas than national tourists. This is consistent in both tables.18 However the LSDVC estimations show significance at the 10% level for both types of tourists and tourists in general. Finally, I expect path dependence in tourist arrivals, i.e., past arrivals of tourists explaining a part of today´s arrivals. For instance, if visitors of a certain location have an enjoyable experience during their stay, they might visit the same location or country again in the future. They may also influence other fellow citizens when they return back to their place of residence by recommending places to visit. We see in tables 1 and 2 that past tourist arrivals do matter for today´s arrivals. These results remain significant at the 1% level for international and national tourists and both together. Interestingly, I do not find any effects of per capita GDP, storms and highways.
So far the LSDVC estimator has taken into account the bias inherent in the model due to the inclusion of the lagged dependent variable. However there is still a further issue to be dealt with, namely the potential reverse causality of the variables tourism and homicides. Since the dynamic bias-corrected estimator does not account for this problem,19 as a next step I present in table 3 the results of the 2SLS estimation with state and time fixed effects using the external instruments introduced in the previous section.
Table 3. Tourist Arrivals, Total, International and National (1990-2010): Fixed Effects 2SLS estimations (Instruments: Illiteracy rate and Imprisonment rate due to homicide)
| (1) | (1a) | (2) | (2a) | (3) | (3a) | |
| Variable | Total Arrivals | First stage regression | Foreign Arrivals | First stage regression | National Arrivals | First stage regression |
| Homicide (log) | Homicide (log) | Homicide (log) | ||||
| Dependent Variable- (log) t-1 | 0.569*** (0.0549) | -0.071 (0.0488) | 0.478*** (0.0808) | -0.063** (0.0299) | 0.623*** (0.0475) | -0.071 (0.0499) |
| Homicide (log) | -0.218** (0.0901) | -0.241 (0.2021) | 0.207** (0.0886) | |||
| Illiteracy | 0.0149*** (0.0305) | 0.147*** (0.0312) | 0.144*** (0.0302) | |||
| Imprisonment rate | -0.004*** (0.0011) | -0.004*** (0.0011) | -0.004*** (0.0011) | |||
| Price level | -0.031 (0.0216) | -0.017 (0.0237) | -0.046 (0.0382) | -0.015 (0.0244) | -0.0381*** (0.0193) | -0.018 (0.0248) |
| State per Capita GDP (log) | 0.132 (0.3098) | -0.049 (0.5019) | 0.612 (0.5023) | 0.021 (0.4885) | 0.0832 (0.288) | -0.025 (0.4964) |
| Urbanization | 0.029** (0.0122) | 0.039* (0.0205) | 0.057** (0.0269) | 0.042 (0.0200) | 0.0310*** (0.0108) | 0.039* (0.0206) |
| Storms | -0.029 (0.0394) | -0.011 (0.0320) | -0.038 (0.0759) | -0.008 (0.0329) | -0.033 (0.0369) | -0.011 (0.0326) |
| Roads (log) | -0.016 (0.0741) | 0.062 (0.0925) | -0.100 (0.1911) | 0.060 (0.0938) | -0.00029 (0.0722) | 0.056 (0.0948) |
| F-statistic | 22.51 | 21.51 | 21.82 | |||
| Hansen J (p-value) | 0.8827 | 0.1904 | 0.8187 | |||
| Kleibergen Paap LM test | 11.71 | 11.14 | 11.27 | |||
| Endogeneity test (p-value) | 0.3462 | 0.9893 | 0.2376 | |||
| Year and State Dummies | YES | YES | YES | YES | YES | YES |
| Number of States | 31 | 31 | 31 | 31 | 31 | 31 |
| Number of Observations | 494 | 494 | 489 | 489 | 491 | 491 |
| R-squared | 0.5309 | 0.5802 | 0.3273 | 0.5837 | 0.598 | 0.5793 |
| Method | FE-2SLS | FE-2SLS | FE-2SLS | FE-2SLS | FE-2SLS | FE-2SLS |
Robust standard errors clustered at the state level in parentheses ***p<0.01, **p<0.05, *p<0.1.
Source: Own elaboration
Table 3 reports the results for the second stage regressions followed by the first stage regressions for each of the three subsamples; namely total of tourists, international tourists and national tourists. In order to obtain the instrumental variable estimation, I regress the variable homicides on tourist arrivals and all other regressors at the first stage. In this way the predicted values of homicides are obtained which then enter into the second stage regression to obtain an unbiased estimator for the homicide variable. If it happens to be the case, the weakness of the instruments will render the coefficient of the homicide variable biased. By the same token, this bias will be negatively correlated with the first stage F-statistic of the null hypothesis that the coefficients of the instruments (illiteracy rate and incarceration rate) equal zero. Staiger and Stock (1997) argue that in order to avoid this problem the first stage F-statistic should show a value larger than 10. As can be seen at the bottom of table 3, the models show an F-statistic of 22.51, 21.51 and 21.82 for the three tourists specification categories, rejecting in this way the null hypothesis that both of the selected instruments are not relevant. The Kleibergen-Paap underindentification LM test rejects as well this null hypothesis with test scores of 11.71, 11.14 and 11.27 suggesting that the implemented instruments are adequate to identify the equation. Furthermore, the Hansen J-statistic with p-values of 0.88, 0.19 and 0.81 shows that the null-hypothesis of exogeneity cannot be rejected at the conventional level of significance.
Column 1 of table 3 shows that, keeping all other variables constant, a one percent increase in homicides leads to a 0.22 percent decrease of tourism as a whole. This effect is significant at the 5% level. Furthermore, the first stage regression of the first model, displayed in Column 1a, shows that an increase in the illiteracy rate by one percentage point increases homicides by 0.16 percent, all things else hold constant. This result is significant at the 1% level. In this way, illiteracy as a proxy for social exclusion causes violent crime to increase. Next, if the incarceration rate due to homicides increases by one percent, violent crime is reduced by 0.004 percent. This effect is statistically significant at the 1% level.
Interestingly, as column 2 shows, there is no significant effect of homicides on the arrival of international tourists. However, the endogeneity test for all three models at the bottom of table I3 shows that the null hypothesis of exogeneity of the homicides variable cannot be rejected (with p-values of 0.35, 0.99 and 0.24). According to this test there is no reverse causality going from tourism to homicides. In this sense, the results of the LSDVC Bruno estimator provide the preferred estimation since this method is superior to the (2SLS) fixed effects estimation which does not control for the Nickell (1981) bias inherent in the lagged dependent variable.
Conclusion
This paper has investigated whether there is an effect of violent crime on tourism in México for the 1990-2010 period. The contribution of the paper is twofold. First, addressing endogeneity the paper finds that the impact of violent crime on tourism in México is negative and significant. Second, this paper investigates whether international tourists or local tourists are more affected by violent crime. Due to the lack of data, previous research has concentrated only on the analysis of international tourism flows. First, my findings show that tourist arrivals in Mexican states are reduced by increased violent crime. Second, international tourists appear to be more intimidated by violent crime than local tourists. As argued in previous research by Morley (1998) and Clerides et al. (2008), information asymmetries play a role in tourism demand. Thus by living in the country, local tourists know better where crime is higher than international tourist do. For instance, an average Mexican would certainly know that violent crime is less in the state of Guanajuato than in the state of Tamaulipas or any other state in the north border to the United States. On the other hand, international tourists obtain information mainly throughout the news. Despite these information asymmetries, Braakmann (2009) shows that the inhabitants of México have changed their behavior in response to crime. He finds that women prefer to change their way to their jobs and men are more prone to carry a weapon. This shows that, it is not that Mexicans became accustomed to live in violence but rather they react to the criminal environment by taking protective measures.
In terms of tourism policy, the findings suggest that better information and promotion of tourism in México abroad could positively affect the image of the country itself. Indeed, the Mexican Federal government promotes tourism in México abroad. Further studies might look at whether these tourism promotion investments have been effective by using impact evaluation techniques as for instance Difference in Differences estimation. Moreover, it would be important for tourism policy to know whether tourists move to different locations in order to avoid dangerous regions.
The time span of the paper is one of its main limitations. Due to data availability, it is only possible to build up the panel data set for all Mexican states and México City up to the year 2010. For several control variables data are not yet available. Examples of these variables are recent data on GDP and data derived from the not yet available 2020 census. Furthermore, the panel data results presented here show only average effects at the state level. The paper is not able to look deeper into more disaggregated data at the municipal level since these data are not available. Data disaggregation is relevant since not all regions of the country experience crime in the same way and not all regions in the country are tourism destinations. Further research might look at the relationship tourism and crime using municipal or county level data.
Finally yet importantly, the study of how crime impacts tourism in México can better be determined if more disaggregated data on tourism and crime at the municipal are available.