


 nova página do texto(beta)
 Inglês (pdf)
 Artigo em XML
 Referências do artigo
 Enviar este artigo por email
 Citado por SciELO
  Similares em
SciELO
Similares em
SciELO 
 Permalink
Introduction
One of the most important requirements for planning the economic development of developing countries is to be able to promote different economic sectors appropriately to contribute most effectively toward solving social, economic and other related problems. It is highly crucial that this issue be considered because the pace of development is often constrained by the resources available for development. This situation implies that not all economic sectors can be promoted equally. A sound and appropriate development strategy that focuses on the promotion of efficient and prospective production sectors is therefore required to achieve the intended development goals (Sudaryanto, 2000).
The Mexican economy, like economies in other parts of the world, must address the new realities, challenges, and opportunities presented by the globalization of business activities. Currently, Mexico is the 14th largest economy in the world and the second largest in Latin America (IMF, 2011). Mexico is the 11th most populous country, with 112.3 million inhabitants (INEGI 2010 Census), and actively participates in world trade. It is the 10th largest exporter and importer worldwide and accounts for 2.5% and 2.6% of the world’s total exports and imports, respectively (World Trade Report WTO, 2011).
Firms, industries and entire sectors operating within the Mexican economy have experienced varying degrees of success in coping with the competitive global economic environment. Therefore, investors and policy-makers must assess economic performance in a relatively new context.
The relative performance of sectors within a given economy can be assessed using different types of traditional methods. It is important to select a method that is systematic, practical and proven. Such an evaluation method should be multicriteria in nature because of the multidimensional nature of economic and business performance. Additionally, the selected evaluation method should be useful for the decision-making process. Thus, it should have practical implications and yield implementable action plans. This study utilizes a multicriteria-based method to assess the relative performance of key economic sectors in Sinaloa, a state located in the northwest of Mexico.
The Multicriteria Decision Aiding (MCDA) methods are motivated by the fact that real-world decision making problems have become increasingly more complex and should not be addressed using only unidimensional approaches. However, when using a more realistic approach, the policy-maker must aggregate multiple key factors. The purpose and the scope of MCDAs is to support decision makers while addressing complex decision-making problems. MCDAs are not the only field of study that involves the integration of multiple factors. The statistics techniques related to multivariate analysis and nonparametric techniques, such as neural networks, machine learning, fuzzy sets and rough sets, also involve the aggregation of multiple factors for decision-making purposes. However, the distinguishing feature of MCDAs is their emphasis on supporting the decision instead of only using the decision model. Thus, the MCDA approach focuses on aspects of the development of models that relate directly to the representation and modeling of the preferences, judgments and values of the decision maker.
Multicriteria-based methods have been widely used in many real-world decision problems in areas such as agriculture, environment and water management, finance, project selection, personnel recruiting and transportation, among others (Figueira et al., 2010). The theoretical rigor and robustness of such methods and their advantages compared with traditional methods are well documented (Bouyssou et al., 2000; Figueira et al., 2005; Klir and Yuan, 1995). In recent years, multicriteria-based methods have been employed to assess the performance of economic sectors and have yielded decision-making and problem-solving implications (e.g., Sudaryanto, 2000; Augusto et al., 2005; Balezentis et al., 2012). However, such applications are still limited in number and scope. This relatively small number of applications is interesting because multiple-criteria methods can be adapted to the economic and social sciences (Treadwell, 1995).
This study utilizes a multicriteria approach to construct an aggregation model of preferences and then a multiobjective evolutionary algorithm to exploit the model to rank the performance of economic sectors of the Sinaloa economy. While such an application has practical implications, the method has not yet been sufficiently developed. The proposed multicriteria approach utilized in this study is simple. Furthermore, it can treat uncertainty well. Unlike traditional ranking methods, the proposed method is rigorous and yields a robust solution. Insights gained from this applied research have practical implications for policy-makers and investors. This study also contributes to an important, yet relatively new, body of economic application-based literature that concerns a multicriteria, and multiobjective evolutionary approach to decision-making.
This paper is organized as follows: the second section presents a brief description of the relevant literature concerning the performance of economic sectors. The third section describes a study and focuses on the procedure and method used. The fourth section describes a sensitivity analysis of the final result. The fifth section presents results and a brief discussion. The final section presents concluding comments.
Literature review
Most social, economic, biological and environmental systems are complex in nature; therefore, measuring their performance is a complex and difficult task (Augusto et al., 2005). Thus, economic sectors are not easy to compare. In practice, several approaches can be used to measure the performance of economic systems. These approaches include multiple criteria optimization (Steuer, 1986), multiple attribute decision theory (Keeney and Raiffa, 1993) and multicriteria decision aiding (Roy, 1996).
Fuzzy set theory (Zadeh, 1965) is also significant in the social sciences and humanities because it can treat ambiguities, uncertainties, and vagueness that cannot be treated by methods that use crisp values. Balezentis et al. (2012) presented an integrated assessment of Lithuanian economic sectors based on financial ratios and fuzzy Multicriteria Decision Making (MCDM) methods. Three fuzzy MCDM methods were applied in this study: VIKOR (Kaya and Kahraman 2011), TOPSIS (Yu and Hu, 2010), and ARAS (Turskis and Zavadskas, 2010).
In another context, it has been widely recognized that the concept of inter-sectoral linkages significantly aids in understanding the internal structure of the economy, which is highly crucial when determining the role of sectors. According to Hirschman (1958), inter-sectoral linkages are significant for initiating and transmitting the process of economic development and diversifying the sectoral structure of the economy.
The linkage approach provides valuable insight into the interdependence of different sectors of an economy and, more importantly, it is very useful if it is applied to empirically identify key sectors as potential areas for achieving more economic growth (McGilvray, 1978). The identification of a key sector is motivated by the need to prioritize when allocating resources to sectors, which is very commonly involved in and closely linked to economic development planning. Sectors can be clustered into different groups based on their degree of linkages, which can be further used as a basis for assigning sectoral priority. Dhawan and Saxena (1992) and Alauddin (1986) use this type of approach to identify key sectors in the Indian and Bangladesh economies, respectively.
Various methods designed for measuring linkages have been developed. The methods are primarily designed to identify the so-called ‘strategic’ or ‘key’ sectors of the economy.
Regardless of the method or procedures used to identify key sectors, the explicit determination of sectoral linkages using an input-output technique is always involved. According to Hewings (1982), the linkage approach is the most commonly accepted method for the determination of the key sectors of an economy. However, it is also very frequently argued that the linkage approach is too simple and too crude to be used as an empirical method for the identification of the key sectors of an economy because of inherent limitations that can seriously affect the empirical results. In general, the existing methods consider only the degree of inter-sectoral linkages and disregard other relevant criteria that correspond to sectoral performance.
Other approaches for the identification of the key sectors of an economy are the following, Díaz and Morillas (2012) presented a review of results about some works where they applied fuzzy logic to economics, including an application related to Spanish key sectors, fuzzy industrial clustering and multivariate outliers. Dietzenbacher and Lahr (2013) proposed a generalized hypothetical extraction method and they made two applications using data from the 2006 US economy. In the same sense, Cardenete et al. (2013) extended the hypothetical extraction methodology to a Computable General Equilibrium which was applied using a Spanish Social Accounting Matrix. Humavindu and Stage (2013), by using input-output analysis and a Social Accounting Matrix, presented a research of key sectors in the Namibian economy. Tounsi et al. (2013), by using input-output analysis and the Unweighted Rassmussen Approach, performed the sectors of the Moroccan economy via the intensity of their links with other sectors. Oliva et al. (2014) extended the concept of component importance measures to the study of industry criticality in a larger system of economically interdependent industry sectors and they developed measures of impact analysis to those industries. The proposed work provided an approach to rank industries according to fuzzy indices. Also, an application was driven by them using data from the US Bureau of Economic Analysis.
As the development approach shifts from focusing on growth toward sustainable development, the relevance of the conventional methods for key sector identification becomes questionable because of their over-simplified manner of representing the situation. Consequently, the linkage measure should no longer be the only criterion considered when defining key sectors of the economy. The danger of applying these conventional approaches is evident because they may yield a counter-intuitive decision that contradicts the intended goals and thus may misguide future economic development policy.
To adapt to the concept of sustainable development, the notion of key sectors should refer to sectors of the economy that satisfy the predetermined criteria associated with the desired development goals. Considering the complexity and comprehensiveness of the problem, the most appropriate procedure for the identification of key sectors is a multicriteria decision making model. Then, key sector identification can be considered a problem of selecting or ranking sectors that meet the predetermined criteria that correspond to the intended development goals. In this context, Sudaryanto (2000) described the application of a fuzzy multi-attribute decision-making model for the empirical identification of the key sectors of the Indonesian economy. Díaz et al. (2006) presented a fuzzy clustering approach to identify the key sectors of the Spanish economy. Furthermore, Misinas (2010) analyzed the performance of Lithuanian economic sectors using financial analysis.
As demonstrated in previous studies (Xidonas, Psarras 2009; Xidonas et al., 2009, 2010), the application of multicriteria decision making methods significantly improves the robustness of financial analysis and business decisions. Balezentis et al. (2012) proposed a method of inter-sectoral comparison based on financial indicator analysis that uses multicriteria decision aiding methods.
The study
Research framework
A decision-aiding method is only relevant for decision processes that involve decision makers. In this paper, we will focus our attention on the set of activities (steps) occurring within such a setting. Tsoukias (2007) called such a set of activities a “decision aiding process”. The ultimate objective of this process is to arrive at a consensus between the decision maker and the analyst. The decision maker has domain knowledge concerning the decision process. In contrast, the analyst has methodological, domain-independent knowledge. Given the decision maker’s domain knowledge and the analyst’s methodological knowledge, the analyst must interpret the decision maker’s concerns and knowledge so that he or she can improve his or her perceived position compared with the reference decision process. Such an interpretation ought to be “consensual” (Tsoukias, 2007).
The multicriteria approach utilized in this study combines the logic of outranking models (the ELECTRE-III procedure [Roy, 1996]) with multiobjective evolutionary algorithms (MOEA) (Leyva and Aguilera, 2005), aided by the SADAGE Software (Leyva et al., 2008) to solve the ranking problem.
Configuration of the Decision Aid Process. In a systematic decision aid process, there is a continuous flow of activities between the different phases, but at any phase, there may be a return to a previous phase (this is referred to as feedback). The general scheme of the ELECTRE-III-MOEA method is schematically represented in Figure 1. A decision aiding process is not a linear process where the stages follow one another. Instead, it should be noted that the procedure is iterative rather than simply sequential. If the decision maker is unsatisfied with the result at any stage, he or she may return to any step and redo it.
Source: Own elaboration based on Leyva and Aguilera (2005).
Figure 1.General scheme of the ELECTRE-III-MultiObjective Evolutionary Algorithm
Data source
The data used in this study were obtained from a database supplied by The National Institute of Statistics and Geography (Instituto Nacional de Estadística, Geografía e Informática, INEGI, http://www.inegi.gob.mx), which performs the economic census in Mexico. The data are part of the 2009 Economic Census. Data collected in 2009 strictly refer to activities carried out between January 1st and December 31st, 2008.
The objective of the census is to obtain updated and reliable basic statistical data about establishments that manufacture goods, trade merchandise and render services to generate various detailed geographic, sectoral, and thematic economic indicators for Mexico. The census covers almost all of the economic activities that occur in Mexico except for primary activities; of the latter, only fishing and aquaculture are included in this census. The classification used for the census is the North American Industry Classification System (NAICS) 2007.
The National Economic Census of Mexico is the most complete source of information about the Mexican economy available. The economic census, which concerns every economic unit in Mexico, is the primary source of economic data for the National System of Statistical and Geographical Information and the basis for the development of many other economic measures, including economic surveys, Gross Domestic Product (GDP), and input-output tables, among others. The census enables planning public economic policies and performing marketing and academic research, among other activities, by providing geographically disaggregated data for each of the more than 950 NAICS activities. Table 1 presents the dominant economic sectors in Sinaloa, Mexico.
Table 1 Dominant economic sectors in Sinaloa, Mexico
| Sector code (alternative) | Economic sector |
|---|---|
| A 1 | 21 (212) Mining (except Oil and Gas) |
| A 2 | 22 Utilities (Electricity, Water and Gas Distribution to Final Customer) |
| A 3 | 23 Construction |
| A 4 | 31-33 Manufacturing |
| A 5 | 42 Wholesale trade |
| A 6 | 44-45 Retail trade |
| A 7 | 48-49 Transportation and Warehousing |
| A 8 | 51 Information |
| A 9 | 52 Finance and Insurance |
| A 10 | 53 Real Estate and Rental and Leasing |
| A 11 | 54 Professional, Scientific and Technical services |
| A 12 | 55 Management of Companies and Enterprises |
| A 13 | 56 Administrative and Support and Waste Management and Remediation Services |
| A 14 | 61 Educational services |
| A 15 | 62 Health Care and Social Assistance |
| A 16 | 71 Arts, Entertainment, and Recreation |
| A 17 | 72 Accommodation and Food Services |
| A 18 | 81 Other Services (except Public Administration) |
Note: Numbers in Economic sector column are the classification numbers used for the census correspond to the North American Industry Classification System (NAICS).
Source: (INEGI,2010).
Criteria
The criteria used to rank the economic sectors are primarily economic. The criteria used in this study are reported in Table 2. These criteria are designed to capture the multidimensional nature of the performance of the studied sectors. These criteria include the following, where the last six are expressed in millions of Mexican pesos in Table 2:
Number of employees
Remunerations
Total gross production
Intermediate consumption
Gross fixed capital formation
Gross value added
Total fixed assets
Note: Numbers in Economic sector column are the classification numbers used for the census correspond to the North American Industry Classification System (NAICS).
Source: (INEGI, 2010).
Table 2 Values of the criteria for each economic sector
These criteria are the variables under study of the 2009 economic census of Mexico.
Table 2 reports the values of the criteria for sector. The results in Table 2 underscore the differences that exist among the studied sectors based on the different measures used. Figure 2 presents the profiles of two sectors as examples of the profile derived for each sector.
Procedure and Methodology
Multiple factors motivated the selection of the ELECTRE-III method for the assessment of the performance of the economic sectors of Sinaloa, Mexico.
First, Leyva and Aguilera (2005) presented a MOEA to exploit a valued outranking relation, but it is interesting to demonstrate the functionality of the combination of ELECTRE-III and MOEA to a real-world application. This method was systematized using the SADAGE software (Leyva et al., 2008) (see Figure. 3), which was used to analyze the problem addressed in this study.
Second, there exist a set of discrete alternatives and a set of economic dimensions that can be easily converted into a set of criteria. Additionally, the problem type addressed in this study can be modeled as a ranking problem. Based on the literature, the ELECTRE family of methods is considered appropriate for addressing a problem type such as the one addressed in this study (see Roy, 1996). This is especially true for the ELECTRE-III method.
Third, ELECTRE was originally developed by Roy to incorporate the fuzzy (imprecise and uncertain) nature of decision-making by using thresholds of indifference and preference. This feature is appropriate for solving this problem.
Fourth, the decision maker is required to assign numerical values to the inter-criteria parameters associated with the different criteria (Roy, 2006).
Fifth, another feature of ELECTRE that distinguishes it from many multicriteria solution methods is that it is fundamentally non-compensatory. This means that good scores on some criteria cannot compensate for a very bad score on a different criterion.
Finally, another feature is that ELECTRE models allow incomparability. Incomparability, which should not be confused with indifference, occurs between some alternatives a and b when there is no clear evidence in favor of some type of preference or indifference.
Two important concepts that underline the ELECTRE approach, thresholds and outranking will now be discussed. Assume that there exist defined criteria g j ,j=1, 2…r and a set of alternatives A. Traditional preference modeling assumes that the following two relations hold for the two alternatives a, b ϵ A:
In contrast, the ELECTRE methods introduce the concept of an indifference threshold, q; then, the preference relations are redefined as follows:
Whereas the introduction of this threshold partially accounts for how a decision maker actually feels when making real comparisons, a problem remains. Namely, there is a point at which a decision maker changes from indifference to strict preference. Conceptually, it is justified to introduce a buffer zone between indifference and strict preference that corresponds to a decision maker hesitating between preference and indifference. This zone of hesitation is referred to as weak preference; it is also a binary relation like P and I above and is modeled by introducing a preference threshold, p. Thus, we have a double threshold model with an additional binary relation Q that measures weak preference:
The choice of thresholds intimately affects whether a particular binary relation holds. Although the choice of appropriate thresholds is not easy, in most realistic decision-making situations, there are good reasons for choosing non-zero values for p and q.
Note that we have only considered the simple case where thresholds p and q are constants instead of functions of the values of the criteria; the latter is the case of variable thresholds. While the simplification of using constant thresholds aids the utilization of the ELECTRE method, it may be worth using variable thresholds in cases where criteria with larger values lead to larger indifference and preference thresholds. In this study, a government official acted as the decision maker and the authors of this paper acted as the analyst. Table 3 reports the indifference and preference thresholds for the criteria used in this study. The veto threshold was not considered.
Table 3 Indifference (q) and preference (p) threshold values
| Label | Criterion (g j ) | Indifference (q j ) | Preference (p j ) |
|---|---|---|---|
| g 1 | Number of employees | 6000 | 14000 |
| g 2 | Remunerations | 250 | 400 |
| g 3 | Total gross production | 200 | 500 |
| g 4 | Intermediate consumption | 300 | 600 |
| g 5 | Gross fixed capital formation | 200 | 400 |
| g 6 | Gross value added | 250 | 500 |
| g 7 | Total fixed assets | 1100 | 2100 |
Note: The last six criterions are expressed in millions of Mexican pesos.
Source: Own elaboration.
Using thresholds, the ELECTRE method seeks to build an outranking relation S. aSb means that according to the global model of decision-maker preferences, there are good reasons to believe that “a is at least as good as b” or “a is not worse than b”. Each pair of alternatives a and b is then tested to check whether the assertion aSb is valid. This yields one of the following four situations: aSb and not(bSa); not(aSb) and bSa; aSb and bSa; not(aSb) and not(bSa).
The third situation corresponds to indifference, whereas the fourth corresponds to incomparability.
The test to determine whether to accept the assertion aSb is implemented using the following two principles:
A concordance principle that requires that a majority of criteria, after considering their relative importance, are in favor of the assertion, which is referred to as the majority principle; and
A non-discordance principle that requires that of the minority of criteria that do not support the assertion, none of them is strongly against the assertion, which is referred to as the respect of minorities principle.
The operational implementation of these two principles is now discussed; where we assume that all criteria are to be maximized. We first consider the outranking relation defined for each of the r criteria, which is aS j b means that “a is at least as good as b with respect to the j th criterion”, where j=1,2,…,r
The j
th
criterion is in concordance with the assertion aSb if and only if aS
j
b, i.e., if
The j
th
criterion is in discordance with the assertion aSb if and only if bP
j
a, i.e., if
With these concepts, it is now possible to measure the strength of the assertion aSb. The first step is to develop a measure of concordance, which is quantified by the concordance index C(a, b), for every pair of alternatives a, b ϵ A. Let k j be the importance coefficient or weight for criterion j. The concordance index is defined by a valued outranking relation as follows:
where
The thresholds and weights represent the subjective input provided by the decision maker. Weights used in the non-compensatory ELECTRE model are significantly different from weights used in compensatory decision modeling approaches. Weights in ELECTRE are “coefficients of importance” and, as Vincke (1992) notes, they can be considered votes for each of the criterion “candidates.” Roger et al. (2000) reviewed existing weighting schemes for ELECTRE and provided a useful discussion of the weighting concept in ELECTRE. Care also must be taken in determining threshold values, which must relate specifically to each criterion and reflect the preferences of a decision maker. Procedures for choosing appropriate threshold values were addressed by Roger and Bruen (1998). The decision maker was assisted in defining the 7 criteria weights, which are shown in Table 4. Personal Construct Theory (PCT), as suggested by Rogers et al. (2000), was used for the weight definition.
Notes:
† RtG is the criterion’s rating and is obtained by counting every X in the row.
†† RtG RtG +1 to account for criterion 5.
§ For every cell ij, {X, O} signifies that criterion gi is {more or less} important than criterion gj.
¶ The weight for every criterion gi is obtained by dividing RtGi +1 by the total.
Source: Own elaboration
Table 4 Criteria weights
Thus far, the discordance principle has not been considered. The concordance index is a measure of the extent to which the criteria agree with the assertion that a is at least as good as b. However, what disconfirming or disharmonious evidence is there? In other words, is there any discordance associated with the assertion aSb? To calculate discordance, a further threshold, called the veto threshold, is defined. The veto threshold, , allows for the possibility of aSb to be refused if for any one criterion j,
For each pair of alternatives a, b ϵ A, there is now a concordance and a discordance measure. The final step in the model building phase is to combine these two measures to produce a measure of the degree of outranking, i.e., a credibility index that assesses the strength of the assertion that “a is at least as good as b”. The credibility degree for each pair a, b ϵ A is defined as:
This formula assumes that if the strength of the concordance exceeds that of the discordance, then the concordance value should not be modified. Otherwise, we are forced to question the assertion that aSb and modify C(a,b) according to the above equation. If the discordance is 1.0 for any a, b ϵ A and any criterion j, then we have no confidence that aSb; therefore, S(a,b)=0.0.
The input data used in the calculations are the values presented in Table 2 (the performances of the alternatives). All compared alternatives and criteria have been used in the calculation. Information about the preferences of the decision maker -namely, the values of the indifference and preference thresholds for each criterion and the values of the relative importance of the criteria- are presented in Table 3 and Table 4. The values of the relative importance of the criteria indicate that the total fixed assets (g 7) and the intermediate consumption (g 4) criteria are most important to the decision maker.
The computation has been performed on the input data (Table 2) and on the information about the preferences of the decision maker (Table 3 and Table 4) using the ELECTRE-III method. According to the additional information noted above, we applied ELECTRE-III to construct a valued outranking relation. Tables 5 shows the credibility matrix obtained.

This concludes the construction of the outranking model. The next step in the outranking approach is to exploit the model and produce a ranking of alternatives from the valued outranking relation. Our approach for exploitation is to use a multiobjective evolutionary algorithm-based heuristic method, which is explained in the work by Leyva and Aguilera (2005).
Table 5 was processed using the MOEA to derive the final ranking and systematized using the SADAGE software. The MOEA used the following parameters: the number of generations was set to 10,000; the population size was set to 40; the crossover probability was 0.85; and the mutation probability was 0.35. The restricted Pareto front,
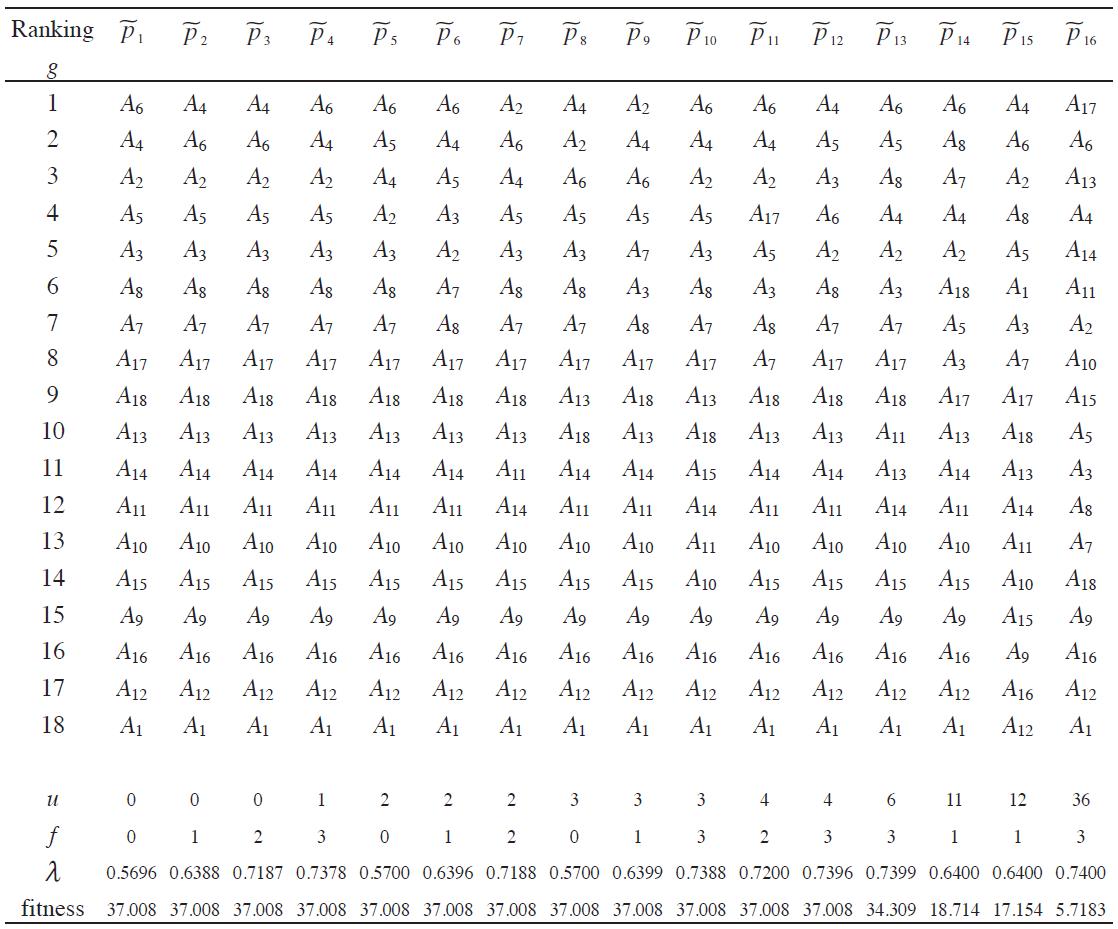
Notes:
† pi L is an individual.
†† u, f and m are the objective functions of the Multi-Objective Evolutionary Algorithm.
§ Alternatives: A1- Mining (except Oil and Gas), A2- Utilities (Electricity, Water and Gas distribution to final customer), A3- Construction, A4- Manufacturing, A5- Wholesale trade, A6- Retail trade, A7- Transportation and Warehousing, A8- Information, A9- Finance and Insurance, A10- Real Estate and Rental and Leasing, A11- Professional, Scientific and Technical services, A12- Management of Companies and Enterprises, A13- Administrative and Support and Waste Management and Remediation Services, A14- Educational services, A15- Health care and social assistance, A16- Arts, Entertainment, and Recreation, A17- Accommodation and Food Services, A18- Other Services (except Public Administration).
Source: Own elaboration
Table 6. Restricted Pareto front determined and the associated individuals of the solution space
Table 7 shows the number T(i,j),
Source: Own elaboration.
Table 7 The number of times that an alternative was found at a certain place in the ranking
Table 7 suggests the following final ranking:
The above multicriteria method was performed 50 times using the SADAGE software with the same data (performance matrix, inter-criteria parameters and MOEA parameters) to produce 50 rankings. Then, using the same procedure as in the above paragraph, we calculated the number T(i,j),
Source: Own elaboration.
Table 8 The number of times that an alternative was found at a certain place in the 50 rankings
Table 8 suggests the following final ranking:
where
We compare the recommendation obtained with ELECTRE-III-MOEA method versus PROMETHEE-II method.
The results obtained using the PROMETHEE-II method for ranking the alternatives are shown in Table 9.
Table 9 Results of the net flow score of PROMETHEE II for ranking alternatives
| Alternative | Positive outranking flow score | Negative outranking flow score | Net flow score |
|---|---|---|---|
| A 1 | 0.0000 | 0.6979 | -0.6979 |
| A 2 | 0.7314 | 0.1447 | +0.5867 |
| A 3 | 0.5373 | 0.2509 | +0.2864 |
| A 4 | 0.9390 | 0.0520 | +0.8870 |
| A 5 | 0.7297 | 0.1800 | +0.5497 |
| A 6 | 0.9427 | 0.0504 | +0.8923 |
| A 7 | 0.5561 | 0.2688 | +0.2873 |
| A 8 | 0.5266 | 0.2648 | +0.2618 |
| A 9 | 0.2258 | 0.4803 | -0.2545 |
| A 10 | 0.1259 | 0.5110 | -0.3851 |
| A 11 | 0.1066 | 0.5344 | -0.4278 |
| A 12 | 0.0000 | 0.7024 | -0.7024 |
| A 13 | 0.2113 | 0.4094 | -0.1981 |
| A 14 | 0.1366 | 0.4638 | -0.3272 |
| A 15 | 0.0641 | 0.5639 | -0.4998 |
| A 16 | 0.0248 | 0.6018 | -0.5770 |
| A 17 | 0.5754 | 0.2757 | +0.2997 |
| A 18 | 0.4129 | 0.3940 | +0.0189 |
Source: Own elaboration.
These values suggest the final ranking:
which is difficult to support.
In this ranking, we see a clear inconsistency with the global model of preferences. There is a strong argument for choosing A 4 and A 6 as the best actions. Consider the subset A UND composed of the unfuzzy nondominated alternatives (cf. Orlovski 1978):
In this case, A
UND
is not empty, , and the other alternatives do not belong to it. Moreover,
In the rankings generated by the net flow rule, we see a clear inconsistency with the global model of preferences: A 6 is strictly preferred to A 4. It is a typical case of the irrelevant alternatives effect. Obviously, the irrelevant alternatives play an important role in the relative rankings of A 6 and A 4.
Sensitivity analysis of the final result
In most cases, arriving at the final ordering accepted by the decision maker does not conclude the decision aiding process. The analyst can additionally propose performing a sensitivity analysis. Examples of employing a sensitivity analysis have also been presented elsewhere (Goicoechea et al., 1982; Rios Insua and French, 1991, Leyva 2005).
A sensitivity analysis is used to characterize the influence of changing the values of parameters, which consist of information about the decision maker’s preferences (the various methods use different parameters to reflect the decision maker’s preferences), on the final result. Sensitivity analysis is useful for interpreting results that have been achieved by modifying the values of the appropriate parameters reflecting the decision maker’s preferences and in estimating the influence of the modifications on the final result. The decision maker supplies a range of values that he considers still consistent with his preferences.
Using this input, the range of sensitivity analysis is defined. The analysis considers the following types of changes in the parameters:
changes in the values of the relative importance (w) of a single criterion,
simultaneous changes in the values of the relative importance (w) of multiple criteria,
changes of the values for threshold functions, which include the thresholds of indifference (q) and preference (p), for a single criterion, and
simultaneous changes of the values for the thresholds of indifference (q) and preference (p) for multiple criteria.
The results of the sensitivity analysis performed, which depend on the allowed range of values for the selected parameters that describe the decision maker’s preferences, are presented in Table 10 (the arrangement of the originally agreed-upon input values for all parameters can be found in Table 3 and Table 4).
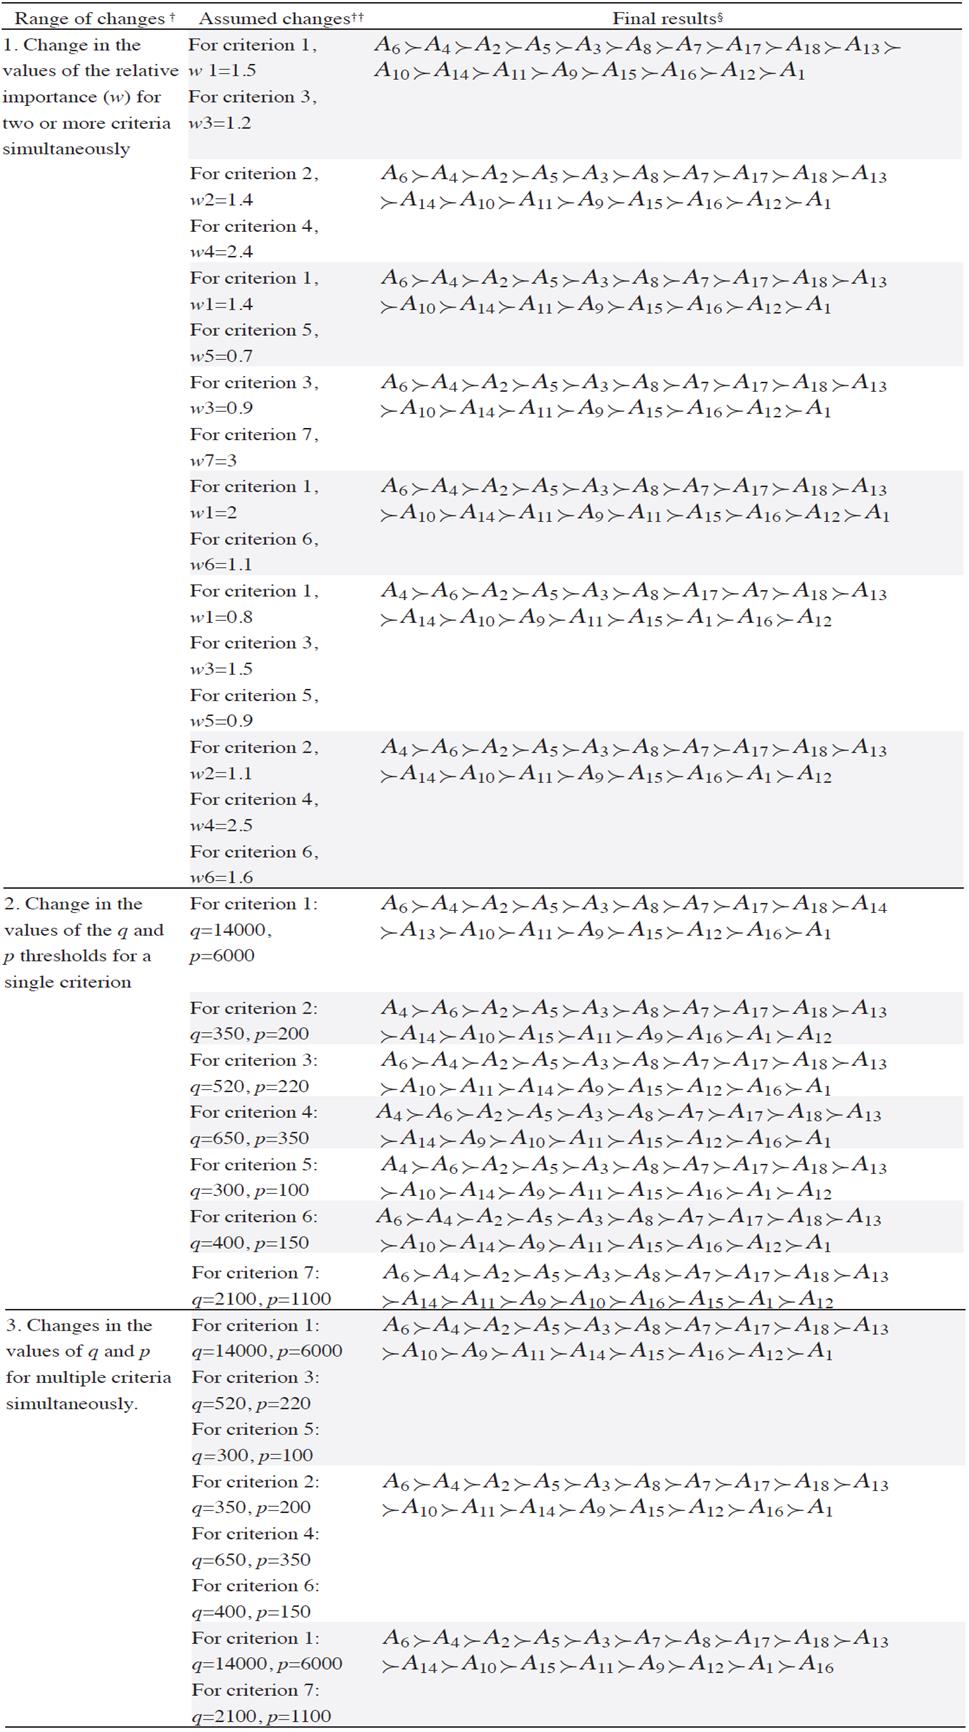
Notes:
† Range of changes of specific parameters related to the decision maker’s preferences.
†† Assumed changes in parameter values.
§ Final results after the changes in parameters have been introduced.
Source: Own elaboration
Table 10 Influence of changes in specific parameters and changes in values of the chosen parameters in the final result
Changing the values of the relative importance of a criterion, w, had the least influence on the final order of alternatives. Of the 17 cases in which changes were introduced, in the majority of the cases, the final result typically preserved the final ranking selected by the decision maker (but the alternatives were not always in the same rank). For the ranges of changes in the values of parameters suggested by the decision maker, the sensitivity of the final result (the ranking) was insignificant.
The final ranking, shown in (5), was still achieved when the values of relative importance (w) were changed for both a single criterion and for multiple criteria simultaneously. Basing on the sensitivity analysis, we conclude the following: the decision maker can accept a different final ranking when the influence of the parameter changes on the final result can be justified and when the result changes only slightly compared with the final ranking accepted by the decision maker before the sensitivity analysis was performed.
Performing a sensitivity analysis ends the decision aiding process. Note that in this calculation method, it is the decision maker who makes the final assessment and judges whether factors, such as the interpretation of the final result, the coherence between the final result and his preferences, the availability and access to information that may influence the final result and the manner in which the information is modified, are consistent with his expectations.
Results and discussion
Table 8 presents a summary of the results of this study. Based on these results and the proposed final ranking given in (5), we find the following:
the retail trade (A 6) and manufacturing (A 4) sectors were consistently ranked first;
the utilities sector (A 2) was ranked second;
the wholesale trade sector (A 5) was consistently ranked third;
the mining sector (A 1) and the management of companies and enterprises sector (A 12) were consistently ranked at the bottom of the ranking;
the art, entertainment, and recreation sector (A 16) was consistently ranked in one of the lowest positions, just above the A 1 and A 12 sectors; and
the remaining sectors were consistently ranked in the middle.
Based on these results, the retail trade and manufacturing sectors are the most attractive for potential investors. This sector includes Motor Vehicle and Parts Dealers, Furniture and Home Furnishings Stores, Electronics and Appliance Stores, Food and Beverage Stores, Gasoline Stations, Clothing and Clothing Accessories Stores, and Food and Beverage Manufacturing. Historically, these sectors have enjoyed a relative competitive advantage in the Mexican Northwest’s marketplace. The utilities and wholesale trade sectors also appear to be promising for investors. Perhaps recent investments in shopping centers in Sinaloa and the construction of a new dam have increased the attractiveness of these sectors.
The weak performance of the mining sector may be attributed to the lack of technological innovations and infrastructure investment. However, in the last 5 years, there has been an important revival of this sector, which is primarily due to direct foreign investment. In contrast, the weak performance of the management of companies and enterprises sector may be attributed to the centralized economic activity in some Mexican states. Thus, private and public policy initiatives aimed at improving the performance of these subsectors are needed.
The art, entertainment, and recreation sector ranks low in terms of its attractiveness to investors because of the lack of infrastructure investment and the violent crime and public insecurity in Sinaloa in the last 10 years. Business innovations and policy-making linked with the federal government of Mexico are needed to stop the deterioration of this sector.
In the middle of the ranking, we find a large set of economic sectors. These sectors present stable investment opportunities. The enterprises represented by these sectors include construction, information, transportation, accommodation and food services, and educational services, among others. The average performance of these sectors is indicative of the mature, stable enterprises in them. Perhaps analyzing the practices of the more dynamic sectors may re-orient the business practices of these sectors and lead to better future performance.
Concluding comments
The aim of this study was to offer a novel procedure for integrated assessment and comparison of Sinaloa economic sectors using a Multicriteria Decision Aiding Approach. The complex interrelated issues concerning integrated assessment of economic sectors are discussed in the paper. The data used in the research are the economic indicators of different Sinaloa economic sectors. The proposed procedure for multicriteria comparison of economic sectors uses the ELECTRE-III method to construct a valued outranking relation and then a multiobjective evolutionary algorithm (MOEA) to exploit it to obtain a ranking of the economic sectors in decreasing order of performance. The results suggested that the best-performing sector is the retail sector. Furthermore, enterprises operating in the sectors of manufacturing industries, wholesale trade, utilities, and construction work more efficiently than an average Sinaloa enterprise. In contrast, the mining sector; the arts, entertainment and recreation sector; and the management of companies and enterprises sector were ranked below the average alternative.
The multicriteria method utilized in this study to rank the Sinaloa economic sectors is both practical and adequate. The proposed multicriteria assessment framework can provide a rationale for interested stakeholders, including government institutions and policy-makers; investors, financial institutions, and businessmen; employees and trade unions; and clients and suppliers related to certain sectors. More specifically, the government can impose some additional fiscal measures for the best performing sectors, namely retail, manufacturing, utilities, and wholesale trade, among others. The investors should opt for long-term investments in relatively inefficient sectors, i.e., the mining sector and the art, entertainment, and recreation sector. The short-term investments should be directed toward the relatively efficient sectors. Employees and their trade unions could successfully insist on increases in remuneration and other benefits only if their sector is an efficient one. Otherwise, these actions may result in unsustainable decisions. Finally, clients and suppliers dealing with inefficient sectors should consider additional means for reducing the risk of insolvency, such as credit insurance. Thus, a proper assessment of sector activity can improve the decisions of all the interested stakeholders and somewhat mitigate their risks.
This study thus demonstrated that the Multicriteria Decision Aiding approach can be successfully used for inter-sectoral comparisons. Consequently, effective strategic management decisions can be made at various management levels. Business strategies and policy initiatives guided by a systematic benchmarking effort may lead to an improvement in the collective performance of these sectors and subsectors. Thus, joint strategic partnership among business leaders, policy-makers and higher education institutions to promote innovative practices in these sectors may prove to be very useful. This kind of study can be easily replicated to other states of Mexico using the respective data of the economic census of Mexico.
The application presented in this study underscores the applicability of multiobjective evolutionary algorithms to real-life business problems in a multicriteria decisional context. Thus, this study contributes to a growing body of application-based knowledge, which was until very recently the exclusive domain of engineering and the natural sciences.

