


Serviços Personalizados
Journal
Artigo
 Inglês (pdf)
 Artigo em XML
 Referências do artigo
 Enviar este artigo por email
Indicadores
-
 Citado por SciELO
 -
 Acessos
Links relacionados
-
 Similares em
SciELO
Similares em
SciELO
Compartilhar

 Permalink
EconoQuantum
versão On-line ISSN 2007-9869versão impressa ISSN 1870-6622
EconoQuantum vol.8 no.1-2 Zapopan Jul./Dez. 2011
Artículos
Openness to trade and structural changes in the sources of economic growth and labour demand in Turkey1
Öner Günçavdi2 and Suat Küçükçiftçi
2 Correponding author: Öner Günçavdi, Economic and Social Research Centre, Faculty of Management, Îstanbul Technical University, 34387 Maçka – Istanbul / Turkey; email: guncavdi@itu.edu.tr.
Recepción: 21/09/2009
Aceptación: 06/09/2011
Abstract
Unlike neoclassical expectation behind the structural adjustment programme, some studies for Turkey have showed that the policy change in 1980 caused a decline in employment. Results show that the Turkish industrialisation strategy cannot be regarded as export-led industrialisation strategy. Extra output created by exports has been very limited during the post-liberalisation period. However domestic final demand has continued to be the most dominant determinant of output growth. A surprising result of the paper appears for the period of 1985-1990 when import substitution in final demand created output growth particularly in technology-intensive manufacturing and other manufacturing sectors. However import penetration in final and intermediate goods are important factors creating de-industrialisation in the period of 19901996. Despite neoclassical expectations, the reform period after 1982 witnessed large factor substitution against labour, even in the tradable goods sector. Additionally, labour demand also appears to response to output growth less in the post-liberalisation period than before.
Keywords: Structural changes, employment, input-output, trade reform, Turkey.
Clasificación JEL: D57, F14, O16, R15.
Resumen
A diferencia de las expectativas bajo el enfoque neoclásicas detrás del programa de ajuste estructural, algunos estudios de Turquía han demostrado que el cambio de política en 1980 causó una disminución en el empleo. Los resultados muestran que la estrategia de industrialización de Turquía no puede ser considerada como estrategia de industrialización impulsada por las exportaciones. La producción adicional creada por las exportaciones ha sido muy limitada durante el período posterior a la liberalización. Sin embargo, la demanda interna final ha seguido siendo el factor más dominante de crecimiento de la producción. Un resultado sorprendente de este documento aparece en el período de 1985-1990, en la sustitución de importaciones en la demanda final de crecimiento del producto creado especialmente en la tecnología de manufactura intensiva y otros sectores manufactureros. Sin embargo, la penetración de importaciones de bienes finales e intermedios son factores importantes para la creación de la desindustrialización en el período de 1990-1996. A pesar de las expectativas de estilo neoclásico, el período de reforma a partir de 1982 fue testigo de la sustitución de factores de gran lucha contra el trabajo, incluso en el sector de bienes comercializables. Además, la demanda de trabajo también parece respuesta al crecimiento de la producción menor en el período posterior a la liberalización que antes.
Introduction
The relationship between opennes to trade and economic growth has been the one of the key issues of debate in development economics, and this debate has paved way of a large number of theoretical and empirical researches, most of which predominantly indicated the presence of a positive and significant relationship between trade opennes and economic growth (see Krueger, 1998; Greenaway et al., 2002; Yanıkkaya, 2003; Lewer and den Berg, 2003). However, another group of empirical researches has drawn our attention to other factors, rather than trade, in determining economic growth. Rodriguez and Rodrik (1999) and Frankel and Romer (1999), for example, put particular emphasis upon the role of geography which may be endogenous with a trade variable and overstates the estimated coefficient of the trade variable in a single OLS regression. Recent growth theory has also provided an important insight into understanding the determinants of economics growth and the role of international trade as its determinant. Likewise climate, instutional quality, R&D activities, the rule of law and property right have been considered as crucial determinants of economic growth, and it has been seen that the inclusion of these factors into an OLS estimation based on a large cross section data diminished the size of the coefficient of the trade variable, and puzzeled economists and policy makers regarding the importance of trade in designing right economic policies to promote economic growth. Despite all these competing empirical results, there is still enough room for further research, particularly based on a single country and using a different empirical methodology.
Although there has been a large amount of literature trying to resolve this debate, regression analysis appears to have been a standart tool used in the literature. However, the presence of this debate in empirical researches justifies the use of new empirical tools to investigate this relationship between trade opennes and economic growth. The Input-Output methodology in this regards is employed in this paper as a consequence of such need.
Unlike other researches in the literature, our investigation in this paper is based on the data from a single country, rather than cross section of countries. Among others, one important reason for this is that it is extremely difficult to control each country specific factor in a pooled data set, and accordingly it is difficult to interpret the empirical results for a single country in the same data set. However, the experience of a single country, which has liberalized her trade regime succefully, may provide better insight into understanding trade-growth relationship. Turkey in this respect was among those countries implementing trade reform policies which were promoted by IMF and World Bank in the early 1980s. It gradually opened up its trade regime starting in 1980, and after almost 30 years today it can be seen as one of the success story in the world.
Turkey has undergone drastic structural changes in its economy since the beginning of the 1980s. In the inhospitable international setting of the pre-1980 period, Turkey had pursued an inward-oriented industrialisation strategy, which was supported by a high degree of protection, exchange rate controls, negative real interest rates etc. However, this strategy was followed by severe balance of payment crises in 1979, which arose basically from the low level of exports and heavy dependence on imported capital and intermediate goods. International organisations, such as the International Monetary Funds (IMF) and World Bank, then urged Turkey to adopt a more outward-oriented development strategy emphasising greater reliance on market mechanism, reductions in barriers to imports and removal of all distortions that cause internal relative prices to deviate from the relative world prices. The Turkish structural changes in economic policies were far reaching, and can be attributed to some extent to trade reforms. The expectation from the liberalisation of the foreign trade was that increasing foreign trade would improve the allocation of economic resources and would encourage the domestic production. With various incentive measures and competitive foreign exchange rate, exports additionally were expected to take over a greater share in the international markets in favour of the Turkish tradeable goods.
In the post-reform period, the Turkish economy has been exposed to fluctuations in the world economy for nearly 20 years with liberal trade policies, and arises some concerns about whether international trade has helped the Turkish economy for (de) industrialisation. This paper accordingly attempts to examine changes in compositional structural change of the economy as a consequence of trade reform, and measures the extent of which trade-related factors were accounted for these changes. Compositional structural changes particularly allow us to analyse the changes in the relative importance of different demand factors in creating output and employment in the pre- and post-liberalisation periods.
The effects of structural adjustment programme in Turkey have been examined by various studies (see Arıcanlı and Rodrik, 1990, Günçavdı, Bleaney and McKay, 1999), but a few have put particular emphasis on the employment effects of structural adjustment programme (e.g. Günçavdı and Küçükçifçi, 2001, Günçavdı, Küçükçifçi and McKay, 2003, Günlük-Senesen, 1998 and Yentürk, 1997). The Turkish structural adjustment programme aimed to increase the production of tradeable goods, while reducing their domestic consumption, so bringing about external balance. The measures of the programme included both of them, which are likely to have adverse employment effects, such as fiscal contraction, import competition, etc., and others which are likely have favourable impacts on employment, such as increases in production of exportation and the production of tradeable goods (Rodrik, 1999). The net effect is, however, a matter of empirical investigation. The theory behind Structural Adjustment Programmes is provided by the conventional Heckscher-Ohlin (H-O) Theorem. This theorem predicts that countries will tend to be net exporters of their abundant factors and net importers of their scare factors. Previous studies for Turkey have consistently showed that the structural adjustment programme and trade reform as an integral part of it were ineffective creating additional employment in this expected direction for the labour abundant Turkish economy and, in fact, caused an economy-wide decline in employment in the pro-adjustment period (Günçavdı and Küçükçifçi, 2001, Günlük
Senesen, 1998 and Yentürk, 1997). However, none of them has explicitly investigated the sources behind this decline in employment in the adjustment period. In this study, we investigate the role of various trade-related factors in the losses (or gains) in output and employment, and introduce a methodology to measure the changing role of these factors in sectoral and total output growth.
The remainder of the paper is organised as follows. The following section highlights the main aspects of economic development in the Turkish economy. In the second section the methodology is introduced to identify the sources of the changes in economic growth and employment. In the third section presents the sources of data and the results derived for at the total and sectoral levels. The final section gives concluding comments.
Economic background and trade reform in turkey
After two decades of experience with the import-substituting industrialisation strategy, the Turkish economy has undergone radical economic reforms towards relatively more open, outward-oriented strategy with increasing reliance on the guidance of the market mechanism (see Celasun and Rodrik, 1989; Arıcanlı and Rodrik, 1990). In the pre-reform period, Turkish development strategies had been based upon the premise that industrialisation was essential and could be encouraged only through policies that protected the domestic firms from foreign competition. Accordingly, in the sectors where the domestic production flourished, imports had been restricted through various quantity restrictions (see Baysan and Blitzer, 1990).3 The Turkish economy, however, enjoyed this strategy with very high growth rates until 1976, which was 7.2 percent on average for the period of 1973-1976 (see Table 1). The public sector was the deriving force behind this economic growth, relying largely upon expansion of public demand and investment boom (see Celasun, 1990). Import demand required for ambitious growth rates, as a consequence, it was growing much more rapidly than exports, and it was thus worsening balance of payment of the country and leading the economy to being increasingly dependent on foreign borrowing. When the country's balance of payment position worsened, the widely-used means of external adjustment in the prereform period were the use of international reserve (if available), restricting imports through highly protective trade regime, and when imbalances reached unsustainable levels, sizeable devaluations of the Turkish lira (see Metin-Özcan et al., 2001).4 In the 1977-1980 period, the economy growth virtually collapsed to 1.3 percent on average (see Table 1), mainly because of supply-side bottlenecks imposed by unfavourable international setting of the time (see Bilginsoy, 1993).
Under the trade regime prior to 1980, imports were subject to discretionary import licensing, along with restrictions, which governed the utilisation and allocation of foreign exchange. Protection was further intensified by extremely high levels of tariffs across the border. In this macroeconomic setting, there was little incentive for exports, given the high profitability of producing for the domestic market. Furthermore, this protection system, which became increasingly complex over time, led to the elimination of the possibility of competition in the domestic markets, and hence contributed to high levels of inefficiency in the economy (see Krueger and Aktan, 1992 for detail).
Monetary policies in the same period were very much designed for complementing the trade regime and the industrialisation. Until 1982, the Turkish financial markets had been considered as financially repressed with intensive government involvements into financial markets in the forms of fixing interest rate and exchange rates, heavy tax burden on financial earnings, high liquidity and reserve requirement ratios, limiting the entry to the financial markets. Control was also exercised on the allocation of credit by public ownership of financial institutions providing long-run loan to the privileged private sector (see e.g. Akyüz, 1990; Atiyas and Ersel, 1995).
Starting in 1980, Turkey embarked on a series of policy reforms under the auspices of international institutions such as the IMF and the World Bank. Between 1980 and 1984, the World Bank granted Turkey five one-year structural adjustment loans (SALs), amounting to $1.6 billion, which were all used in supporting policy reforms (Kirkpatrick and Öni ![]() , 1991). The great extent of reforms took place in the period of 1980-1986, and involved trade and foreign exchange regimes and price reform aiming at reducing public involvement in commodity and financial markets. On the finance side, financial liberalisation became an integral part of overall reform programme. Financial reforms initially aimed at eliminating exogenous constraints, which had been created by intensive public involvement and administratively controlled interest rates. First interest rates were freed, allowing real interest to become positive in the pro-reform period. New financial institutions were introduced with a premise that they improve the efficiency of financial markets and the allocation of financial resources among alternative uses. The restrictions on the entry into the Turkish banking sector were removed.
, 1991). The great extent of reforms took place in the period of 1980-1986, and involved trade and foreign exchange regimes and price reform aiming at reducing public involvement in commodity and financial markets. On the finance side, financial liberalisation became an integral part of overall reform programme. Financial reforms initially aimed at eliminating exogenous constraints, which had been created by intensive public involvement and administratively controlled interest rates. First interest rates were freed, allowing real interest to become positive in the pro-reform period. New financial institutions were introduced with a premise that they improve the efficiency of financial markets and the allocation of financial resources among alternative uses. The restrictions on the entry into the Turkish banking sector were removed.
As another integral part of the reform, the government implemented a rather gradual trade liberalisation because of the worry that a rapid import liberalisation would deteriorate the balance of payments condition of the country. The trade reform between 1980 and 1985 aimed at eliminating quantitative controls on imports (such as quota and licensing system), and included the reduction of stamp duty from 25 percent to 1 percent, gradual shifting of goods from most restrictive List II to liberalised List I (see Baysan and Blitzer, 1990 and Olgun and Togan, 1990). In January 1995, Turkey finally joined the custom union and eased foreign trade with European Union. The export promotion strategy was implemented by introducing a number of export incentives including tax rebates, subsidised credit and foreign exchange allocation that allowed for the duty-free import of raw materials.5 An improvement in the balance of payments was of great importance to the government, first to gain international creditworthiness, then to compensate for the depressed domestic demand due to the austerity programme.
The economy responded to these changes in economic policies in the beginning very well. Exports grew very rapidly, at an annual rate of 24 percent, in the early reform period of 1980-1985 (see SOP, 2002). The economy-wide export-GNP ratio rose from 4.2 percent in 1980 to nearly 12 percent in 1985. The composition of exports also drastically changed. The share of industrial good exports rose from 36 percent of total exports in 1980 to 75 percent in 1985, while that of agricultural exports, which had been the traditional export sector in Turkey for many years before the reforms, declined from 57.5 percent in 1980 to 21.6 percent in 1985. Following the import liberalisation, imports increased substantially at an annual growth rate of 56 percent from 1979 to 1980. The most striking feature of imports figures is the observation of a rapid increase in the share of the importation of consumption goods from 2.1 percent in 1980 to 8.6 percent in 1986. In the second phase of the reform in the period 1987-1990, the ratio of exports to imports increased to 71 percent from almost 64 percent in the initial period 1980-1985.
This drastic structural change in the economy is shown in Table 2, which reports the shares of sectoral production levels in GDP over the period of 1963-1996. The most drastic feature of the change was the enormous decline in the share of agricultural output from 36 percent in the period of 1968-1973 to nearly 16 percent in the period of 1991-1996. The share of service output, on the other hand, showed a substantial rise from 36 percent in 1968-1973 to 46 percent in the period of 1991-1996.

It is clear, from the discussion above, that the Turkish economy underwent a series of radical institutional and structural changes in the 1980s and 1990s. It is also obvious that changes in the trade regime of the country were crucial element of these radical changes. However, after nearly 20 years of experiences with liberal trade policies, the Turkish trade regime still raises some concerns about its contribution to economic problems that the country has recently encountered. In what follows we introduce the methodology to measure the extent of which changes in trade regime influence (de) industrialisation through output growth and employment generation.
Methodology
In this section, we introduce the accounting approach to the analysis of patterns of economic growth pioneered by Chenery et al. (1962) using input-output framework (also see Gregory et al., 2001; Albala-Bertrand, 1999; and Feldman et al., 1987). We then apply this framework to the Turkish input-output tables in order to investigate the sources of economic growth in the Turkish economy.
Input-output models are based on some restrictive assumptions of fixed input-output coefficients with constant returns to scale, fixed factor shares in production and perfectly elastic supplies of factors of production (see Bulmer-Thomas, 1982). The Leontief production function is often criticised for its assumption of fixed coefficients in input use. Since we utilise input-output tables observed at two separate dates, we obtain direct measures of the change in input use over time. Therefore, the only necessary assumption on the production function is constant returns to scale across all inputs at each point in time. The model and its derivation are introduced in the following section.
(a) The source of Changes in Gross Output In a standard input-output framework, the flows of all goods in an economy with n industries can be written as follows:

where I and A respectively are the unit matrix and the matrix of input-output coefficients, whose element aij represents the unit-input requirement of the ith industry for the output of the jth industry, all with (n × n) dimension. x is the column vector of sectoral production, with (n × 1) dimension. f and e, respectively, are the vectors of total final demand and exports, both with (n × 1) dimension.
The balance equation for the flow of domestic output can be written as follows:

where fd: the vector of flows of domestic final use; wd: the vector of flows to domestic intermediate use, which is given by:

Upon substituting (3) into (2),

Imports are included in this framework by assuming that imported goods for intermediate and final uses are in fixed proportion of total. In other words,

where Ad: the matrix of domestic input-output coefficients, h: domestic supply ratio in intermediate uses, s: domestic supply ratio in final uses. Substituting (4) into (3) renders the following:

Solving (6) with respect to x gives

This relationship holds for any point in time, and differencing it with respect to time and rearranging the resulting expression gives us the change in gross output between any two periods. This final expression allows us explicitly to see the sources of these changes in gross output as follows:

where Δ denotes the change over time; R =(I−hA)−1 is the Leontief inverse matrix. The level terms in equation (8) can be evaluated as beginning and end values, which are similar to Paasche and Laspeyres index weighting. The derivation of the formula for either use is analogous and yields the following two results for Paasche and Laspeyres index weighting respectively: 4
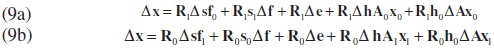
where the subscript 0 and 1 represent the initial and terminal years respectively. Equation (9) allocates the change in gross output among changes in the various components of its use: the changes in domestic final demand (Δf); the changes in exports (Δe); the changes in the home shares in final consumption (import substitution in final demand) (Δs); and the changes in the home shares in intermediate goods (import substitution in intermediate goods) (Δh). The term ΔA explicitly allows the input-use coefficients to vary over time in a way that will be determined by the data. These changes in Leontief coefficients are interpreted as technical changes in the production. In what follows, equation (9) is then applied to the data of the Turkish economy.
Output Growth and Employment Our interest is in assessing the sources of changes in employment in the Turkish economy over a period. In doing so, we extend the derivations in the previous section towards decomposing the sources of sectoral employment demand. We implicitly assume that changes in employment are due to output growth and factor substitution in production. Therefore, the factors that cause to change gross output can also be considered as the sources of changes in employment. Total labour requirements of producing x are given by:

where L is the vector of sectoral employment levels, l is the vector of employment coefficients required in the production of unit output (expressed as a diagonal matrix). Similarly, we difference (10) with respect to time to measure the sources of changes in employment as follows:

where 0 and 1 represent the initial and terminal points in time. To be comparability with the earlier derivation we use the Laspeyres weighting, and derive the following:

In equation (12), changes in demand for employment can be attributed to two different sources; namely changes in sectoral gross output at constant labour use (the first term on the right-hand side), and changes in the use of labour per unit output (the second term on the right-hand side). Substituting (9) into (12) allows us to see the allocation of changes in demand for employment across the various sources of output on the one hand, and labour requirements per unit of output on the other.

Equation (13) is the expression, showing that changes in employment are associated with the evaluation of the various constituents of demand and technology. The results of this analysis are presented in the next section.
Empirical results
a) Data Our analysis is based on the input-output tables for the years 1973, 1985, 1990 and 1996. Our focus on these four years was primarily dictated by the availability and reliability of detailed data on input-output tables. Although another table is available for 1979, the analysis based on this table lacks credibility because this year was a year of foreign exchange shortage, which caused various constraints on the supply side of the economy (see Bilginsoy, 1993). These three papers, however, are candidates of reflecting the different phases of the Turkish economy. The first table, for example, compromises structural information regarding the inward-oriented strategy before 1980. In order to see the structural changes after the reform, other tables can be used. The table for 1985 represents the economic structure just after the initial reforms, whereas information on the economy after the capital account liberalisation can be extracted from the table for 1990. The distortions created by the effects of increased public involvement in capital markets and large capital flows could be captured in the recently published 1996 table (see State Institute of Statistics, 2002).
The first three input-output tables for Turkey contain 64 industries while the last one for 1996 possesses only 97 sectors. However, the number of sectors must be reduced to 24 because price indices and employment data used in this study are available only for 24 sectors. Sectoral employment data in Turkey are collected from different sources, and typically cover formal employment figures which are recorded by the Social Insurance Agency and the Civil Servants' Pension Funds (see Celasun, 1990 for detail). However, the use of informal labour is widespread in the Turkish economy (see Özar, 1995; Köse and Yeldan, 1996; Yeldan, 2000 for further discussion). For example, Günlük-Senesen (1998) estimated that the use of informal labour in 1990 is 98 percent of total employment in agriculture, 44 percent in manufacturing and 48 percent in services. The estimated figures on the use of labour (including formal and informal) in all 24 industries are borrowed from Günlük-Senesen (1998) for the year 1973 and 1990, and these figures show consistency with the estimates of similar figures in Köse and Yeldan (1996). Employment data for 1985 and 1996 have been compiled from Household Labour Force Survey Results April 1998 by the authors and adjusted according to Günlük-Senesen (1998) for the inclusion of the informal labour force (see SIS, 1998).
Our analysis is based on aggregated tables by commodity groups, rather than industry by industry input-output tables. All sectors are classified to seven aggregate sectors; namely primary and extractive sectors, primary manufacturing, technologyintensive manufacturing, other manufacturing, less tradeable services, more tradeable services and financial services. The intertemporal comparison of input-output tables for different years necessitates handling changes in price levels, particularly in any study involving a highly inflationary country such as Turkey. All data used in our analysis have therefore been deflated to 1973 prices (see Appendix B). It must be noted that the price indices for services are implicit GNP deflator computed from State Institute of Statistics. Further details about data and aggregation are given in Appendix C.
b) Results
The losses (or gains) of output and employment in the Turkish economy as a result of foreign trade can be attributed to some trade-related factors such as import penetration and substitution effects and exports along with changes in technology and final demand. After the trade liberalisation foreign trade became easier, and an increase in import competition could cause the domestic production to loose market share with a likely decline in output and employment. Import substitution, on the other hand, encourages domestic production of formally imported goods, and positively contributed to the sectoral as well as total output levels. Exports, in this regard, are expected to contribute to output positively and may increase employment level dependent on the production technology of the domestic economy. Understanding which of these effects has contributed most directly to changes in output and employment is crucial to assessing the nature of (de) industrialisation in Turkey. In this section we examine the role of each of these factors in output growth and changes in employment using the methodology introduced in the third section.
The first group of our results is shown in Table 3, which reports the shares and growth rates of sectoral output aggregated by commodity groups. Over the entire period between 1973 and 1996, the economy seems to have grown on average by 6.5 percent per annum. The striking feature of the growth rates over the entire period is that the economy grew more rapid in the period of 1985-1990 than others, with 8.7 percent growth rate on average. This can be attributed to expansionary macroeconomic policies, which became feasible after the capital account liberalisation in 1989. However, the growth performance of the economy dropped drastically in the last period of 1990-1996, particularly with the influence of Gulf War in 1991 and the economic crises in 1994.
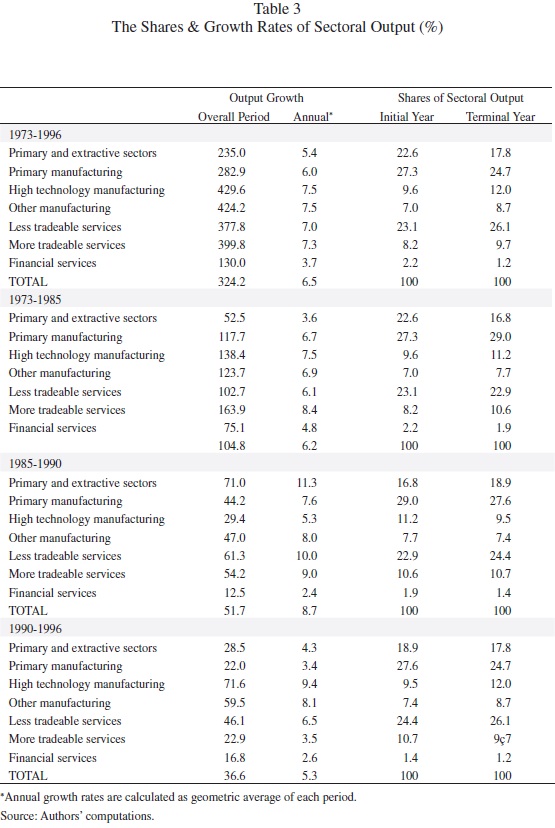
After the implementation of the structural adjustment programme, it was expected that new incentive structure encouraged the production of mostly tradeable goods. In the first sub-period in the table, corresponding to the initial stage of the programme, the growth performances of the sectors like primary & extractive and the finance sectors appear not to have been particularly impressive due to the growth rates lower than the entire economy. However, the sector that can be considered as relatively technology intensive performed better than the entire economy in the period of 1973-1985, with the only exception of the growth of more tradeable service sector. This performance caused a substantial rise in output share of the technology manufacturer in 1985. In the following period of 1985-1990, the less tradeable service sectors grew relatively more rapid than the entire economy with 10 percent growth rate per annum on average, and led the share of this sector in total output to a slight increase from 1985 to 1990. With the 26 percent share, the less tradeable service output became the largest sectoral production in the Turkish economy in 1996.
Somewhat surprisingly, the performance of the financial sector was disappointing especially in the second sub-period of 1985-1990. Although various incentive measures were undertaken along with deregulation in the financial sector in the early 1980s, its growth rate appeared to be 5 percent, second lowest in the economy after the primary and extractive sectors, and then sharply declined by almost 50 percent in the period of 1985-1990. The share of financial output also continuously declined in the post-liberalisation period. The high technology manufacturing sector grew in the same period more slowly than total output. The other manufacturing sector first slumped in the early stage of reform and then revived in the last sub-period.
Output growth exhibits a great fluctuation, in the entire economy. After a 6.2 percent rate in the first sub-period, growth revived substantially and then slumped to 5 percent. To examine the causes of this fluctuation we decomposed the output growth rates into five different sources as defined in the previous section, and report them in Table (4a) and (4b).The results in the tables are based on two different weighting, namely Laspeyres and Paasche. Each table consists of four different panels corresponding to three sub-periods and the entire period. The sources of growth are shown in the columns of the tables. Figures in the tables are the percentage shares of each source in the total output growth.
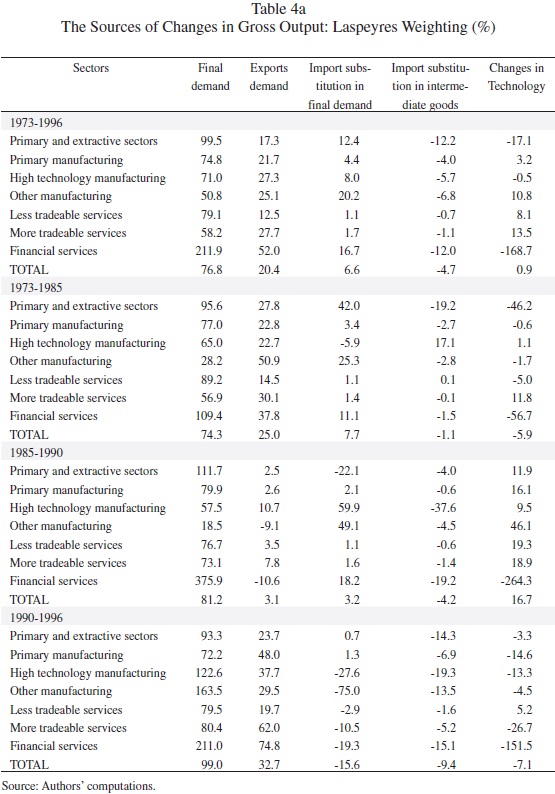

Decomposition of the changes (Table 4a)6 reveals that over the whole period, final demand, exports, home share in final demand (i.e. import substitution) and the changes in Leontief coefficients were positive influences for output growth, and falling home share in intermediate goods was a negative influence. The growth of domestic final demand made the largest contribution to total output growth with the nearly 77 percent share. The extra unit of exports generated the second largest impact on total output, and this was followed by import substitutions in intermediate goods. Also the production technology in the entire period appears to have changed in a way of demanding more domestic production, and caused to increase total output in the economy.
There were also differences between sub-periods. Somewhat surprisingly, the impact of import penetration due to trade liberalisation was not as much as expected in the 1973-1985 period. On the contrary, import substitution in final demand had almost 8 percent share in changes in total output while import penetration in intermediate goods was responsible only 1 percent decline in output. This finding is particularly important because an easy import with trade reform was expected to increase import penetration. We must also note that the period of 1973-1985 includes the period of import-substitution strategy until 1980 and exposed to the output generation effects of this strategy. However, import penetration did not appear to be a discouraging factor in output growth even in the post-liberalisation period of 1985-1990. Exports, on the other hand, in the same period accounted for only 25 percent of total changes in output. It can be considered as the contribution of the Turkish trade reform and export promotion policies to this output growth.
Table 5 reports better presentation of the evidence regarding the role of the traderelated sources of output growth. The formation of Table 5 is based on the numerical results shown in Table 4. As presented earlier, foreign trade may influence output growth through three distinctive channels, which can be regarded as the trade-related sources of output growth; namely exports (foreign demand for Turkish goods), import substitution and import penetration (or competition). Increases in first two sources encourage the domestic production while a rise in the import competition is expected to decrease it. Any sources of growth written bold in each cell represent the most dominant factors that influence the domestic production. In the period of 1973-1996, for example, exports and import substitution in final goods appear to be the most dominant two factors on the sectoral output growth for the primary and extractive sector. Although import penetration seems to have discouraged domestic production substantially (by 12 percent in Table 4a), this effect cancelled out by the sum of the positive contributions created by exports and import substitution in final demand. In the entire period between 1973 and 1996, the foreign trade (through exports, import substitution in final goods and import penetration in intermediate goods) can be accounted for the 22.3 percent7 of overall output growth in the Turkish economy. Foreign trade seems to explain 32 percent of output growth in the first-sub-period of 1973-1985, while only 2 percent in the period of 1985-1990. Despite a small increase in this share, it is still very difficult to express with nearly 8 percent share that the Turkish output growth was trade-driven growth. It seems from our results that the Turkish domestic production has been competing with foreign goods which penetrated the Turkish market substantially and discouraged 25 percent of domestic production in the period of 1990-1996.
c) Structural changes and demand for labour
Table 6 contains the decomposition of the employment change as noted in equation (12), which reveals the impacts of changing technology and business organisation on the demand for labour. As seen in the table employment, generation effects of gross output are largely counterbalanced by decreasing labour-input requirement per unit of gross output. Labour-saving technology and factor substitution in favour of capital play a major role in these negative effects of change in employment-output ratio.


Closer examinations of the sub-periods of 1973-1996 give rise to the fact that the employment-generation ability of the economy drastically declined over time. While employment grew 20 percent in the period of 1973-1985, this growth rate dramatically felt to 9 percent in the period of 1985-1990, and then rose to 12 percent in the last period (yet it did not reach to its initial level). It is clear from this evidence that the Turkish economy, overall, lost its employment generation ability in the post-liberalisation period.
This undistinguished performance of the economy appears to have resulted from two separated factors, namely employment generation effects of output growth and changes in employment-income ratio. Considering the former effect, demand for labour seems to response to output growth eventually less than the pre-liberalisation period. It is also evident from Table 6a, that factor substitution appears to have taken place in favour of capital, rather than labour.
In a sectoral investigation, the finance sector comes forward with its 250 percent total change in employment in the period of 1973-1985. This is particularly crucial be-cause factor substitution was the primary source of employment generated with its 175 percent. The output growth in this sector led only 75 percent of labour demand in this period. This distinguished record of the finance sector went along with liberalisation efforts of the sector after 1982. However, this trend dramatically changed in the period of 1985-1990. The positive and substantial effect of factor substitution reversed and led to almost 2 percent decline in labour demand in the sector.
The less tradeable goods sector became the second leading sources of employment in the economy in the first port-liberalisation period with the growth rates 62 percent in the 1973-1985 period and 21 percent in the period of 1985-1990. Interestingly, this leading role took place in the period where the incentive structure of the economy changed in favour of tradeable and production of the non-tradeable was expected to have declined.
Another interesting result of Table 6a is that factor substitution took place, to a great extent, against labour in the post-liberalisation period. Among other sectors, this is especially important for the tradeable sector. This is because the export-promotion policy adopted in the early 1980 was expected to encouraged labour intensive export goods. However, the results in Table 6a indicate that the factor component of the tradeable goods sector changed against labour in the period of 1985-1990. This particular result is consistent with Günçavdı and Küçükçifçi (2001) and Günçavdı et al. (2001).
Conclusión
The effect of foreign trade has been substantially high and positive on the domestic production in the periods covering the periods of both import substitution and trade reform between 1973 and 1985. Despite this effect was still positive, its magnitude seems to have dropped drastically in the period of 1985-1990 where the Turkish economy was open to international markets. This undistinguished growth performance of foreign trade was because of increased import competition in final demand and intermediate goods. Our findings implicitly show that output gains created by trade in the Turkish economy appear to have been temporary, possible only in the early years of reforms. However, this does not mean that trade reform itself was unsuccessful. This undistinguished performance of trade in terms of creating extra domestic production might be related to macroeconomic environment. Fiscal expansion, overvaluation of TL in some periods and macroeconomic uncertainty that discourage domestic production may also be taken responsible for unimpressive growth performance of trade. Empirical results also show that the employment generation capacity of the Turkish economy drastically declined in the post-liberalisation period. Despite neoclassical expectations, the reform period after 1982 witnessed large factor substitution against labour, even in the tradeable goods sector. Additionally, labour demand also appears to response to output growth less in the post-liberalisation period than before.
References
Akyüz, Y. (1990). "Financial system and policies in Turkey in the 1980s". In Aricanli, T. and Rodrik, D. (eds) The Political Economy of Turkey: Debt, Adjustment and Sustainability. London: MacMillan. [ Links ]
Albala-Bertrand, J. M. (1999). "Structural Change in Chile: 1960-90", Economic System Research 11 (3):301-319. [ Links ]
Aricanli, T., Rodrik, D. (1990). The Political Economy of Turkey: Debt, Adjustment, and Sustainability. MacMillan, London. [ Links ]
Atiyas, I. and Ersel, H. (1995). "The impacto of financial reform: the Turkish experience". In Caprio, G. Jr., Atiyas, I. and Hanson, J. A. Financial Reform: Theory and Experience. New York: Cambridge University Press. [ Links ]
Baysan, T. and C. Blitzer (1990). "Turkey's Trade Liberalisation in the 1980s and Prospects for its Sustainability", in T. Arıcanlı and D. Rodrik (eds.), The Political Economy of Turkey: Debt, Adjustment and Sustainability, pp. 9-36, (London: MacMillan Press). [ Links ]
Bilginsoy, C. (1993). "Inflation, growth, and import bottlenecks in the Turkish manufacturing industry", Journal of Development Economics 42:111-131. [ Links ]
Bulmer-Thomas, V. (1982). Input-Output Analysis in Developing Countries. New York: Wiley. [ Links ]
Celasun, M. (1990). Fiscal aspects of adjustment in the 1980s. In T. Aricanli and D. Rodrik (Eds) The Political Economy of Turkey: Debt, Adjustment and Sustainability. London: MacMillan. [ Links ]
Celasun, M. (1989). "Income Distribution and Employment Aspects of Turkey's post 1980 Adjustment", METU Studies on Development 16 (3-4):1-31. [ Links ]
Celasun, M. and D. Rodrik (1989). "Debt, Adjustment and Growth: Turkey", in J. D. Sachs and S.M. Collins (eds.), Developing Country Debt and Economic Performance: Country Studies-Indonesia, Korea, Philippines, Turkey, (Chicago: The university of Chicago Press). [ Links ]
Chenery, H., S. Shishido and T. Watanabe (1962). "The Pattern of Japanese Growth 1914-54", Econometrica 30: 98-131. [ Links ]
Feldman, McClain and Palmer (1987). "Sources of Structural Change in the United States 1963-1978: An Input-Output Perspective", Review of Economics and Statistics 69:503-510. [ Links ]
Frankel, J. A. and D. Romer (1999). "Does Trade Cause Growth". American Economic Review 89 (3):379-399. [ Links ]
Günçavdı, Ö., M. Bleaney and A. McKay (1999). "Private Investment and Structural Adjustment - A Case Study of Turkey". The Journal of International Development, 11: 221-239. [ Links ]
Günçavdı, Ö. and S. Küçükçifçi (2001). "Foreign Trade and Factor Intensity in an Open Developing Country: An Input-Output Analysis for Turkey", Russian & East European Finance and Trade 37 (1):75-88. [ Links ]
Günçavdı, Ö., S. Küçükçifçi and A. MacKay (2003). "Adjustment, Stabilisation and the Analysis of the Employment Structure in Turkey: An Input-Output Approach", the Economics of Planning, 36: 315-331. [ Links ]
Günlük-Şenesen, G. (1998). "An Input-Output Analysis of Employment Structure in Turkey: 1973-1990", Economic Research Forum Conference for Arab Countries, Iran and Turkey Working Paper 9809, Cairo. [ Links ]
Greenaway, D., W. Morgan and P. Wright (2002). "Trade Liberalisation and Growth in Developing Countries". Journal of Development Economics 67: 229-244. [ Links ]
Gregory, M., B. Zissimos and C. Greenhalgh (2001). "Jobs for the Skilled: How Technology, Trade and Domestic Demand Changed the Structure of UK Employment, 1979-90", Oxford Economic Papers 53, 20-46. [ Links ]
Kirkpatrick, C. and Z. Öniş(1991). "Turkey", in P. Mosley and J. Harrigan and J. Toye (eds.), Aid and Power: The World Bank and Policy-Based Lending, vol. 2, Case Studies, (London: Routledges). [ Links ]
Köse, H. A. and E. Yeldan (1996). "On Sectoral Employment and Wage Structure in the Turkish Economy", Mimo. (in Turkish), Bilkent University, Department of Economics, Ankara. [ Links ]
Krueger, A. O. (1998). "Why Trade Liberalisation is Good for Growth". Economic Journal 108:1513-1522. [ Links ]
Krueger, A. O. and O. H. Aktan (1992). Swimming Against the Tide: Turkish Trade Reform in the 1980s (San Francisco: International Centre for Economic Growth). [ Links ]
Leontief, V. (1951). The Structure of the American Economy 1919-39: An Empirical Application of Equilibrium Analysis, (New York: Oxford University Press). [ Links ]
Lewer, J. J. and H. Van den Berg (2003). "How Large is International Trade Effect on Economic Growth?". Journal of Economic Survey 17 (3): 363-396. [ Links ]
Martin, J. and J. Evans (1981). "Notes on Measuring the Employment Displacement Effects of Trade by the Accounting Procedure", Oxford Economic Papers 33 (1):154-164. [ Links ]
Metin-Özcan, K., E. Voyvoda and A. E. Yeldan (2001). "Dynamics of Macroeconomic Adjustment in a Globalized Developing Economy: Growth, Accumulation and Distribution, Turkey 1969-1999", Canadian Journal of Development Studies 22 (1):219-253. [ Links ]
Rodrik, D. (1999). The New Global Economy and Developing Countries: Making Openness Work, Policy Essay No. 24, (Washington, DC: Overseas Development Council). [ Links ]
Rodriguez, F. and D. Rodrik (1999). "Trade Policy and Economic Growth: A Skeptic's Guide to the Cross-National Evidence". Working Paper 7081, NBER. [ Links ]
Olgun, H. and S. Togan (1990). "Trade Liberalisation and the Structure of Protection in Turkey in the 1980s: A Quantitative Analysis", Weltwirtschaftliches Archiv 127 (1):152-169. [ Links ]
Özar, S. (1995). "The Informal Sector in Turkey", paper presented at ERF Conference, December 1-3, 1995, Aswan, Egypt. [ Links ]
Özatay, F. (2000). "A Quarterly Macroeconometric Model for a Highly Inflationary and Indebted Country: Turkey", Economic Modelling 17: 1-11. [ Links ]
State Institute Of Statistics (2002). The Input-Output Structure of the Turkish Economy, (Ankara: SIS). [ Links ]
State Institute of Statistics (1998). Household Labour Force Survey Results, (Ankara: SIS). [ Links ]
State Planning Organisation (1997). Economic and Social Indicators (1950-1998), Ankara: State Planning Organisation. [ Links ]
State Planning Organisation (2002). Economic and Social Indicators (Ankara: SPO). [ Links ]
Yanıkkaya, H. (2003). "Trade Openness and Economic Growth: A Cross-Country Empirical Investigation". Journal of Development Economics 72:57-89. [ Links ]
Yeldan. E. (2000). "The Impact of Financial Liberalisation and the Rise of Financial Rents on Income Inequality: The Case of Turkey", Working Papers No. 206, The United Nations University, World Institute for Development Economics Research (WIDER), November. [ Links ]
Yentürk, N. (1997). "Wages, Employment and Accumulation in the Turkish Economy" (in Turkish), Working Papers, (Istanbul: Friedrich Ebert Foundation). [ Links ]
1 We would like to thank the anonymous referee for helpful comments on an earlier draft. The authors also gratefully acknowledge the help of the editor of the journal for tolerating our delayed responses to the comments. All remaining errors, however, are solely ours.
3 Krueger and Aktan (1992) demonstrate the shift in the restrictiveness of import licensing over the 1979-1988 period. They report that the number of commodities subject to any form of licensing fell sharply from 1600 in 1979 to 33 in 1988.
4 As a consequence of restrictive trade regime and the fixed exchange rate policy, the Turkish lira appreciated in real term against the US dollar by 23 percent between 1975 and 1979 (Krueger and Aktan, 1992). In 1980, however, devaluation of TL reached to 144 percent in nominal, giving rise to a 30 percent real devaluation with 100 percent inflation in the same year (see Baysan and Blitzer, 1990).
5 The total value of direct incentives given to exporters reached, on average, 23.4 percent of total exports in 1983 (Baysan and Blitzer, 1990).
6 Table 4 includes the results calculated by using two different weighting. Since the qualitative results for both weighting appear to render the similar interpretation, our analysis is only based on the results of Laspeyres weighting.
7 The numerical value of the share of the trade was calculated from the values in Table 4a. Particularly 22.3 percent was derived from the sum of the share of exports, 20.4 percent, the share of import substitution, 6.6 and the share of import penetration, -4.7 percent.

