


Serviços Personalizados
Journal
Artigo
 texto em
  Inglês (pdf)
 Artigo em XML
 Referências do artigo
 Enviar este artigo por email
Indicadores
-
 Citado por SciELO
 -
 Acessos
Links relacionados
-
 Similares em
SciELO
Similares em
SciELO
Compartilhar

 Permalink
Agricultura, sociedad y desarrollo
versão impressa ISSN 1870-5472
agric. soc. desarro vol.16 no.1 Texcoco Jan./Mar. 2019
Articles
Impact of imports of powdered milk and dairy byproducts on the producer price of cow milk in Mexico
1 Universidad Autónoma de Coahuila (josedejesus.je@gmail.com, adriana_fabela@hotmail.com, sandylopez5@hotmail.com, martinezgomezfrancisco@gmail.com)
In Mexico, dairy activity represents the second most important within the livestock production sub-sector, with 22.8 % of the value of production. In recent years the country has resorted to imports of powdered milk and dairy byproducts which, according to dairy producers, have caused a decrease in the national price of fluid milk produced in Mexico, in turn provoking the bankruptcy and closing of many production units. The objective of this study was to analyze the impact of imports of powdered milk and dairy byproducts on the real producer price of fluid cow milk in Mexico. The methodology used was Multiple Linear Regression. The results confirm the statements by dairy livestock producers and indicate that the imports of powdered milk, yogurt, condensed milk, and “other” cheeses impacted significantly and inversely the real price of fluid milk in Mexico. Based on this, it is recommended to implement measures to reduce the imports of powdered milk and dairy byproducts or, in this case, implement public policy measures that support national producers.
Key words: condensed milk; cheeses; linear regression; yogurt
En México la actividad lechera representa la segunda en importancia dentro del subsector ganadero, con 22.8 % del valor de la producción. En los últimos años se ha recurrido a la importación creciente de leche en polvo y derivados lácteos lo cual, según los ganaderos lecheros, ha ocasionado una disminución del precio nacional de la leche fluida producida en México provocando la quiebra y cierre de gran cantidad de unidades de producción. El objetivo de este trabajo fue analizar el impacto de las importaciones de leche en polvo y derivados lácteos en el precio real al productor de leche fluida de bovino en México. La metodología utilizada fue la Regresión Lineal Múltiple. Los resultados confirman las afirmaciones de los ganaderos lecheros e indican que las importaciones de leche en polvo, yogur, leche condensada y quesos “los otros” impactaron significativamente y de manera inversa al precio real de la leche fluida en México. Con base en lo anterior se recomienda implementar medidas para reducir las importaciones de leche en polvo y derivados lácteos o, en su caso, implementar medidas de política pública de apoyo a los productores nacionales.
Palabras clave: leche condensada; quesos; regresión lineal; yogur
Introduction
Cow milk is a food of basic necessity, of high demand for its high nutritional value. It is considered a basic food in the diet of children, the elderly, sick people and, in general, of the whole population. Humans have taken advantage of it for their diet, using it directly or transforming it to obtain products like cheese, yogurt and butter, among others (Agudelo and Bedoya, 2005).
The global production of cow milk is around 481.5 million tons. The leading milk producing countries and their participation are: United States (19.62 %), India (13.29 %), China (7.74 %), Russia (6.24 %), Brazil (5.46 %), New Zealand (4.44 %) and Mexico (2.44 %) (FAS-USDA, 2015).
Production in the world is obtained under different production systems and with different levels of government support. Some countries record surpluses in their production due to the availability of natural resources, primarily broad surfaces of pastureland that are favorable for extensive livestock production, which allows them to produce at low cost. Australia, Nueva Zelanda, Argentina and Uruguay are found in this group of countries (Santibáñez and Sánchez, 2009). Others obtain their production with considerable government support, including subsidies for production and export. The United States, Japan and the European Union are in this group (Ángeles et al., 2004).
The average annual production of cow milk in Mexico during the 2011-2015 period was 11 019 million liters, with an average annual growth rate of 1.32 %. This production has been insufficient to supply an annual consumption of 13 312 million liters, showing annual deficits of approximately 20 % covered with imports (SIAP-SAGARPA, 2016).
The industry of dairy products is the third most important activity within the branch of the food industry in Mexico (Secretaría de Economía, 2012). In addition, according to Del Valle and Álvarez (1997), dairy activity in Mexico represents the second in importance within the livestock production sector, with 22.8 % of the production value, and it is one of the primary sources of protein supply of animal origin for the country.
Milk production is found in all the states of the Mexican Republic; however, the states that stand out due to their importance are Jalisco (18.93 %), Coahuila (12.11 %), Durango (10.02 %), Chihuahua (9.07 %), Guanajuato (6.99 %) and Veracruz (6.10 %) (SIAP-SAGARPA, 2016).
The production units in Mexico can be grouped in three levels according to their level of technological development: the stabled, which are located in basins and specialized zones in the north and center of the country (like Laguna and Tizayuca); the semi-stabled or family production, which prevails in the temperate zones of the west-center and north (such as the Jalisco highlands); and those of seasonal milking and free grazing, prevailing in the humid, semi-warm and dry regions of the Mexican tropic (Del Valle and Álvarez, 1997).
Although Mexico has abundant natural resources and technology to produce the milk necessary to supply its demand, the policies followed by the government for the sector have increased the imports of powdered milk and dairy byproducts, which place the country presently as the main importer of skim milk at the global level with around 230 thousand annual tons (FAS-USDA, 2015).
At the global level some countries have opted for strengthening the internal production of milk as a means to supply the national demand, while others have opted for imports. Taher et al. (2013) studied these two models by analyzing the cases of Morocco, Tunisia and Algeria in North Africa. The first two countries opted for supporting their internal production, attaining self-sufficiency, while in the case of Algeria it opted for the international market to supply itself, and currently it is one of the greatest world importers of powdered milk. Depending on foreign countries to be supplied generates sensitivity to the availability of the product, as well as to the volatility of international prices.
Mexico has followed different policies throughout time to maintain the supply of this product. Before the decade of the 1990s, the strategy was sustained on the consumption and control of prices and imports of powdered milk at low prices. This limited the development of the national dairy sector and the cost was to discourage investment and production over problems of low profitability; the dairy herds began to depopulate. During the decade of the 1990s the national dairy activity was promoted through new mechanisms such as liberation of the consumer price and government supports; in parallel, the North American Free Trade Agreement (NAFTA) was negotiated which opened the door to imports of powdered milk and dairy byproducts (Del Valle y Álvarez, 1997). The negotiation of NAFTA indicated that by 2008 the market of powdered milk and dairy byproducts in Mexico would be completely tax exempt and without quotas for products from the United States, while Canada did not include its dairy sector in the NAFTA negotiations (Del Valle and Álvarez, 1997).
When contemplating a reduction of the tariffs to imports between member countries, and the elimination of protectionist policies, free trade agreements modify the relative prices of traded goods and affect the competiveness of the companies that trade their products in foreign markets. The direction that trade takes once the treaty is enforced depends on the comparative and competitive advantages of each country (Díaz and Williamson, 1998).
The model of commercial openness in Mexico brought with it a crisis in its livestock production. In relation to the 1991 census by INEGI, 321 973 bovine livestock production units were lost by 2009, both for meat and for dairy; this represents 22 % of the production units that ceased to operate (Cavalloti, 2014).
Various studies in a context of commercial openness have analyzed the impact of dairy imports on local markets. In a study of dairy producers in Chile within the context of the Common South Market (Mercado Común del Sur, Mercosur), it was found that “from the cost analysis, the reduction of tariffs should not have to affect a vast sector of producers that operate under relatively efficient conditions. However, this reduction would impact many producers with high costs, medium-scale and especially small-scale, which would not be in conditions of competing successfully in face of external producers” (Díaz and Williamson, 1998, p. 61).
In an analysis of the dairy sector in Chile, Díaz et al. (2007) also concluded that there is an effect of the international price on the producer price of milk; however, this effect is slow because the local market is a monopsony where there are many milk producers and few buyers where the industry imposes conditions to its suppliers.
Engler and Nahuelhual (2003) state that imported and domestic milk behave as substitutes in the consumption and in the industry, and therefore, both markets are related. The same as Díaz et al. (2007), they agree that in the milk market the industry exerts a monopsony power on the prices and that to prevent the fall of national prices, imports should be stopped and controls should be exerted on the industry.
In a study about the market of dairy products in Peru, Aubron (2006) observes a sharp fall of the producer price of milk as consequence of the growing imports of subsidized milk. However, since 1993 the imports of all dairy products were subjected to payment of a fixed rate, equal to 25 % of the CIF price; these tariffs can explain the decrease of milk imports, substituted by national production.
The objective of this work was to evaluate the impact of the imports of powdered milk and dairy byproducts on the national producer price of fluid milk in Mexico. It stems from the work by Engler and Nahuelhual (2003), where they affirm that imported milk is a substitute for national milk both in the consumption and in the industry; therefore, with higher imports (both by the industry and by the public company Liconsa) less national milk is demanded and with this, the local prices are pressured to decrease. Likewise, the imports of elaborated dairy byproducts, such as cheese, yogurt and industrialized milks, generate a lower demand for national fluid milk which also pressures the prices to decrease.
Methodology
For the analysis of the impact of imports on the milk price, a linear regression analysis was used, which “deals with the study of the dependency of the dependent variable, with regard to one or more explicative variables, with the objective of estimating and/or predicting the mean or average population value of the first in terms of the known values of the latter” (Gujarati, 2004, p. 18).
Lind et al. (2004, p. 470) indicate that “the regression analysis is a technique to express, through an equation, the linear relationship between variables where the aim is to estimate the value of the dependent variable Y based on values of the independent variables X”. For this study the dependent variable is the real producer price of milk and the independent variables are the imports of powdered milk and dairy byproducts, such as cheese, yogurt, condensed milk, among others.
In the regression model it is assumed that there is a linear relationship between a variable Y, which is given the name of dependent variable, and k independent variables, X1, X2,…, XK. Some authors call the independent variables explicative because they are used to explain the variation in Y; they are also known as prediction variables, since they are used to predict Y (Kazmier, 1998).
The model
is known as the Multiple Linear Regression model with k regressors. The parameters βj , j=0, 1,…., k are called regression coefficients. This model describes a hyperplane in the space of k dimensions of the regressor variables Xj. The parameter βj represents the change expected in the response Y per unitary change in Xj when all the other regressor variables Xj (I ≠ j) are kept constant. For this reason, the parameters βj, j = 1, 2,…., k are called partial regression coefficients. In most of the real-world problems the values of coefficients βj are not known and they must be estimated from sample data (Montgomery et al., 2011). In this study the sample includes information of time series, covering the period 1991-2014. The dependent and independent variables with their units of measurement were the following:
Y: Real Producer Price of fluid cow milk (pesos per liter). June base 2012=100 (Dependent variable).
X1: Skim milk powder or pills (thousands of tons) Tariff Fraction 0402.10.01
X2: Whole milk powder or pills. The other (thousands of tons) Tariff Fraction 0402.10.99
X3: Cow milk in hermetic containers (Liters) Tariff Fraction 0401.20.01
X4: Condensed milk (thousands of tons) Tariff Fraction 0402.99.01
X5: Yogurt (thousands of tons) Tariff Fraction 0403.10.01
X6: Fresh cheese (thousands of tons) Tariff Fraction 0406.10.01
X7: Grana or parmigiana cheese, hard or semi-hard (thousands of tons) Tariff Fraction 0406.90.04
X8: Other cheeses (thousands of tons) Tariff Fraction 0406.90.99
X9: Casein (thousands of tons) Tariff Fraction 3501.10.01
X10:National production of fluid cow milk (thousands of liters)
The data of producer price and national milk production were obtained from the System of Agrifood and Fishing Information (Sistema de Información Agroalimentaria y Pesquera, SIAP) from SAGARPA (2016). The producer price that was used was the Mean Rural Price deflated with the National Index of Producer Prices (2012=100). The data of imports of powdered milk and dairy byproducts from 2003 to 2014 were obtained by consulting the Tariff Fraction in the portal of the System of Tariff Information Via Internet (Sistema de Información Arancelaria Vía Internet, SIAVI, 2015) of the Ministry of Economy (http://www.economia-snci.gob.mx), while those from 1991 to 2002 were obtained directly from the “Direction of Information and Statistics of International Trade” of the Ministry of Economy in Mexico City.
The estimation of the model was performed with the method of Ordinary Least Squares (OLS), which consists in minimizing the sum of the squares of the residues, so that the regression line that is defined becomes the one that approaches most the cloud of points observed and, as consequence, the one that best represents it (Levin and Rubin 2010).
The null hypothesis that was tested was H0: β1 = β2 = β3= … = βk = 0 and the alternative is that at least one of the independent variables is different from zero; this is, that at least one of the independent variables included in the model influences the real price of milk.
The procedure of estimation was that of “backward” Regression, beginning the analysis with all the explicative variables, eliminating one by one those that were not significant until keeping those that had a significant effect on the dependent variable.
One of the most common problems in the Regression is the presence of Autocorrelation. The effect of autocorrelation is that the values of the standard error associated to each partial regression coefficient and the standard error of the estimator are underestimated. The result is that the null hypotheses referring to the absence of relations are rejected quite often, and that the intervals of prediction and trust are narrower (more accurate) than what they should be (Kazmier, 1998; Rodríguez and Morar, 2001). To test the hypothesis of non-autocorrelation in the model estimated here, the Durbin Watson (DW) statistic was used. The analysis was carried out with the Statistical Package for Social Sciences (SPSS) version 18.
Results
In this section the results from the study are presented, where in first place an analysis of the behavior of the real producer price is included, as well as the trends of imports of higher volume of dairy byproducts; then, the regression analysis is presented to identify the variables that have influenced the producer price of milk.
Real producer price
Figure 1 presents the behavior of the real producer price of cow milk. The price that was used was the mean rural deflated with the National Index of Producer Prices (June 2012 = 100).
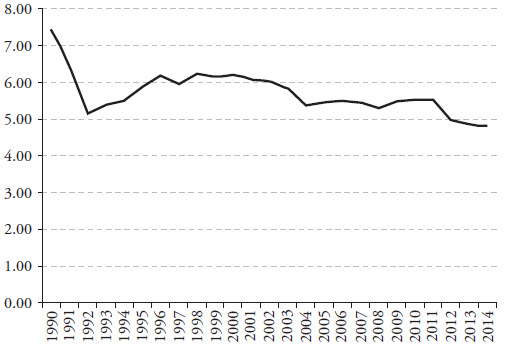
The real price shows an average annual growth rate of -1.59 %. During the period of 1990-2014, the real price decreased from $7.43/liter to $4.81/liter; this is a decrease of 35 %. However, the greatest decrease happened during the period of 1990-1992 when the price of milk, due to government policy, was subject to being controlled; since then it was liberated and shows a recovery, which continued until the beginning of 2000; after this the trend has been to decrease again, pressured by the growing imports of powdered milk and dairy byproducts. This decreasing behavior in real price had already been identified by other authors, such as Ángeles et al. (2004), who analyzed this variable for the period of 1975-2000. This decrease in the real price does not necessarily mean that the profitability of the dairy activity has decreased in this proportion, because the increase in productivity of dairy cattle has partially compensated this decrease.
Skim milk powder (Tariff Fraction 04021001)
The imports of skim milk powder (Tariff Fraction 04021001) were steady until 2005, with highs and lows in an average of 121 thousand tons; however, during 2006 and 2007 the imports were reduced, perhaps because its international price increased substantially. From 2006 to 2014 the imports increased significantly by going in only eight years from 97 thousand to 203.2 thousand tons, that is, an increase of nearly 110 %. If we compare the whole period, from 1991 to 2014, the imports of skim milk powder increased 429 % (Figure 2).
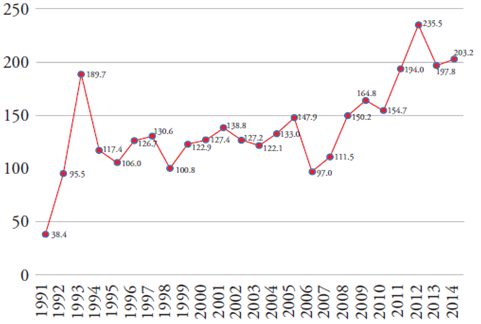
Figure 2 Mexico: Imports of skim milk powder (Tariff Fraction 04021001). Period of 1991-2014. (Thousands of tons).
In recent years, of the total imports, 95 % came from the United States with lower imports from other countries like Canada and France. The imports were carried out during every month of the year with values that fluctuated between 6 and 11 % (SIAVI). In the study by Ángeles et al. (2004), which analyzes a period before this study, it was found that the main supplier was the European Union, which has been displaced by the United States as main supplier to Mexico. This is explainable within the framework of NAFTA, where tariff preferences were given to the United States (Del Valle and Álvarez, 1997), while in the commercial Treaty with the European Union (TLCUEM) dairy products were excluded from a possible tax exemption. The increase in imports in Mexico is also explained because developed countries like the United States and those of the European Union produce a large volume of milk, which is why they end up selling their surplus in the international market with large subsidies (dumping), strongly distorting the product prices in the world markets (Secretaría de Economía, 2012).
Condensed cow milk (Tariff Fraction 04029901)
The imports of condensed cow milk (Tariff Fraction 04029901) show three rather marked periods: 1991-1998, 1999-2004, and 2005-2013 (Figure 3). During the first period the imports remained practically stagnant; during the second period the trend of condensed milk was practically exponential: imports went from 2998 tons in 1999 to 37 800 in 2004, that is, practically 1000 % of increase. However, since 2005 the trend reverts and the imports tend to decrease until reaching, in 2014, 11 2000 tons.
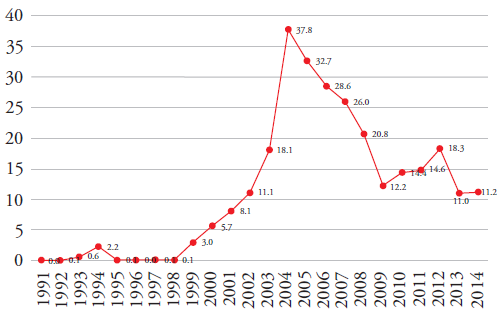
Figure 3 Mexico: Imports of condensed cow milk (Tariff Fraction 04029901). Period of 1991-2014. (Thousands of tons).
It should be mentioned that the imports of condensed milk provided predominantly from Chile (94.47 %), and, to a lesser degree, from the United States. They were carried out during the whole year; however, the months of February and May stood out with values of 15 % of the annual total (SIAVI).
Yogurt (Tariff Fraction 04031001)
The yogurt imports (Tariff Fraction 04031001) show four differentiated periods: 1991-1995, 1996-2002, 2003-2010 and 2011-2014. In the first the imports had a highly significant decrease when going from 5500 tons in 1991 to 1450 in 1995, which is a decrease of 73 %; in the second period the imports increased 130 %; after that a decreasing trend was found, of 59 %, going from 1338 to 837 tons. There is no knowledge about whether this reduction was because of the increase in national production or the decrease in local demand (Espinoza et al., 2014). Since 2011 the imports increased until reaching 1830 tons (Figure 4).
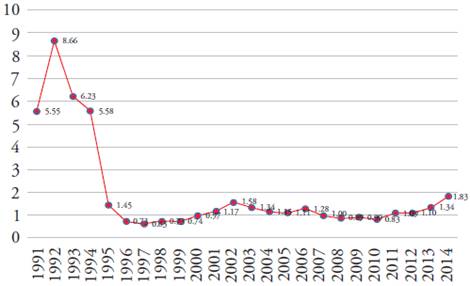
Figure 4 Mexico: Imports of yogurt (Tariff Fraction 04031001). Period of 1991-2014. (Thousands of tons).
The imports of yogurt come in 98.6 % from the United States. The imports were carried out during the whole year with monthly values that recovered in the months of April, June, August and October, with values between 13 and 21 % (SIAVI). In the framework of NAFTA the tax exemption of yogurt was negotiated to 10 years (Del Valle and Álvarez, 1997), which is why this product was tax exempt since 2004, and it is likely that the increase in imports of the last years has been the result of their tariff exemption.
Cheeses (“other”) (Tariff Fraction 04069099)
The imports of cheeses grouped in the “other” fraction (Tariff Fraction 04069099) show a growing trend, almost linear, in the whole period (Figure 5). In 1991, 2140 tons were imported and by 2014 the volume increased to 36,380 tons, that is, an increase of nearly 1600 % in only 24 years. Within the dairy byproducts analyzed in this study, cheese is one of the ones that have shown higher growth in the volume imported.
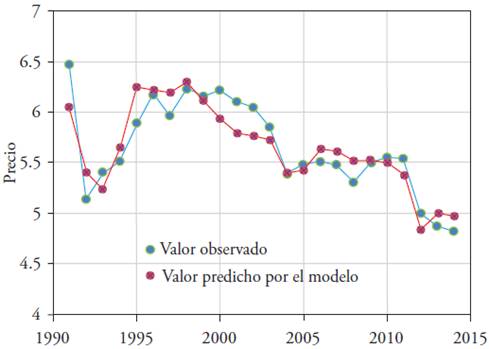
Figure 5 Mexico: Imports of cheeses (“others”) (Tariff Fraction 04069099). Period of 1991-2014. (Thousands of tons).
The origin of the imports of “other” cheeses was focused 97 % in the United States. The imports were carried out during the whole year, with monthly volumes between 6 and 9 %; no seasonality is appreciated (SIAVI).
If these trends in imports continue, the effects for Mexico could be serious because they atrophy the development of this productive activity (Del Valle and Álvarez, 1997).
The estimated model
After analyzing the trends of the variables, the empirical analysis was done. The regression analysis was carried out in stages; first, the dependent variable was run against all the independent ones and then the non-significant variables were eliminated (backward) until reaching the final model.
The final model was left as follows, based on the analysis in the SPSS program (Tables 1, 2 and 3):
Table 1 Summary of the model.
| Modelo | R | R2 | R2 corregido | Error tip. de la estimación | Durbin-Watson |
| 1 | 0.902a | 0.813 | 0.773 | 0.21759 | 1.368 |
aPredictor variables: (Constant), X8, X5, X4, X; bDependent variable: Y.
Table 2 Analysis of variance (ANOVA).
| Modelo | Suma de cuadrados | gl | Media cuadrática | F | Sig. | |
| 1 | Regresión | 3.907 | 4 | 0.977 | 20.631 | 0.000a |
| Residual | 0.900 | 19 | 0.047 | |||
| Total | 4.807 | 23 | ||||
aPredictor variables: (Constant), X8, X5, X4, X1; bDependent variable: Y.
Table 3 Coefficients of regression and their significance.
| Modelo | Coeficientes no estandarizados | Coeficientes tipificados | t | Sig. | ||
| B | Error típ. | Beta | ||||
| 1 | (Constante) | 6.955 | 0.193 | 36.000 | 0.000 | |
| X1 | -0.005 | 0.002 | -0.445 | -3.147 | 0.005 | |
| X4 | -0.014 | 0.005 | -0.349 | -2.941 | 0.008 | |
| X5 | -0.125 | 0.024 | -0.586 | -5.182 | 0.000 | |
| X8 | -0.017 | 0.006 | -0.433 | -2.682 | 0.015 | |
aDependent variable: Y.
The Coefficient of determination R2 adjusted by degrees of freedom of 0.773 (Table 1) indicates a very good level of adjustment: 77.3 % of the changes in the real price of milk are explained by the four independent variables of the final model. The null hypothesis H 0: β1 = 2= β3 = … = βk = 0 was rejected (p<0.05), which indicated that at least one of the independent variables was different from 0 (Table 2); this is, that at least one of the independent variables included in the model influenced the real producer price of milk. Once the global null hypothesis was rejected, the individual test of the independent variables (H0: βi = 0) was carried out, finding that the null hypothesis was rejected in four variables, with significance (p<0.05) in the variables X1, X4, X5 and X8 (Table 3).
From this, the final model was the following.
Final model
where
The negative signs of the coefficients, their magnitude and significance provide empirical evidence of what Mexican dairy producers have argued for many years: that imports of powdered milk and dairy byproducts have caused the decrease of the milk price and the bankruptcy of many dairy production units.
To validate the model, Figure 6 presents the observations of the database with which the model generates (values observed vs. values predicted by the model).
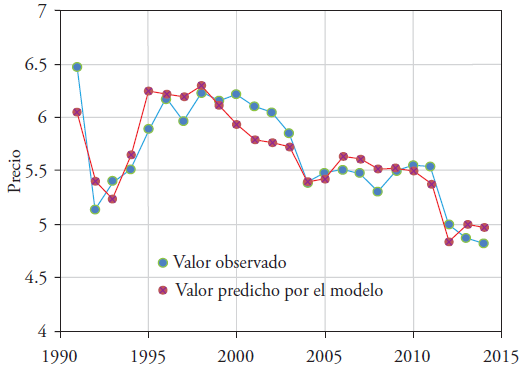
The model replicates with rather good approximation the real values observed, implying that the independent variables of the model explain, in a high percentage, the changes that have been found in the real producer price of cow milk in Mexico.
The hypothesis of non-autocorrelation was also tested. Table 1 shows that the Durbin-Watson (DW) statistical value is 1.368. This value was compared with the critical values (value of the probability tables), which were obtained based on K = 4 (independent variables) and a sample of 24 observations. The values obtained were dL = 1.013 and dU = 1.775, which indicated an absence of evidence of autocorrelation. Since the hypothesis of non-autocorrelation was not rejected, it was valid to apply the parametric statistical tests t-Student and Fisher F, to evaluate the significance of their parameters.
The results from this study agree in general with those obtained in other studies. Based on an analysis of the impacts on Chilean dairy producers, Díaz and Williamson (1998) concluded that when opening their market to dairy imports of countries in the Mercosur, such as Argentina and Uruguay which have comparative advantages, they affected strongly small-scale producers in particular, who left the because they could not compete with the low prices of milk derived from the increase of imports.
Engler and Nahuelhual (2003), based on a cointegration analysis, and Díaz and Modrego (2007), based on an equation of price transmission, concluded that imports of dairy products in Chile have provoked a deterioration of the national prices. Although with a different methodology, their results agree with this study and also mention that producers suggest appealing to the government for it to grant them protection measures against dairy imports.
In an analysis of the impact of milk imports in Mexico for the period of 1975-2000, with the use of a linear regression econometric model, Ángeles et al. (2004) found that the great flow of imports favored for the national price of milk to decrease, causing a decrease in the producers’ income. Although the period of analysis is different than this study, it confirms what the model estimated here reflects, which is the pressure of imports on the national producer price of milk. A difference between both studies is that in this study it was used in INPP to deflate the producer price, while Ángeles et al. (2004) used the INPC. The INPP was considered to be more appropriate in this study because the price of milk is compared against what the producer purchases of inputs for the cattle and not against the goods and services that he and his family consume. In any case, the effects should not be very different, since both series are quite correlated throughout time.
In an analysis about the dairy market in Peru, Aubron (2006) found an immediate response in the national production to the application of tariffs on imports. “Since 1993 the imports of all dairy products are subjected to payment of a fixed rate equal to 25 % of the CIF price and a variable rate applied as far as the FOB price is lower than a meta price determined twice a year; this system of price band ensures the national production a relative protection in face of imports” (Aubron, 2006, p. 127). The application of this measure increased the national production between 800 thousand and one million 200 thousand tons, that is, 50 %. This experience in the Andean country reflects the relationship of imports with the national production.
The Inter-American Development Bank (2000), in a study that covered the decade of the 1980s and the 1990s on the dairy and textile sectors in the Andean Community of Nations (Comunidad Andina de Naciones, CAN), which includes Venezuela, Colombia, Peru, Bolivia and Ecuador, found an important increase in the imports of dairy products to the region, with powdered milk, evaporated milk, cheeses and whey standing out. Like in this study, they found the decrease of commercial protection to be a determinant factor for imports, but they also mentioned other important factors, such as the increase of per capita income of the population in the region and the overvaluation of the exchange rate.
In other countries like China, the significant increase in the imports of powdered milk and dairy byproducts is explained by a combined effect of commercial openness under the rules of the World Trade Organization (WTO) and an increase in the per capita income (Wang et al., 2010). A similar case is that of Algeria in North Africa, where urbanization and commercial openness explain the increases in dairy imports (Taher et al., 2013). In the case of Mexico the imports are explained more by the commercial openness, given that the real income of the population has decreased in recent decades. However, in a study about the commerce of powdered milk between Mexico and the United States, some authors like Jaramillo and Sarker (2010) indicate that “the exchange rate and its volatility have statistically significant effects on the commercial flows of powdered milk between the two countries” (p. 242). In China other factors have been explored, with possible impact on the dairy imports, such as the application of quality standards on powdered milk and yogurt, and no effect has been found (Sun et al., 2014).
The results from this study provide empirical evidence of the impact of imports of powdered milk and dairy byproducts on the national market. The literature of studies in other countries, particularly in Latin America, reports similar findings. This confirms the demands from Mexican milk producers, who for several decades have been requesting from the ministries of Agriculture and Economy to stop the imports of powdered milk and dairy byproducts.
Conclusions
In this study an analysis was made of the trends in imports of powdered milk and dairy byproducts, and their impact on the producer price of fluid cow milk in Mexico for the period of 1991-2014. A significant increase was observed in the imports of almost all tariff fractions.
The Linear Regression analysis indicated that the variables that have exerted greatest pressure on the decrease of the price of fluid milk in Mexico have been skim milk powder, condensed milk, yogurt and “other” cheeses.
If the imports of large amounts of powdered milk and dairy byproducts continue, the price of fresh cow milk in the national territory will continue to be affected, causing the bankruptcy of more producers. Therefore, it is suggested to take some tariff and non-tariff measures that limit these imports, generating higher demand for the national product. At least the national company of social supply, Liconsa, should substitute the foreign purchases of powdered milk with purchases from national producers. On the other hand, it is suggested to broaden government programs of support to producers who make dairy livestock production a competitive, profitable activity that generates employment and is capable of supplying the demand of this food in our country.
Additional studies are required to analyze up to what point the increase in productivity of dairy livestock production (liters/cow) has compensated the decrease in the real price of milk.
The public policy of commercial openness to imports of powdered milk has benefited the industry that uses it as raw material, and also the commercial sector that distributes dairy byproducts in detriment of the national milk suppliers.
Literatura citada
Agudelo Gómez, Divier Antonio, y Oswaldo Bedolla Mejía. 2005. Composición nutricional de la leche de ganado vacuno. Revista Lasallista de Investigación. 2(1): 38-42. [ Links ]
Ángeles Montiel, Raquel, J. Saturnino Mora Flores, Roberto García Mata, y Miguel A. Martínez Damián. 2004. Efecto de las importaciones de leche en el mercado nacional del producto. Revista Agrociencia. 38(5):555-562. [ Links ]
Aubron, Claire. 2006. Productores Andinos de queso artesanal y liberalización del mercado de los lácteos en Perú. Revista Debate Agrario No. 40:119-139. [ Links ]
Banco Intermericano de Desarrollo (BID). 2000. El impacto sectorial del proceso de integración subregional en la comunidad Andina. ISBN: 950-738-103-1. Buenos Aires. 184 p. Recuperado de: https://books.google.com.mx/books?hl=es&lr=&id=dmOO5eRipncC&oi=fnd&pg=PA1&dq=impacto+de+las+importaciones+de+leche&ots=khu46zKUmB&sig=J1J1TFZGXfbDGO_oV62OJRtk_yY#v=onepage&q=impacto%20de%20las%20importaciones%20de%20leche&f=false [ Links ]
Cavallotti Vázquez, B. 2014. Ganadería bovina de carne y leche. Problemática y alternativas. El Cotidiano, 188: 95-101. [ Links ]
Del Valle Rivera, María del Carmen, y Adolfo G. Álvarez Macías. 1997. La producción de leche en México en la encrucijada de la crisis y los acuerdos del TLCAN. Ponencia presentada en el Congreso del Latin American Studies Association (LASA). Guadalajara, Jalisco, México del 17 al 19 de Abril de 1997. [ Links ]
Díaz, Carlos Augusto, y Carlos Williamson. 1998. Acuerdos comerciales y competitividad: evidencia del sector lácteo chileno. Revista Abante, 1(1):59-88. [ Links ]
Díaz N., Oscar Melo, y Félix Modrego. 2007. Dinámica de transmisión de precios y cambio estructural en el sector lácteo chileno. Economía Agraria. 11(1): 12-23. [ Links ]
Engler, Alejandra, y Laura Nahuelhual. 2003. Influencia del mercado internacional de lácteos sobre el precio nacional de la leche: un análisis de cointegración. Agricultura Técnica (Chile). 63(4):416-427. [ Links ]
Espinoza Arellano, J. J., Georgel Moctezuma López, Ángeles Carrillo Muñoz, Leonardo Rocha Valdés, Rafael Ávila Cisneros, y Manuel Medina Elizondo. 2014. Importaciones de leche de vaca en polvo y derivados lácteos. Ponencia en el XXVII Congreso Internacional de Administración de Empresas Agropecuarias. San José del Cabo., BCS del 25 al 28 de Mayo. pp. 1-11 [ Links ]
FAS-USDA (Foreign Agricultural Service. United States Department of Agriculture). 2015. Dairy: World Markets and Trade. Recuperado de: Recuperado de: http://apps.fas.usda.gov/psdonline/circulars/dairy.pdf . (Consultado: Junio de 2016). [ Links ]
Gujarati, Damodar N. 2004. Econometría. Ed. McGraw-Hill Interamericana Editores. Cuarta edición. Traducido de la cuarta edición en Inglés de la obra Basic Econometrics. México, D.F. 972 p. [ Links ]
Jaramillo-Villanueva, J. L., y R. Sarker. 2010. Los movimientos en el tipo de cambio y el comercio de leche en polvo entre México y Los Estados Unidos. El Trimestre Económico, 87(305):219-246. [ Links ]
Kazmier, Leonard J. 1998. Estadística aplicada a la administración y a la economía. Ed. McGraw Hill, serie Schaum. Tercera edición. México, D.F. [ Links ]
Levin, Richard I., y David S. Rubin. 2010. Estadística para Administración y Economía. Ed. Pearson. 7ª edición revisada. México, D.F. 799 p. [ Links ]
Lind, Douglas A., William G. Marchal, y Robert D. Mason. 2004. Estadística para Administración y Economía. Ed. Alfaomega. 11a edición. México, D.F. 830 p. [ Links ]
Montgomery, Douglas C., Elizabeth A. Peck, y Geoffrey Vining. 2011. Introducción al Análisis de Regresión Lineal. Ed. CECSA. Tercera edición en inglés, primera en español. México, D.F. 612 p. [ Links ]
Rodríguez Jaume, María José, y Rafael Morar Catala. 2001. Estadística Informática: casos y ejemplos en el SPSS. Ed. Universidad de Alicante, servicio de publicaciones. Primera edición. Alicante, España. 310 p. [ Links ]
Santibáñez S., Juan José, y María Alejandra Sánchez A. 2009. Transnacionalización del mercado de lácteos y vía nacional del desarrollo. Los casos de México y Japón. Revista Polis, 5(2): 155-200. [ Links ]
Secretaría de Economía. 2012. Análisis del sector lácteo en México. Dirección General de Industrias Básicas. México, D.F. 29 p. recuperado de: http://www.economia.gob.mx/files/comunidad_negocios/industria_comercio/informacionSectorial/analisis_sector_lacteo.pdf [ Links ]
SIAP-SAGARPA (Sistema de Información Agroalimentaria y Pesquera. Secretaría de Agricultura, Ganadería, Desarrollo Rural, Pesca y Alimentación). 2016. Boletín de leche Enero-Marzo de 2016. Recuperado de: Recuperado de: http://www.siap.gob.mx/wp-content/uploads/boletinleche/B_de_Leche_enero-marzo_2016.pdf . (Consultado: Junio de 2016). [ Links ]
SIAVI (Sistema de Información Arancelaria vía Internet). 2015. Secretaría de Economía. México, D.F. Sitio Web: http://www.economia-snci.gob.mx/ [ Links ]
Sun, Dingqiang, J. Huang, and J. Yang. 2014. Do China´s food safety standards affect agricultural trade? The case of dairy products. China Agricultural Economic Review, 6(1): 21-37. [ Links ]
Taher Sraïri, Mohamed, Mohammed Tahar Benyoucef, and Khemais Kraiem. 2013. The dairy chains in North Africa (Algeria, Morocco and Tunisia): from self sufficiency options to food dependency? SpringerPlus, 2:162 [ Links ]
Wang, Qingbin, R. Parsons, and G. Zhang. 2010. China´s dairy markets: trends, disparities, and implications for trade. China Agricultural Economic Review, 2(3): 356-371. [ Links ]
Received: September 2016; Accepted: September 2017
 Este es un artículo publicado en acceso abierto bajo una licencia Creative Commons
