


Services on Demand
Journal
Article
 text in
  English (pdf)
 Article in xml format
 Article references
 Send this article by e-mail
Indicators
-
 Cited by SciELO
 -
 Access statistics
Related links
-
 Similars in
SciELO
Similars in
SciELO
Share

 Permalink
Agricultura, sociedad y desarrollo
Print version ISSN 1870-5472
agric. soc. desarro vol.16 n.1 Texcoco Jan./Mar. 2019
Articles
Maize small-scale agroecosystems in the High Huasteca Region of Veracruz: economic-energetic efficiency and poverty
1 Instituto Tecnológico Superior de Tantoyuca. (rubenpurroy2000@gmail.com, ove.2287@ymail.com, herqui2002@hotmail.com, delapios77@hotmail.com, meza67julio@hotmail.com, las_americas08@hotmail.com, francisca_34@hotmail.com)
The low productivity in maize small-scale agroecosystems (SAES) is associated to low income, which influences the continuation of families in conditions of poverty. Therefore, the relationship between the level of poverty, the economic efficiency, and the efficient use of energy in maize SAES was evaluated. The information was collected through structured interviews applied to maize producers from 17 communities in Tantoyuca, Veracruz. Multivariate grouping techniques were applied to analyze the data, as well as the k-mean technique; variance analyses and means tests were carried out to understand the difference between groups and the canonic correlation to identify the indicators of economic-energetic efficiency and of productivity that contribute to surpass the Minimum Welfare Line (MWL). Three types of SAES for maize production are identified: Improved Traditional, Traditional, and Subsistence Traditional. A significant difference was found (p<0.05) between the variables studied in the three SAES. Only the producers of the Improved Traditional SAES reach the MWL. By increasing the productivity of the SAES, the economic and energetic efficiency increase. Thus, the producers with low maize yields prefer to trade it to obtain income to satisfy needs of the family.
Key words: maize; Minimum Welfare Line (MWL); energy; productivity
La baja productividad en pequeños agroecosistemas (PAES) de maíz se asocia a bajos ingresos, lo que influye en la permanencia de familias en condiciones de pobreza. Por tal motivo se evaluó la relación entre el nivel de pobreza, la eficiencia económica y el uso eficiente de la energía en PAES de maíz. La información se colectó a través de entrevistas estructuradas aplicadas a productores de maíz de 17 comunidades de Tantoyuca, Veracruz. Para analizar los datos se aplicaron técnicas multivariadas de agrupación y la técnica de k-media; se realizaron análisis de varianza y pruebas de medias para conocer la diferencia entre grupos y correlación canoníca para identificar los indicadores de eficiencia económica-energética y de productividad que contribuyen a superar la Línea de Bienestar Mínimo (LBM). Se identificaron tres tipos de PAES para la producción de maíz: Tradicional Mejorado, Tradicional y Tradicional de Subsistencia. Se encontró diferencia significativa (p<0.05) entre las variables estudiadas en los tres PAES. Solo los productores de los PAES Tradicional Mejorado alcanzan la LBM. Al incrementarse la productividad del PAES aumenta la eficiencia económica y la energética. Así, los productores con bajos rendimientos de maíz prefieren comercializarlo para obtener ingresos para satisfacer necesidades de la familia.
Palabras clave: maíz; Línea de Bienestar Mínimo (LBM); energía; productividad
Introduction
In 2016, 5 242 845 ha of maize (Zea mays L.) were sown in Mexico, in rainfed agricultural zones, whose average yield was 1.906 t ha-1 (SIAP-SAGARPA, 2016); the main destination of this production is for auto-consumption, which in turn is associated to low yields that translate into the family having low capacity to achieve the minimum welfare line, keeping small-scale producers in conditions of poverty (Dixon and Gulliver, 2001; González and Meneses, 2015). The state of Veracruz is not exempt of this situation, since in most of its surface maize cultivation is related to high indices of poverty, which is corroborated when observing that the municipalities with highest percentage of ejido lands that grow maize have the highest poverty indices. In addition, a high proportion of the agricultural production units do not participate in the sale of the product, since they destine the total of their product to auto-consumption (Etchevers et al., 2016; Salazar et al., 2016).
In this sense, for 2015, SIAP-SAGARPA reported a national maize production of 24.69 million tons, of which 4.91 % was contributed by the state of Veracruz (the municipality of Tantoyuca contributed 0.06 %), which has a high degree of marginalization that is evidenced by having a marginalization index of 1.183 (SIAP-SAGARPA, 2016; CONAPO, 2016).
Romero et al. (2013) related the degree of marginalization (social factor) and the agricultural production (economic factor) of the municipalities of the state of Veracruz, reporting that there is a correlation between the levels of production and the marginalization indices. In this sense, the municipalities with the lowest marginalization index are those where products like sugarcane (Saccharum officinarum L.) and pineapple (Ananas comosus L.) are grown, compared to those where maize or bean (Phaseolus vulgaris L.) are cultivated, and which show higher marginalization (De Ita et al., 2016).
Because of this, the objective was to evaluate the relation between the level of poverty, the economic efficiency, and the efficient use of energy in maize small-scale agroecosystems in 17 communities of the municipality of Tantoyuca in the northern region of the state of Veracruz, Mexico.
Materials and methods
The municipality of Tantoyuca is located in the high Huasteca region in Veracruz, between parallels 21° 09’ and 21° 21’ of Latitude North and meridians 97° 56’ and 98° 07’ Longitude West, with an altitude between 10 and 500 m and a surface of 1 303.25 km2 (INAFED, 2002). The municipality has three types of climates: warm sub-humid with summer rains (Aw2), which is of higher humidity (54 %), warm sub-humid with summer rains (Aw1) of medium humidity (45 %), and warm humid with abundant summer rains (Aw0), with mean annual temperature between 22 and 26 °C (García, 2004).
The study units were the small-scale agroecosystems (SAES) where maize was produced in the municipality of Tantoyuca. For this purpose, 17 communities were selected, which resulted in a sample framework of 850 small-scale producers. Later, the size of the sample was determined with the method of random sampling (Scheaffer et al., 1987), resulting in a sample of 147 producers with whom a structured interview was carried out to obtain general data about the size of the plot, the number of family members that depend on the SAES, as well as data inherent to the process of maize sowing, identifying the inputs (agricultural supplies, machinery and workforce) and outputs (production and workforce) of the SAES to later convert them into energy values through the conversion factors (Purroy-Vásquez et al., 2016 and Valdés et al., 2009).
Variables analyzed
Net annual income per hectare (ha) of the SAES (Inetha)
The net annual income per hectare of the SAES was determined, using the total income per ha (Ingtoha) and the total production costs per ha (Ctpha) of the i-th activity carried out in maize production. Later, the difference between these was calculated to obtain the net annual income per ha, which was divided by 365 to determine the daily value with the aim of comparing it with the official minimum wage for the region according to the National Commission on Minimum Wages (Comisión Nacional de los Salarios Mínimos, CONASAMI, 2016). All the values obtained were expressed in Mexican pesos.
Net annual energetic income per ha of the SAES (Inet∆ha)
To determine the Inet∆ha the total energy production per ha (pro∆ha) was calculated for the i-th activity carried out in the productive process of maize and the total energy applied (fertilizer and man-hours) per ha (inv∆ha), in Mega Joules (MJ), for the i-th activity carried out in the productive process of maize. For this purpose, the production and total investment per ha in each SAES was determined, converting it into energy values with the conversion factors to then apply the subtraction (Mora-Delgado et al., 2007 and Pimentel, 1993).
Economic efficiency per hectare (Eeha)
The indices of economic efficiency allow identifying the yield of the resources used in the productive process. It was calculated by dividing the sum of the total gross annual income per hectare (Ingtoha) generated by the sale of maize, by the sum of the total production cost per hectare (Ctpha) for the i-th activity carried out in the productive process of maize (Purroy-Vásquez et al., 2016).
Efficiency in the use of energy per hectare (EΔha)
The efficiency in the use of energy per hectare (EΔha) determines the level of management of energetic resources within the productive processes in the SAES. For its calculation, the sum of the total energy production per hectare (PtΔha) generated in the maize productive activity (grain production in MJ), was divided by the sum of the energy invested (fertilizer and man-hours in MJ) per hectare (invΔha) in the i-th productive activity of maize in a period of one year (Purroy-Vásquez et al., 2016).
Productivity
It is understood as the relation between the production obtained by a system of production or services and the resources used to obtain it. The determination of economic and energetic productivity of the systems is suggested through indicators, as described next:
Indicators of economic productivity (Ipreag)
Economic productivity allows us to determine the productive behavior of the SAES (Table 1) in pesos ($) in relation to units of work ($ Man-hours -1) and energy ($ MJ-1).
Table 1 Variables used to calculate the indicators of economic productivity of the SAES (Purroy-Vásquez et al., 2016).
| Definición | Variable | Sub-variables | Medición |
| Productividad económica por unidad de energía invertida en el PAES |
|
Peha: Productividad económica del agroecosistema por hectárea. Δinvha: Total energía invertida por hectárea en la i-ésima actividad. |
$ MJ-1 |
| Productividad económica del trabajo en el PAES |
|
Peha: Productividad económica del agroecosistema por hectárea. Hha: Horas hombre por hectárea en la i-ésima actividad (en actividades manuales). |
$ hh-1 |
Indicators of energetic productivity (IprΔagr)
Energetic productivity allows defining the productive behavior of the SAES (Table 2) in Mega Joules (MJ). The methodology proposed by Denoia et al. (2006) was used for its determination, calculating the energetic productivity per unit of work (MJ Man-hours -1) and the monetary (MJ $-1).
Table 2 Variables used to build the energetic productivity index of the SAES (Purroy-Vásquez et al., 2016).
| Definición | Variable | Sub-variables | Medición |
| Productividad energética por costo de producción del PAES |
|
PtΔha= Producción total de energía por hectárea invha = Inversión total por hectárea de la i-ésima actividad |
MJ $-1 |
| Productividad energética del trabajo en el PAES |
|
PtΔha= Producción total de energía por hectárea Hha =Horas hombre por hectárea en la i-ésima actividad (en actividades manuales). |
MJ hh-1 |
Auto-consumption
For auto-consumption (Ac), the definition by Leite (2004) was used, which mentions that the study of auto-consumption is limited exclusively to the production of foods; that is, the part of agricultural and livestock production destined to feeding the family members and animals, deducting from this production the parts relative to commercialization, donation or loss. In its calculation, the total of the product and byproducts obtained from the SAES are quantified, and from this amount the total of the product destined to commercialization was subtracted, and the result was converted into percentage (Gallardo-López et al., 2002; Purroy-Vásquez et al., 2016).
Percentage of coverage of the minimum welfare line
To determine the proportion of coverage of the minimum welfare line (Pcober), first the cost of the Normative Basket of Essential Necessities (Canasta Normativa de Satisfactores Esenciales, CNSE) was calculated through the linear equation developed by Marín (2002) and adjusted by Boltvinik and Marín (2003) for the calculation of the cost of the variables family goods (BF) and individual goods (BI) (both by their initials in Spanish), based on the requirements of the General Coordination of the National Plan for Depressed Zones (Coordinación General del Plan Nacional De Zonas Deprimidas, COPLAMAR), where all the essential necessities required by a household are considered. For the calculation, the costs equivalent to those of an adult male are considered as unit of reference; thus, for an adult female it is 0.81; a boy, 0.58; a girl, 0.54; a male baby, 0.43; and a female baby, 0.43.
where CNSE: Cost of the Normative Basket of Essential Necessities; ae: Sum of units of an equivalent adult; p: number of people in the household. *The constant values are updated until June 2016.
Then the calculation was about to what proportion the net annual income generated in agriculture and livestock activities in the SAES allows each family to reach or surpass the minimum welfare line.
The net agricultural and livestock income (Inetoagr) was calculated by totalizing the gross income, generated from agricultural and livestock activities carried out in the SAES, including the Ac and, next, the total costs of agricultural and livestock activities was subtracted (Purroy-Vásquez et al., 2016).
Statistical analysis
To determine the types of SAES, the following variables were analyzed: net economic income, net energetic income, economic efficiency, energetic efficiency, indicators of economic productivity, and indicators of energetic productivity. Multivariate grouping techniques were applied. First a tree diagram or dendrogram was made, using agglomerative hierarchical grouping (Chalate-Molina et al., 2010; Purroy-Vásquez et al., 2016), using Euclidian distances and the algorithm of complex linking. To characterize these groups the k-mean technique was applied, and then variance analysis and means tests (Tukey, p<0.05) were performed to understand the statistical difference between groups.
Later the multivariate technique of canonic correlation was used, with the aim of understanding which of the indicators of energetic economic efficiency and of productivity of the SAES contribute to surpass the minimum welfare line (MWL). The independent variables or of efficiencies were: surface, energetic efficiency, economic efficiency, energetic productivity per money invested, economic productivity per energy invested, work productivity per energy invested, and work productivity per money invested. The dependent or social variables were: proportion of coverage of the minimum welfare line and of auto-consumption. For all the analyses, the statistical software Statistica® version 6 (Stat-Soft Inc, 2003) and Microsoft Office Excel 2007® were used.
Results and discussion
Types of SAES
Resulting from the conglomerate analysis, three groups of SAES were identified, which, according to their characteristics of technological level and maize productivity, were named: Improved Traditional (TM=2.04 %), Traditional (T=27.21 %) and Subsistence Traditional (TS=70.80 %). Based on this classification, significant differences were found (P<0.05) in the variables analyzed (Inetha, Inet∆ha, Eeha, E∆ha, Ipreag and Ac), except in the percentage of coverage of the minimum welfare line (Figure 1). The distance at which the cut was made to define the groups was of 9000.

Description of SAES groups
Three SAES were identified, which were classified as Improved Traditional (TM), Traditional (T), and Subsistence Traditional (TS) (all by initials in Spanish). In the TM the age of producers in these SAES is 78±3.74. All 100 % of the producers sow in the Tonalmil period (Huasteco name), which covers the months of November to December, harvesting in April. The surface of the TM SAES is 1.67±0.37 ha, with a production of 7.4±1.7 t ha-1 of maize; this production is attributed to the use of improved maize seeds, the use of agrichemicals, and a population density of 74000±600 plants ha-1, which are obtained with sowing carried out at a distance of 50 cm between furrows, 27 cm between plants and 3.8 to 4 plants per linear meter, in accordance with what was reported by Rincón-Sánchez et al. (2014), who mention that the density of plants with hybrid maize must be 60 000 to 80 000 plants ha-1, obtaining a grain production that exceeds the national average of 2.4 t ha-1 of maize for summer-spring rains (SIAP-SAGARPA, 2017). This agrees with what is reported in the literature, where it is indicated that by applying adequate technological packages it is possible to increase the productivity of agroecosystems (Damián et al., 2007; Sanclemente et al., 2012; Uzcanga et al., 2015). This productivity impacts directly the values of Inetha, Inet∆ha and Eeha (Table 3), in addition to having an influence on the efficient use of energy per ha (E∆ha), the economic productivity per MJ invested (Pe∆), the economic productivity per work invested (Pet), the energetic productivity per money invested (P∆$), and the energetic productivity per work invested (P∆t). These results agree with those reported by Tobasura et al. (2012), which indicate that there is a direct relation between energetic and economic productivity, where it is confirmed that with a higher production the energetic productivity increases.
Table 3 Indicators of efficiency and productivity of the SAES (TM, T and TS); auto-consumption and percentage of coverage of the minimum welfare line of families of producers are included.
| Unidad | Variables | Tipos de PAES | ||
| Tradicional mejorado | Tradicional | Tradicional de subsistencia | ||
| $ ha-1 | Ingreso neto económico por ha (Inetha)** | 39 412.17±11 685.64a | 7883.84±3904.89b | 2410.05±823.59c |
| MJ ha-1 | Ingreso neto energético por ha (InetΔha)** | 76 462.32±19 654.08a | 13 157.64 ± 8447.91b | 5909.00±4836.70c |
| Índice | Eficiencia económica por ha (Eeha)** | 9.72±2.76a | 2.99 ± 1.25b | 1.37±0.90c |
| Índice | Uso eficiente de la energía por ha (EΔha)** | 5.19±2.25a | 1.84 ± 0.56b | 0.74±0.31c |
| ($ MJ-1 | Productividad económica por MJ invertido (PeΔ)** | 21.27±8.64a | 9.69±6.61b | 1.05±4.19c |
| $ hh-1 | Productividad económica por trabajo invertido (Pet)** | 2.83±1.08a | 0.56±0.28b | 0.06±0.17c |
| MJ $-1 | Productividad energética por dinero invertido (PΔ$)** | 54.50±15.17a | 18.08±8.01b | 8.49±4.92c |
| MJ hh-1 | Productividad energética por trabajo invertido (PΔt)** | 17.46±4.70a | 5.16 ± 1.51b | 2.14±0.89c |
| % | Autoconsumo (Ac)** | 50.81±48.79a | 71.59±26.05b | 84.63±23.40c |
| % | Porcentaje de cobertura de la línea de bienestar mínimo (Pcober) | 40.00±21.0a | 8.0±6.0a | 5.0±1.0a |
*Significant difference; **Highly significant differences.
Equal letters in the line are part of the same group (Tukey).
In the SAES (TM), 100 % of the producers use 50.85±8.79 % of the production for their consumption and therefore achieve certain degree of security. These results differ from those reported by Romero et al. (2016), who indicate that with a higher maize productivity, less percentage is destined to auto-consumption. For the case of the study region the percentage destined to auto-consumption is due to the cultural rooting that these communities have for maize, as Martínez et al. (2006) indicate in a study about characterization of the diversity and participative selection of maize prospects in Chiapas, Mexico.
The traditional group (T) is constituted by 27.21 % of the SAES studied. The age of the producers that manage these SAES is 57.15±14.88 years. Of the total, 95.19 % sows during the period of November-December, harvesting in April. They have a surface of 1.26±0.55 ha, with a production of 2.25±0.74 t ha-1 of maize; this production is similar to the national average. The use of some agricultural practices is observed, such as weed control, low fertilization, low population density of 41 000±300 plants ha-1 that are obtained with sowing carried out at a distance of 80 cm between furrows, 30 cm between plants and 3.3 plants per linear meter, in addition to the use of native seeds. The results found in these SAES are similar to those reported by various authors (García et al., 2013; Damián et al., 2015; Turiján et al., 2012), who agree that by not applying a technological package in maize sowing, the crop’s yield is low.
In relation to the behavior of the variables: net economic income per ha (Inetha), net energetic income per ha (Inet∆ha), economic efficiency per ha (Eeha), efficient use of energy per ha (E∆ha), economic productivity per MJ invested (Pe∆), economic productivity per work invested (Pet), energetic productivity per money invested (P∆$), energetic productivity per work invested (P∆t), has mean values (Table 3), which is a result of the low yield of native maize grains compared to what is obtained with improved varieties and with the application of adequate technological packages.
The subsistence traditional group (TS) is constituted by 70.75 % of the SAES studied. The age of the producers who manage these SAES is 57.79±13.49 years. Of them, 87.50 % sow in the period of November to December, harvesting in April (Tonalmil); the rest sow twice a year (Rainfed and Tonalmil). They have a surface of 1.01±0.39 ha, with a production of 0.919±0.397 t ha-1 of maize; the population density and the distances between planting are the same as the traditional; however, 58.80 % less production is obtained per ha. The use of some agricultural practices was identified, such as manual weed control, without pest control or use of fertilizer and with the use of native maize seeds, which is obtained from the sowing from the past cycle. This low production of rainfed maize is also reported by Damián et al. (2014) and De Ita et al. (2016), who indicate that this productive condition is because small-scale producers do not have access to technological packages that adapt to the agroclimate and cultural conditions of the region where they are located; in addition, something to take into account is that native maize is of low yield (between 0.66 and 1.673 t ha-1) in plant densities between 26 000 and 36 000 plants ha-1 and under conditions of low or very low technology (Luna and Gaytán, 2001; Ayala-Garay et al., 2013).
Concerning the behavior of all the variables in the SAES (TS) analyzed in Table 3, it was found that these have very low levels, which agrees with what was exposed before about the low productivity in maize grains, considering that, according to Risoud and Chopinet (1999), the energetic efficiency of a farm is the relation between the energy produced and the sum of all the energy used directly and indirectly, which depends on the productivity in maize grains. The values of economic efficiency and efficient use of energy were 1.37±0.90 and 0.74±0.31, respectively; these values are similar to those reported by Guevara et al. (2015) in mono-culture maize systems.
Variables that determine the proportion of coverage (Pcober) of the minimum welfare line (MWL) and auto-consumption
The TM group obtains net annual income per ha of $39 412.17±11 685.64 ha-1, which is equivalent to a net daily income per ha of $ 107.98±32.01día-1, when compared to the minimum wage that is $ 92.32 day-1 for 2016. Based on this information we can determine that these producers have an income 14.50 % higher than the official minimum wage (CONASAMI, 2016). All 100 % of the TM producers (2 % of the total producers surveyed) obtained, through maize production, income that allow them to surpass the minimum welfare line in 40±21 %.
The canonic correlation showed that there is a significant correlation between the two groups of social or dependent canonic variables, and the independent ones, explaining 75 % of the variability. The canonic weights of the first canonic correlation point out that all the variables have high correlation, except the auto-consumption variable for this group (Figure 2).
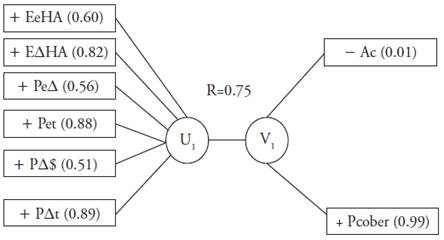
Figure 2 Association pattern of the first canonic correlation of the relation of the proportion of coverage of the minimum welfare line and the percentage of auto-consumption of the rural family, with the indicators of financial energetic efficiency and of productivity of the SAES (TM). U1: Association of independent variables. V1: Association of dependent variables.
Figure 2 shows that to the extent that the variables (U1): economic efficiency per ha, efficient use of energy per ha, economic productivity per invested energy, economic productivity per man-hours invested have higher values, the producer has more capacity to reach the percentage of coverage of the minimum welfare line, which is completely logical since the producer’s purchasing power increases and, therefore, the producer can manage to purchase some essential products.
The traditional SAES (T) generate net annual income per ha of $7883.84±3904.89 ha-1, which is equivalent to a net daily income per ha of $21.60±10.70 day-1, which when compared to the minimum wage of $92.32 day-1 for 2016 (CONASAMI, 2016), it was determined that these producers earn 76.60 % below the official minimum wage.
Through maize production, T producers attain incomes that allow them to reach the minimum welfare line in only 8 ± 6 %. This indicates that with the maize production a large number of producers cannot generate incomes that allow them to satisfy their needs, remaining in dietary poverty, as González et al. (2015) indicate in a study carried out in indigenous communities of Chilchota, Michoacán.
The canonic correlation showed that there is a significant correlation between the two groups of social or dependent canonic variables and the independent, explaining 69 % of the variability. The canonic weights of the first canonic correlation signal that the variables: economic efficiency per ha (Eeha), efficient use of energy per ha (E∆ha), economic productivity per MJ invested (Pe∆), economic productivity per work invested (Pet), energetic productivity per money invested (P∆$), energetic productivity per work invested (P∆t) has high correlation, except the variable coverage of minimum welfare line (Figure 3), which agrees with the previous data, since 100 % of the peasant families of the producers that manage these SAES barely manage to cover the minimum welfare line. In relation to the variables of economic efficiency and efficient use of energy, their behavior indicates that as these variables increase from a higher productivity, auto-consumption increases (+Ac), which indicates the positive value of this variable, while the percentage of the product that is destined to the sale decreases (Rayón, 2014; Zagoya, 2015).
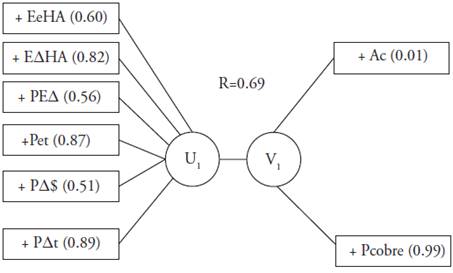
Figure 3 Association pattern of the first canonic correlation of the relation of the proportion of coverage of the minimum welfare line and the percentage of auto-consumption of the rural family, with the indicators of financial energetic efficiency and of productivity of the SAES (T). U1: Association of independent variables. V1: Association of dependent variables.
The subsistence traditional SAES (TS) generate net annual incomes per ha of $2410.05±823.59 ha-1, which is equivalent to a net daily income per ha of $6.60±2.26 day-1, when comparing it to the minimum wage, which is of $92.32 day-1; for 2016, we can determine that these producers earn 92.85 % below the official minimum wage (CONASAMI, 2016).
Through maize production, the TS producers achieve incomes that allow them to reach the minimum welfare line in only 5 ± 1 %; this indicates that a large part of the producers do not manage to generate incomes to satisfy their needs with maize production, remaining in dietary poverty (González et al., 2015).
The canonic correlation showed that there is a significant correlation between the two groups of social or dependent canonic variables and the independent ones, explaining 84 % of the variability. The canonic weights of the first canonic correlation point out that all the variables have a high correlation (Figure 4); in addition, 100 % of the peasant families of the producers that manage these SEAS do not manage to cover the minimum welfare line, destining most of the production to the sale to satisfy their basic needs. These results differ from what was reported by Zagoya (2015), who indicates that the main destination of the production is auto-consumption and, in lower proportion, commercialization.
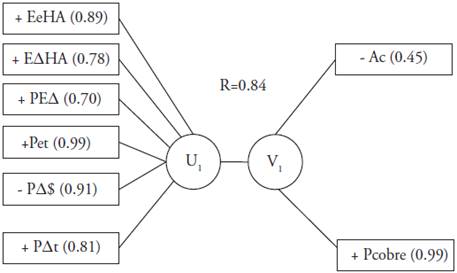
Figure 4 Association pattern of the first canonic correlation of the relation of the proportion of coverage of the minimum welfare line and the percentage of auto-consumption of the rural family, with the indicators of financial energetic efficiency and of productivity of the SAES (TS). U1: Association of independent variables. V1: Association of dependent variables.
Conclusions
In general there is a high correlation between the variables that indicate energetic-economic efficiency and productivity efficiency of the SAES (U1: Eeha, E∆ha, Pe∆, Pet, P∆$, P∆t) with the variables auto-consumption and minimum welfare line, which allows stating that the level of poverty is strongly influenced by the productivity, where when productivity increases, the economic and energetic efficiency of the SAES also increases, which in turn gives the producer a greater possibility of reaching the minimum welfare line.
On the other hand, in the case of the SAES (T) and (TS), the producers do not obtain sufficient yields due to the scarce or null access to technological packages adapted to the prevailing climate conditions in the zone. Likewise, the producer destines the percentage of maize grains which will be for auto-consumption or sale, according to the needs of the family. In this sense, the producers who obtain a low maize yield prefer to trade the grain with the aim of obtaining money in cash that may be used to satisfy basic needs of the family nucleus.
Literatura citada
Ayala-Garay, Alma V., Rita Schwentesius-Rindermann, Micaela de la O-Olán, Pablo Preciado-Rangel, Gustavo Almaguer-Vargas, Patricia Rivas-Valencia. 2013. Análisis de rentabilidad de la producción de maíz en la región de Tulancingo, Hidalgo, México. Agricultura, Sociedad y Desarrollo. Vol. 10. Núm. 4. pp: 381-395. [ Links ]
Boltvinik, Julio., y Alejandro Marín. 2003. La canasta normativa de satisfactores esenciales de la Coplamar. Génesis y desarrollos recientes. Comercio Exterior. Vol. 53. Núm.5. pp: 473-484. [ Links ]
Chalate-Molina, Héctor, Felipe Gallardo-López, Ponciano Pérez-Hernández, Fritz Paul Lang-Ovalle, Eusebio Ortega-Jiménez y Julio Vilaboa Arroniz. 2010. Características del sistema de producción bovinos de doble propósito en el estado de Morelos, México. Zootecnia Tropical, Vol. 28. pp: 329-339. [ Links ]
Comisión Nacional Salario (CONASAMI). Salarios mínimos. 2016. http://www.conasami.gob.mx/salarios_minimos.html . Consultado en mayo de 2016. [ Links ]
Consejo Nacional de Población (CONAPO). 2016. Bases de datos de Índice de marginación por entidad federativa 1990 - 2015. http://www.conapo.gob.mx/en/CONAPO/Datos_Abiertos_del_Indice_de_Marginacion Consultado 23 de julio de 2016. [ Links ]
Damián Huato, Miguel Ángel, Benito Ramírez Valverde, Filemón Parra Inzunza, Juan Alberto Paredes Sánchez, Abel Gil Muñoz, Artemio Cruz León y Jesús Francisco López Olguín. 2007. Apropiación de tecnología por productores de maíz en el Estado de Tlaxcala, México. Agricultura técnica en México. Vol. 33. Núm. 2. pp: 163-173. [ Links ]
Damián Huato, Miguel Ángel, Omar Romero Arenas, Benito Ramírez Valverde, Lucía López Reyes, Conrado Parraguirre Lezama y Artemio Cruz León. 2014. Agricultura familiar y seguridad alimentaria entre productores de maíz de temporal en México. Agroecología. Vol. 9. Núm. 1 y 2. pp: 89-99. [ Links ]
Damián Huato, Miguel Ángel, Víctor Manuel Toledo y Omar Romero Arenas. 2015. Utopística agroecológica e innovaciones campesinas para la producción de maíz de secano. In: V Congreso Latinoamericano de Agroecología-SOCLA (7 al 9 de octubre de 2015, La Plata). 2015. 5 p. [ Links ]
De Ita Caro, Miguel Ángel, Miguel Ángel Damián Huato, Omar Arenas Romero, Ignacio Ocampo Fletes y Jesús Francisco López-Olguín. 2016. Pobreza alimentaria y manejo de la milpa: el caso del municipio de Zautla, Puebla, México. Revista Mexicana de Ciencias Agrícolas. Vol. 7. Núm. 7. pp: 1513-1526. [ Links ]
Denoia, Julio, María S. Vilche, Sergio Montico, Beatriz Tonel, Néstor Di Leo. 2006. Análisis descriptivo de la evolución de los modelos tecnológicos difundidos en el Distrito Zavalla (Santa Fe) desde una perspectiva energética. Ciencia, Docencia y Tecnología. Vol. XVII. Núm. 33. pp: 209-226. [ Links ]
Dixon, Jhon, y Aida Gulliver. 2001. Sistemas de producción agropecuaria y pobreza. Cómo mejorar los medios de subsistencia de los pequeños agricultores en un mundo cambiante. FAO-Banco Mundial. Roma. 480 p. [ Links ]
Etchevers, Jorge D., Vinisa Saynes, y Mariana Margarita Sánchez. 2016. Manejo sustentable del suelo para la producción agrícola. In: Ciencia, Tecnología e Innovación en el Sistema Agroalimentario de México. Biblioteca Básica de Agricultura, Colegio de Postgraduados. México. pp: 63-79. [ Links ]
Gallardo López, Felipe, David Riestra Díaz, Andrés Aluja Schunemann, Juan P Martínez Dávila. 2002. Factores que determinan la diversidad agrícola y los propósitos de producción en los agroecosistemas del Municipio de Paso de Ovejas, Veracruz, México. Revista Agrociencia. Vol. 36. Núm. 4. pp: 495-502. [ Links ]
García, Enriqueta. 2004. Modificaciones al Sistema de Clasificación Climática de Köppen para Adaptarlo a las Condiciones de la República Mexicana. Quinta edición. México. Instituto de Geografía. UNAM. 98 p. [ Links ]
García Sañudo, Juan Ángel, Manuel Villarreal Romero, Pedro Sánchez Peña, Saúl Parra Terraza & Sergio Hernández Verdugo. 2013. Fertilización con vermicomposta en maíz criollo y su tasa de descomposición en el suelo. Revista de Investigación Agraria y Ambiental, Vol. 4, Núm. 1. pp: 41-48. [ Links ]
González Martínez, Sandra Llovizna, Luis Arturo Ávila Meléndez, José Teodoro Silva García. 2015. Comunidades indígenas: Entre la adaptación a alteraciones climáticas locales y el abandono de la agricultura. In: AIBR: Revista de Antropología Iberoamericana, Vol. 10. Núm. 1. pp: 27-48. [ Links ]
González Muñoz, Oscar y Beatriz Meneses Aguirre. 2015. El abandono de la política económica en la actividad agrícola: el caso de la pobreza rural en Veracruz, México como posible consecuencia (2000-2012). Ciencia Administrativa. Núm. 1. pp: 159-169. [ Links ]
Guevara-Hernández, Francisco; Luis Alfredo Rodríguez-Larramendi, Manuel Antonio Hernández-Ramos, María de los Ángeles Fonseca-Flores, Manuel La O-Arias, Luis Reyes-Muro. 2015. Eficiencia energética y económica del cultivo de maíz en la zona de amortiguamiento de la Reserva de la Biosfera La Sepultura, Chiapas, México. Revista Mexicana de Ciencias Agrícolas. Vol. 6. Núm. 8. pp: 1929-1941. [ Links ]
INAFED (Instituto Nacional para el Federalismo y Desarrollo Municipal). 2002. Enciclopedia de los Municipios y Delegaciones de México. Disponible en: Disponible en: http://www.inafed.gob.mx/work/enciclopedia/index.html . Consultado en mayo de 2016 [ Links ]
Leite, Sergio. 2004. Autoconsumo y Sostenibilidad en la agricultura familiar: una aproximación a la experiencia brasileña. In: Belik, Walter (ed), Políticas de seguridad alimentaria y nutrición en América Latina. Ed. Hucitec FAO-FODEPAL. Sao Paulo. [ Links ]
Luna Flores, Maximino, Rodolfo Gaytán Bautista. 2001. Rendimiento de maíz de temporal con tecnología tradicional y recomendada. Revista Mexicana de Ciencias Agrícolas. Vol. 27. Núm. 2. pp: 163-169. [ Links ]
Marín, A. 2002. La medición de la pobreza. Una nueva aproximación. Tesis de licenciatura en Economía, Universidad Tecnológica de México. [ Links ]
Martínez, M., H. Ríos, Sandra Miranda, Irene Moreno, Rosa Acosta, A. Farrera, y J. Velasco. 2006. Caracterización de la diversidad y selección participativa de prospecciones de maíz en Chiapas, México. Cultivos Tropicales. Vol. 27. Núm.: 1. pp: 55-62. [ Links ]
Mora-Delgado, Jairo Ricardo, Carlos Ramírez Martínez y Olman Quirós Madrigal. 2007. Mano de obra, análisis beneficio-costo y productividad de la energía en la caficultura campesina de Puriscal, Costa Rica. Cuadernos de Administración. Vol. 20. Núm. 33. pp: 79-101. [ Links ]
Pimentel David. 1993. Economics and energetics of organic and conventional farming. Journal of Agricultural and Environmental Ethics. Vol. 6. Núm. 1. pp: 53-60. [ Links ]
Purroy-Vásquez, Rubén., Felipe Gallardo-López, Pablo Díaz-Rivera, Eusebio Ortega-Jiménez, Silvia López-Ortiz & Glafiro Torres-Hernández. 2016. Flujo energético-económico como herramienta para tipificar agroecosistemas en el centro del estado de Veracruz, México. Ecosistemas y recursos agropecuarios, Vol. 3. Num. 7. pp: 91-101. [ Links ]
Rayón Peña, Juan Virgilio. Productividad, rentabilidad y estratificación de los productores de maíz en Tlalchapa, Guerrero. 2014. Tesis de Maestría en Ciencias, especialista en Economía. Colegio de Postgraduados. [ Links ]
Rincón-Sánchez, Froylán, Norma A. Ruíz-Torres, Ricardo Cuellar-Flores y Francisco Zamora-Cancino. 2014. Jaguan, variedad criolla mejorada de maíz para áreas de temporal del sureste de Coahuila, México. Revista Fitotecnia Mexicana. Vol. 37, Num: 4. pp: 403-405. [ Links ]
Risoud, B., & B Chopinet. 1999. Efficacité énergétique et diversité des systèmes de production agricole-Application à des exploitations bourguignonnes. Ingénieries-EAT. Núm. 20. 17 p. [ Links ]
Romero Arenas, Omar, Miguel Ángel Damián Huato, Dora María Sangerman Jarquín, Luis Reyes Muro, José Filomeno Conrado Parraguirre Lezama , Sergio Orozco Cirilo. 2016. Maíz, potencial productivo y seguridad alimentaria: el caso de San Nicolás de Los Ranchos, Puebla-México. Nova Scientia. Vol. 8, Núm. 16. pp: 352-370. [ Links ]
Romero, Sorelly Ramírez, Angélica Figueroa Rodríguez, and Francisco Hernández Rosas. 2013. Relación entre la producción agrícola y marginación a nivel municipal para el estado de Veracruz, México. Revista Mexicana de Agronegocios. Vol. 17, Núm. 33. pp: 528-538. [ Links ]
Salazar-Barrientos, Lucila de Lourdes, Miguel Ángel Magaña-Magaña, Astrid Nohely Aguilar-Jiménez, y María Fernanda Ricalde-Pérez. 2016. Factores socioeconómicos asociados al aprovechamiento de la agrobiodiversidad de la milpa en Yucatán. Ecosistemas y Recursos Agropecuarios, Vol. 3. Núm. 9. pp: 391-400. [ Links ]
Sanclemente Reyes, Óscar Eduardo, Carlos Patiño Torres, y Liliana Rocío Beltrán Acevedo. 2012. Análisis del balance energético de diferentes sistemas de manejo agroecológico del suelo, en el cultivo del maíz (Zea mays L.). Revista de Investigación Agraria y Ambiental. Vol. 3. Núm. 1. pp: 41-463. [ Links ]
Scheaffer L., Richard, William Mendenhall y Lyman Ott. 1987. Elementos de muestreo. Grupo Editorial Iberoamérica, México. 321 p. [ Links ]
Servicio de Información Agroalimentaria y Pesca-Secretaría de Agricultura, Ganadería, Desarrollo Rural, Pesca y Alimentación (SIAP-SAGARPA). 2016. Sistema de Información del Sector Agrícola, Producción Agropecuaria y Pesquera: Sistema de Información del Sector Agrícola, Producción Agropecuaria y Pesquera: http://www.siap.sagarpa.gob.mx/ Consultado 19 de abril de 2016. [ Links ]
Servicio de Información Agroalimentaria y Pesca-Secretaría de Agricultura, Ganadería, Desarrollo Rural, Pesca y Alimentación (SIAP-SAGARPA). 2017. Sistema de Información del Sector Agrícola, Producción Agropecuaria y Pesquera: Sistema de Información del Sector Agrícola, Producción Agropecuaria y Pesquera: http://www.siap.sagarpa.gob.mx/ Consultado 08 de agosto de 2017. [ Links ]
Stat-Soft Inc, 2003. User guides. 2325. East 13th Street, Tulsa Ok.74104. USA. 2003 [ Links ]
Tobasura, I, Moreno, F., Aya, S., y Mora, J. 2012. Productividad energética y financiera en fincas campesinas del departamento de caldas. Tres estudios de caso. Revista. Luna Azúl. Núm. 34. pp: 101-112. [ Links ]
Turiján Altamirano, Teresa, Miguel Ángel Damián Huato, Benito Ramírez Valverde, José Pedro Juárez Sánchez y Néstor Estrella Chulín. 2012. Manejo tradicional e innovación tecnológica en cultivo de maíz en San José Chiapa, Puebla. Revista Mexicana de Ciencias Agrícolas, Vol. 3. Núm. 6. Pp. 1085-1100. [ Links ]
Uzcanga Pérez, Nelda Guadalupe, Alejandro de Jesús Cano González, Juan Medina Méndez, José de Jesús Espinoza Arellano. 2015. Caracterización de los productores de maíz de temporal en el estado de Campeche, México. Revista Mexicana de Agronegocios. Vol. XIX. Núm. 36. pp: 1295-1305. [ Links ]
Valdés, N., D. Pérez, M. Márquez, Lydia Angarica y Dania Vargas. 2009. Funcionamiento y balance energético en agroecosistemas diversos. Cultivos Tropicales. Vol. 30. Núm. 2. pp: 36-42. [ Links ]
Zagoya Martínez, Joaquín. 2015. Sistema tradicional utilizado en la producción de maíz en La Sierra Nevada de Puebla, México. Revista Caribeña de Ciencias Sociales. Disponible en http://caribeña.eumed.net/produccion-maiz/ [ Links ]
Received: August 2016; Accepted: August 2017
 Este es un artículo publicado en acceso abierto bajo una licencia Creative Commons
