


Services on Demand
Journal
Article
 text in
  English (pdf)
 Article in xml format
 Article references
 Send this article by e-mail
Indicators
-
 Cited by SciELO
 -
 Access statistics
Related links
-
 Similars in
SciELO
Similars in
SciELO
Share

 Permalink
Agricultura, sociedad y desarrollo
Print version ISSN 1870-5472
agric. soc. desarro vol.14 n.1 Texcoco Jan./Mar. 2017
Articles
Sociodemographic and economic changes of households in rural México, 2002-2007
1 Colegio de Postgraduados. México. (marlenmartinez7@gmail.com) (fparra@colpos.mx) (jjaramil301@ yahoo.es) (icarranz@colpos.mx).
2 Instituto Tecnológico y de Estudios Superiores de Monterrey (ITESM). México. (jjmora@itesm.mx).
3 El Colegio de México A. C. México. (ayunez@colmex.mx).
The article shows sociodemographic and economic changes that were experienced by households and their members in rural México, at the national and regional scale, during the 2002-2007 period. The analysis was based on panel type information from two rounds of the National Survey of Rural Households in México (Encuesta Nacional a Hogares Rurales de México, ENHRUM I and II, from this point forward) under a quantitative approach. Within the main results, the following stand out: a) in the sociodemographic aspect, the increase in the average level of schooling of the household, the increase of migration towards the US, and the reduction of migration inside México stand out; b) in the economic aspect, incomes from non-agricultural and livestock activities have a significant participation in the composition of the total income of the household; c) with regards to access to government subsidies, an increase was seen during the period, especially to those from social programs. The results at a regional scale indicate the heterogeneity there is in the rural sector in México, which should be considered when designing public policies for this sector.
Key words: agricultural and livestock physical assets; government supports; credit; level of schooling
El artículo muestra los cambios sociodemográficos y económicos que experimentaron los hogares y sus miembros en el México rural, a escala nacional y regional, en el periodo 2002-2007. El análisis se basó en información tipo panel de dos rondas de la Encuesta Nacional a Hogares Rurales de México (ENHRUM I y II, de aquí en adelante) bajo un enfoque cuantitativo. Dentro de los principales resultados destacan los siguientes: a) en el aspecto sociodemográfico resalta el aumento en el nivel de escolaridad promedio del hogar, el incremento de la migración hacia EE. UU. y la reducción de la migración al interior de México; b) en el ámbito económico, los ingresos por actividades no agropecuarias tienen una participación significativa en la composición del ingreso total del hogar; c) en cuanto al acceso a subsidios gubernamentales se registró un aumento en el periodo, en especial los provenientes de los programas sociales. Los resultados a escala regional indican la heterogeneidad que existe en el sector rural de México, la cual debe considerarse al diseñar políticas públicas para este sector.
Palabras clave: activos físicos agropecuarios; apoyos gubernamentales; crédito; nivel de escolaridad
Introduction
To establish the importance of the rural sector, it is necessary to understand the evolution of its population. The component of rural population in the national sphere has been growing in absolute terms, going from 11 million in 1930 to 27.5 million in 2015. In their turn, until the decade of the 1950s, México was a rural country, but, starting on the following decade, the urban population grew above it. By 2015, 23 % of the population in México lived in rural localities and 77 % in urban localities (INEGI, 2015).
The purpose of the article is to offer a general outlook of the sociodemographic and economic changes that the households and their members experienced in rural México at the national and regional scale during the period of 2002-2007. For the sociodemographic aspect, the following were analyzed: age, level of schooling and indigenous language of the head of the household, size of the household, number of adults in the household, migration to other parts of México, and migration to the USA. In the economic aspect, the following were examined: ownership of agricultural and livestock physical assets, such as agricultural lands, machinery and livestock, sources of income of the households, credit availability, and access to government programs (productive and social programs).
Methodology
The results of this article are based on information from ENHRUM I and II. ENHRUM I was carried out in 2003, considering information from 2002, and ENHRUM II was carried out in 2008, gathering data from 2007. The ENHRUM is panel type and in its two rounds obtained demographic and social information at the national scope, such as schooling, work history, migration history; and economic data at the household level, such as assets, costs and income from productive activities and consumption.
The ENHRUM I and II were applied in 80 localities of the country, distributed in 14 states grouped into five regions1 (Figure 1). The National Institute of Statistics and Geography (Instituto Nacional de Estadística y Geografía, INEGI) designed the sample for the ENHRUM, so that it provided a statistically reliable characterization of the inhabitants that live in rural localities of between 500 and 2499 residents.

Source: ENHRUM, 2002.
Figure 1 Regional distribution of the National Survey to Rural Households in México and geographic distribution of the communities surveyed 2002 and 2007.
Each round of the ENHRUM consisted of two questionnaires: community and households. The first was applied to local authorities and gathered information about the relationship of each locality with its environment, economic and social infrastructure, main economic activities, type of land ownership, access and use of natural resources, among others. The questionnaire to households of the ENHRUM I included 10 sections (housing, members, plots, crops, livestock, goods and services, natural resources, other income and expenses, assets, inheritance and loans). In addition to containing the sections from I, the questionnaire to households of the ENHRUM II also covered sections of access to credit, financial services, exogenous events and property rights. The ENHRUM I is representative at the national and regional level (Chávez, 2007).
The ENHRUM is a panel type survey that allows understanding the changes that are experienced by individuals and households, in relation to a set of sociodemographic and economic variables. In data comparison, the Student t test was used for two related samples, contrasting hypotheses about the means comparison and standard deviations of the samples and determines whether the differences between these parameters are significant. To use this test, it is necessary for the population of differences to be distributed normally and for there to be two moments. The null hypothesis to be tested is that the means are equal in the two groups versus the alternative hypothesis, that they are different. In the case of the proportions, the proportion equality test was used for large samples.
The sociodemographic changes that members of the household experienced between 2002 and 2007 are based on data from 7519 individuals, from whom there is information in both rounds of the survey. For the sociodemographic changes in households, 1543 observations were considered, which belong to those interviewed in the ENHRUM I and II. The description of the information does not include the people who during the two years of surveying lived more than three months outside the household2, who are considered part of the family, but not members of the household. With the aim of verifying the information from the ENHRUM, the results in the individual and household planes were compared with other sources of information, such as the National Population and Housing Census 2000 and 2010, the 2nd Population and Housing Census 2005, and the National Survey on Household Income and Expenditure (Encuesta Nacional de Ingresos y Gastos de los Hogares, ENIGH) 2002 and 2008.
Results and Discussion
Sociodemographic changes of the household members in rural México, 2002-2007
Taking data from the sample of both rounds of ENHRUM, and using expansion factors, population pyramids were built for each year. The age structure of the rural population has changed from 2002 to 2007. The population pyramid from 2007 broadens in the center and reduces in the base; the percentage of children has decreased and that of adults has increased. The contrary happens in 2002, where the structure still has a broad base, high percentages of children and adolescent population3. In 2007 the population of less than 15 years represents 19.9 % of the total, while the population in work age, from 15 to 64 years, constitutes 73.7 %, and that of advanced age represents 6.4 % of the inhabitants of the rural sphere in the country. In contrast, in 2002 the participation of these large groups of age was 26.7, 68.5 and 4.8 %, respectively. The trend is a reduction of the population younger than 15 years, an increase of that older than 65 years and, to a greater degree, the population in the productive age of 15 to 64 years (Figures 2 y 3). This combination of demographic conditions constitutes the demographic bonus (phenomenon that takes place within the process of demographic transition in which the population of working age is older than the dependent one, which includes children and adults); from this that the investment in human capital is necessary (health, education and work training), as well as the creation of sources of employment to face demographic ageing (CONAPO, 2012). According to information from the sample, women represent slightly over half of the population in the rural sector (51.45 %) and men 48.55 %, which means that there are 94 men for every 100 women, results similar to those reported in the National Population and Housing Census, 2010 (51.2 % and 48.8 %, respectively).


Table 1 shows the changes between 2002 and 2007 for age, schooling and indigenous language of the members of the household in the rural sector, in total and per region. The results from the means comparison test for these variables are significant in total and in some regions, which indicates differences between both years.
Table 1 Statistical summary of sociodemographic variables of the inhabitants in total and per region in rural México 2002 and 2007.

***significant at 1 %, **significant at 5 %, * significant at 10 %.
Source: authors’ elaboration with data from ENHRUM I and II.
The median was considered for age because it divides the population into two equal parts. This variable increased during the period (22 years in 2002 to 27 years in 2007); these figures are quite close to those presented in the Population and Housing Census 2000 and 2010 (22 and 26 years, respectively). Among regions, the South-southeast region stands out for having the youngest population and the Northeast for presenting the oldest members.
In terms of education, the level of schooling was classified from 0 to 20 years. In average schooling, individuals of 15 years and older were included based on the criterion by the United Nations Educational, Scientific and Cultural Organization (UNESCO). The results in total and in certain regions indicate significant differences and reflect an increase in schooling between 2002 and 2007. According to the sample, people in this range of age reached in average 5.46 and 5.83 years of education in 2002 and 2007, respectively; both figures are similar to those calculated from data from the ENIGH 2002 and 2008 (5.46 and 5.7, respectively). On the regional plane the South-southeast stands out from having the lowest average schooling and the Northwest for the highest average. The rural sector presents the greatest educational backwardness, with levels of education lower than the national average and urban zones. According to the Population and Housing Census 2010, the average schooling of the population in México with 15 years and more went from 6.5 years in 1990 to 8.5 in 2010, that is, up to third secondary in average.
Regarding the indigenous language, the results in total and in some regions are significant and reflect a reduction in the number of people who speak some indigenous language during the period analyzed. Among regions, the South-southeast stands out for having the highest average of individuals of five years and more who speak an indigenous language and the Northeast for presenting the lowest average. The Center region shows the greatest significant reduction. The percentages presented here approaches the data calculated from the module of characteristics of the population of the ENIGH 2002 and 2008.
Sociodemographic changes of households in rural México 2002-2007
Table 2 contains the results from the means comparison test for the average age and schooling of the head of the household, average schooling of the members of the household, size of it, language of the head of the household, number of adults in the households, number of migrants to other parts of México and to the USA.
Table 2 Statistical summary of sociodemographic variables of the households in total and per region in rural México 2002 and 2007.

***significant at 1 %, **significant at 5 %, * significant at 10 %.
§Schooling of the household does not include the head of the household.
£People of 12 years and older are considered adults.
Source: authors’ elaboration with data from ENHRUM I and II.
The average age of the heads of household increased in total and per region, with significant differences found between 2002 and 2007. In 2002 the South-southeast region stands out for having the youngest heads of households and the Northeast the oldest, while in 2007 the Center region presents the youngest heads of households and the Northeast the oldest. When it comes to gender of the heads of households, 85.9 % are men and the rest are women, suggesting that the Mexican rural households are commonly led by a man, who is the oldest male and, frequently, the main economic provider and highest authority for decision making in the household.
Regarding the size of the household, the results signal that the mean of the variable in 2002 and 2007 is quite similar, that is, there were no significant changes in the period. These figures are similar to those reported in the results of the Population and Housing Census, 2000, and the 2nd Population and Housing Census 2005 (4.6 and 4.4 individuals, respectively).
Individuals of 12 years and more were included in the number of adults. The results from the test indicate an increase in the average of adults per household in total and per region between both rounds of the ENHRUM. In the regional scope the Northeast stands out for having the lowest average number of adults, and the Center-west, for having the highest average of adults.
Regarding the schooling of the heads of households, the results per region suggest that there is no significant difference between 2002 and 2007, except in the total where there is a slight increase. This indicator estimated from 1543 heads of households in the sample is 4.28 years in 2002 and 4.54 years in 2007; these figures are closer to those obtained from the information for the rural stratum of the ENIGH 2002 and 2008 (4.0 and 4.69 years, respectively).
With regards to average schooling of the household, excluding that of the head of the household, the results for the whole rural sector point to a significant increase in years of education. With the exception of the South-southeast and Center-west, in the other regions the differences are random. In both years of the survey, the South-southeast region is the one that presents the greatest educational backwardness and the Northwest the highest schooling.
In terms of the language of the head of the household, the changes observed between 2002 and 2007 are not significant. Among regions, the South-southeast stands out for having the highest proportion and the Center-west the lowest. The percentages presented here approach the data calculated from the module of characteristics of the population of the ENIGH 2002 and 2008.
Between 2002 and 2007, migration to the USA showed a significant growth in the number of migrants per household in total and per region. Regarding migration to other parts of México, the data indicate that in total and in some regions there are significant differences between both rounds of the ENHRUM. In 2002 the number of migrants per household both to the US and to México was 0 to 10. In 2002 the households had in average 0.43 migrants to the US and 0.67 to other parts of México, that is, 1.10 in total. In 2007 the number of migrants to the US and to the rest of the country was 0 to 9. In that year the households had 0.60 migrants in average to the US and 0.55 domestic ones, which represent 1.15 in total. In 2002 and 2007 the Center-west region stands out for being the zone with the highest number of migrants to the US; this agrees with the results from the Population and Housing Census 2010, which points out that the localities of highest migrant population to other countries are found in states of this region (Guanajuato, Jalisco and Michoacán). In domestic migration, the South-southeast and Center-west regions show significant reductions in the number of migrants per household to other parts of México.
History of rural migration
The section on migratory stories of the ENHRUM II contains retrospective information about the State that individuals reside in, as well as the sector that they were working in from 1990 to 2007. The information includes the members of the household (people who resided in the house of the household for three months of more) and those who were part of the family (people who resided outside the household three months or more) and those who moved to the USA or other parts of México. Figures 4 and 5 reveal an increasing trend both for migration to the US and to other parts of México; however, the line of international migration is more pronounced than the domestic one. Figure 6 shows that both types of migration show an increasing trend in the 1990-2007 period. In 2004 both almost coincide, but starting in 2006 migration inside the country tends to decrease, while that to the US increases.

Source: authors’ elaboration with data from ENHRUM II.
Figure 4 Proportion of migrants from the household older than 15 years who migrated to the USA, 1990-2007.
Source: authors’ elaboration with data from ENHRUM II.
Figure 5 Proportion of migrants from the household older than 15 years who migrated to other parts of México, 1990-2007.
Economic changes of households in México’s rural sector2002-2007
Availability of agricultural and livestock physical assets
Table 3 summarizes the access of households to agricultural and livestock physical assets (land, machinery and livestock). The results of the means comparison test are significant in certain variables in total and per region. When it comes to the number of plots per household there are significant differences in total and in some regions between both years of the ENHRUM. In the regional scope, the Center and Northeast present significant increases between 2002 and 2007. Insofar as surface of land owned by the households, the data show that it is not significant, that is, there is no statistical evidence of differences.
Table 3 Statistical summary of the availability of agricultural and livestock physical assets from the households in total and per region in rural México 2002 and 2007.
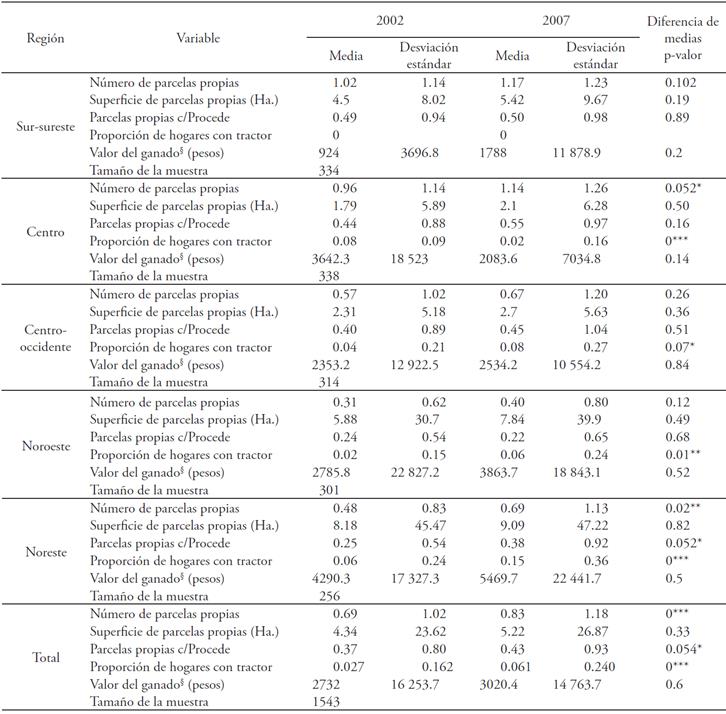
***significant at 1 %, **significant at 5 %, * significant at 10 %.
§Includes sheep, goats, pigs, horses and cattle livestock.
Note: the value of the livestock is expressed in pesos from 2002.
Source: authors’ elaboration with data from ENHRUM I and II.
To give security to land ownership, the federal government implemented the Certification Program for Ejido Rights and Entitlement of Urban Plots (Programa de Certificación de Derechos Ejidales y Titulación de Solares Urbanos, Procede) during the 1992-2006 period. According to the sample, in total there was a significant advancement in the average of plots per households incorporated to the program. As is shown in Table 3, only the Northeast region presents significant changes in the period of analysis.
With regards to machinery ownership, the number of tractors in total and in some regions shows significant differences between both years. In total, the availability of tractors increased from 2002 to 2007. However, most of the households devoted to agricultural and livestock production do not have this type of machinery, basically for two reasons: the conditions of the cultivation plots and the financial inability to acquire them. Per region, the Center one suggests a significant reduction, while the Center-west, Northwest and Northeast present increases in the number of tractors.
Livestock production is an activity that generates income for the rural households. The data in detail of the ENHRUM I and II allow estimating the net income from this activity for each household of the sample. For this study, the net incomes obtained only from breeding large livestock (sheep, goats, pigs, horses and cattle) were calculated, from the gross value of production minus the cost of inputs purchased. The gross income of livestock production was estimated based on the change in the value of the standing livestock, between the end and the beginning of the year (value of livestock inventory), the sale of livestock and products of animal origin, and the value of animal consumption in the household; to this figure, the cost of purchasing livestock and inputs (feed, vaccines, veterinaries, among others) was subtracted, in addition to the cost of the workforce hired in the livestock production. To compare the value of the livestock activity in the households in the two years an adjustment was made because of inflation based on the National Index of Consumer Prices (1.22). The results indicate that the changes in the value of livestock in total and per region in 2002 and 2007 are random, that is, there are no statistically significant differences. It is important to highlight that the minimum in livestock production is zero, which informs that not all households have this type of asset.
Access to government programs and credit
Government programs contribute to reducing poverty and to promoting productive activities in the rural sector. For the analysis, the following were classified as productive programs: Procampo, Procampo Ganadero (PROGAN), Alianza Contigo, Programa de Apoyo a las organizaciones Sociales Agropecuarias y Pesqueras (PROSAP) and Programa de Subsidios al Diésel. Within the social programs, the following were included: Oportunidades, Programa Nacional de Becas para la Educación Superior (PRONABES), Programa de Adultos Mayores, Seguro Popular and Programa de Vivienda Rural; it should be pointed out that the last three programs were implemented in 2004.
The results that correspond to these programs show that during the period of study there were significant changes in total and in some regions. Table 4 shows that the proportion of households with productive programs decreased, while those with social programs increased. Among regions, the South-southeast presents a significant reduction in the proportion of households with productive programs; however, together with the Center-west region, it experienced an increase in the proportion of households that receive supports from social programs.
Table 4 Statistical summary of the coverage of government programs and the availability of credit to households in total and per region in rural México 2002 and 2007.

***significant at 1 %, **significant at 5 %, * significant at 10 %.
Source: authors’ elaboration with data from ENHRUM I and II.
The agriculture and rural development policies were originated within the framework of commercial openness and the reform of constitutional Article 27 during the 1990s (Scott, 2010). During that period programs to combat poverty and for rural development were designed, based on the following elements: a) introduction to innovating programs and focalized in supporting the countryside; b) reassignment of social spending towards the rural sector (food subsidies, basic education and health services); and c) increase of spending associated to productive programs (ibid). Based on information from INEGI about public income and spending in México, the allotments of resources to productive and social programs were calculated. During the period 2002-2007 the spending through social programs was more important than the one related to production, with an annual growth of 15.35 %, quite higher than the spending destined to productive programs, which was only 3.39 %. This reflects a clear orientation of public spending towards income supports and whose aim is to relieve poverty, and development of human capital and social capital. Meanwhile, the budget destined to productive programs has been decreasing in recent years (INEGI, 2011).
Concerning the availability of formal credit for the rural households, the results in total and in some regions show significant differences between 2002 and 2007. In all of rural México a slight increase in the availability of credit was observed; however, in the rural sphere there prevails a slightly developed financial market. In 2002 and 2007 the Center-west region stands out for presenting a significant increase in the availability of formal credit.
The participation of the sources of income on the total income of households in rural México 2002 and 2007
To understand the contribution of different sources of income on the total income of rural households, the net incomes were calculated. These were estimated for eleven activities: agriculture, livestock production, gathering of natural resources, goods and services, transferences from Procampo, Oportunidades and other government backing, remittances from the US and other parts of México, and agricultural/livestock and non-agricultural salaries. In the case of productive activities (agriculture, livestock production, gathering of natural resources, goods and services) the net income was calculated as the gross value of production, minus the cost of the inputs acquired. The net agricultural/livestock and non-agricultural salaries were valued as the sum of the salary revenues received, minus the expense to go to work. Remittances from the US and other parts of México were obtained from the incomes received in the years of reference of the ENHRUM surveys. In the case of the remittances in dollars, these were transformed into pesos, using the average exchange rate of the years of reference in the rounds of the survey ($9.67 in 2002 and $10.93 in 2007). With the aim of comparing the contributions per source, an adjustment for inflation based on the Consumer Price Index (Índice de Precios al Consumidor, INPC) was performed.
The participation of the different sources of income on the total income points to the significant contribution of non-agricultural/livestock activities in the diversification of income of rural households. In 2007 the agricultural/livestock sector contributed 19.3 % and in 2002 16.6 % to the total net income of the household. In contrast, the non-agricultural salaries contributed with 35.4 % in 2002 and 30.2 % in 2007; this decrease is explained by the growth of the income via domestic remittances, which went from 2.35 % to 4.71 %; other government transferences that grew from 2.55 % in 2002 to 4.41 % in 2007 and the agricultural/livestock salaries that increased from 12.28 % to 13.86 % during the period.
Table 5 presents the total income and the participation of each source, as well as the changes during the period. The total average income per household taking into consideration the same households interviewed in both rounds of the survey was around $49 265 in 2002 and $51 619 in 2007. The results from the means comparison test suggest significant increases in the income from remittances from other parts of México, other government transfers and agricultural/livestock salaries.
Table 5 Participation of the sources of income in the total income of rural households in rural México 2002 and 2007 (pesos from 2002).

***significant at 1 %, **significant at 5 %, * significant at 10 %.
Source: authors’ elaboration with data from ENHRUM I and II.
Figure 7 contains the percentage of participation of the sources of income per region. In 2002 the households of the South-southeast obtained the greatest part of their income from the exploitation of natural resources, while in 2007 they were the main receivers of public transferences (Procampo and Oportunidades) and others (Procampo ganadero, proÁrbol, among others). According to both rounds of the ENHRUM, the remittances from other parts of México are fundamental for the families of the Center region, phenomenon that takes place frequently in the states where there are metropolitan zones, to which the occupied rural population moves; capturing remittances from the US was the main source of income for the households of the Center-west region, which is explained in part because the states of highest international migrant population in the country are located in it (INEGI, 2010). Lastly, agricultural/livestock production is the maximum supplier of economic resources for the families in the Northwest region and the activity of goods and services for the households in the Northeast.

Conclusions
The results from the means comparison test for the variables age, average schooling and indigenous language of the inhabitants in the rural sphere indicate that in total and in some regions there are significant differences between both years. The average schooling of individuals 15 years and older increased from 5.46 years in 2002 to 5.83 in 2007; however, it is still quite low when comparing it with the national average (8.5 years). From this that it is necessary to establish public policies directed at increasing the schooling of inhabitants of rural zones. In turn, the average of individuals of five years and more who speak indigenous languages decreased from 19 % in 2002 to 17 % in 2007.
With regards to demographic variables, this study contributes evidence about the significant increases in total and per region in the average age of the heads of the rural household, in the number of adults in the household and of migrants to the US per household. In contrast, in the case of the household size the changes observed are random, that is, there are no statistically significant differences during the period.
In the cases of average schooling of the household and number of migrants to other parts of México there are some significant differences for all of rural México and per region. For example, in total, the average schooling of the household increased from 5.77 years in 2002 to 6.16 in 2007, and the number of migrants towards the inside of the country was reduced in the period (0.67 to 0.55, respectively).
In the availability of agricultural and livestock physical assets, such as land, agricultural machinery and livestock there are significant differences in total and in some regions. In total, both the number of plots of their own and the proportion of households with a tractor grew: however, the percentage of households with this type of machinery is still quite small.
The transference of public resources to rural households through productive and social programs is important in total and in some regions. In total an increase of social programs, whose purpose is to mitigate poverty, and a reduction of productive programs is observed. Among regions, the South-southeast presents the highest proportion of households with productive programs in 2002 and with social programs in 2007, which suggests that there was a redirection of public policies in the region.
Within the sources of income that show significant ascending changes during the period there are other government transferences, agricultural/livestock salaries and domestic remittances. Even when during the study period the international remittances and the salary incomes of the households in non-agricultural/ livestock activities did not show significant changes, their weight in the households’ income continues to be important, particularly the non-agricultural/ livestock incomes, whose contributions to the total income of the household was higher than 30 % in the two years.
In the regional scope, the results obtained indicate that in general and with the exception of the South-southeast, the regions have been specialized insofar as their main source of income (this even when in all of them the economy of the rural households continues to be diversified); the Center, in remittances from other parts of México; the Center-west, in remittances from the US; the Northwest is characterized by the production of agricultural crops; and the Northeast by activities related to goods and services.
In sum, the findings presented show that in the 21st Century there have been significant changes in the demography and rural economy of México, as well as in the prevailing heterogeneity among its regions. It is considered that these results should be taken quite to heart in the design, planning and execution of public programs that seek to address the problematic of the sector and its inhabitants.
REFERENCES
CONAPO (Consejo Nacional de Población). 2012. Tamaño, dinámica y estructura de la población. http://www.conapo.gob.mx/es/CONAPO/Aspectos_Generales_de_los_resultados_de_las_Proyecciones_de_Poblacion . Consultado en septiembre del 2014. [ Links ]
Chávez, A. M. A. 2007. Reporte de la ENHRUM 2002: una semblanza. (Tesis de licenciatura). Universidad Nacional Autónoma de México, México. [ Links ]
ENHRUM I. 2002. Encuesta Nacional a Hogares Rurales de México. El Colegio de México y Desarrollo y Alimentación Sustentable A. C. [ Links ]
ENHRUM II. 2007. Encuesta Nacional a Hogares Rurales de México. El Colegio de México y Desarrollo y Alimentación Sustentable A. C. [ Links ]
INEGI (Instituto Nacional de Estadística, Geografía e Informática). 2000. XII Censo de población y vivienda 2000. http://internet.contenidos.inegi.org.mx/contenidos/productos//prod_serv/contenidos/espanol/bvinegi/productos/censos/poblacion/2000/archivospdf/oportuno.pdf . Consultado en junio del 2013. [ Links ]
INEGI (Instituto Nacional de Estadística, Geografía e Informática). 2002. Encuesta Nacional de Ingresos y Gastos de los Hogares 2002. http://www3.inegi.org.mx/sistemas/microdatos/encuestas.aspx?c=26176&s=est . Consultado en mayo del 2015. [ Links ]
INEGI (Instituto Nacional de Estadística, Geografía e Informática). 2005. II Conteo de Población y Vivienda 2005. http://www.inegi.org.mx/est/contenidos/proyectos/ccpv/cpv2005/Default.aspx . Consultado en julio del 2013. [ Links ]
INEGI (Instituto Nacional de Estadística, Geografía e Informática). 2008. Encuesta Nacional de Ingresos y Gastos de los Hogares 2008. http://www3.inegi.org.mx/sistemas/microdatos/micdirecto.aspx?s=est&c=33461 . Consultado en mayo del 2013. [ Links ]
INEGI (Instituto Nacional de Estadística, Geografía e Informática). 2010. Principales resultados del Censo de Población y Vivienda 2010. http://www.inegi.gob.mx/prod_serv/contenidos/espanol/bvinegi/productos/censos/poblacion/2010/princi_result/cpv2010_principales_resultadosI.pdf . Consultado en junio del 2013. [ Links ]
INEGI (Instituto Nacional de Estadística, Geografía e Informática). 2011. El ingreso y el gasto público en México 2011. http://www.inegi.org.mx/prod_serv/contenidos/espanol/bvinegi/productos/integracion/sociodemografico/igpm/2011/igpm-2011.pdf . Consultado en junio del 2013. [ Links ]
INEGI (Instituto Nacional de Estadística, Geografía e Informática). 2015. Principales resultados de la Encuesta Intercensal 2015. http://internet.contenidos.inegi.org.mx/contenidos/productos//prod_serv/contenidos/espanol/bvinegi/productos/nueva_estruc/702825078966.pdf . Consultado en mayo del 2015. [ Links ]
Scott, J. 2010. The Incidence of Agricultural Subsidies in Mexico. Report 2. Mexican. [ Links ]
1South-southeast Region (Veracruz, Oaxaca and Yucatán); Center Region (Estado de México and Puebla); Center-west Region (Guanajuato, Nayarit and Zacatecas); Nothwest Region (Baja California, Sinaloa and Sonora); Northeast Region (Chihuahua, Durango and Tamaulipas).
3The Convention on the Rights of Childhood does not distinguish between children and adolescents, but rather considers in a generic way as boys and girls all persons from zero to 18 years.
Agricultural physical assets |
It refers to the ownership of agricultural land, agricultural machinery and livestock (ENHRUM, 2007) |
Government supports |
Allocations that the federal government grants for the development of priority activities of general interest, through offices and states to differ ent sectors of the society, with the purpose of sup porting their operations; maintaining the levels in prices; supporting consumption, distribution and commercialization of goods; motivating investment; and covering financial impacts to promote techno logical innovation, as well as to foster the agricul tural/livestock, industrial or service activities. These subsidies are granted through the direct allocation of resources or through fiscal stimuli (INEGI, 2011) |
Credit |
It is the loan of an amount of money or inputs, in exchange for a commitment of payment in the future, for the same value, plus an extra amount, called inter est, that the Official Bank, the Development Bank, other government institutions or particular ones grant. In this concept, obtaining credit by the ma jority of ejidatarios or communal owners is captured (ENHRUM, 2007). |
Level of schooling |
Highest degree of study passed by the population of five and more years of age in any of the levels of the National Education System, or its equivalent in the case of studies abroad. The lev els are: preschool or kinder, primary, secondary, high school, teaching school, technical or commercial ca reer, professional, master and doctorate (ENHRUM, 2007). |
Received: October 2014; Accepted: May 2016
 Este es un artículo publicado en acceso abierto bajo una licencia Creative Commons
