


 nueva página del texto (beta)
 Inglés (pdf)
 Artículo en XML
 Referencias del artículo
 Enviar artículo por email
 Citado por SciELO
  Similares en
SciELO
Similares en
SciELO 
 Permalink
Introduction
At the beginning of 2021, the U.S. Congress approved a US$1.2 billion infrastructure project as proposed by President Joe Biden. In Mexico, the announcement caused government officials to calculate that remittances were going to grow even more in the coming years, since the project was supposed to create jobs for Mexican immigrants. In 2021, remittances reached a record level of more than US$52.7 billion, 25 percent more than the prior year, but 215 percent above the 2014 level. The doubling of remittances in seven years is a remarkable increase, especially since neither the U.S. economy nor its labor market were extraordinarily favorable for migrants between 2019 and 2021. On the contrary, the COVID-19 pandemic triggered unemployment rates to double digits. According to BBVA Research, employment of Mexican migrants fell by 20 percent in April 2020 vs. February 2020 (Li Ng, 2022). Li Ng points out that unemployment among Mexican migrants soared to 17 percent in April 2020 and slowly began to level out in 2021 to around 5 percent. Manuel Orozco and Matthew Martin noted that remittances in Latin America increased by 26 percent from 2020 to 2021 to US$134.4 billion (Martin, 2022). They suggested that Mexico’s boom in remittances can be explained by the increase in migration from Latin America to the United Sates, with Mexico among the main sources. They observed that many new migrants start sending money the same year of their arrival. They backed their hypothesis by pointing to an increase of Mexicans detained at border; this number went from 15,000 in April 2020 to 70,000 in April 2021, settling at a monthly average of 60,000. On the other hand, organized crime struck Mexico intensively from 2014 and 2021, driving historic levels of homicides. In the United States, the opioid crisis began to worry authorities due to the rapid increase in drug overdose deaths derived from the consumption substances typically manufactured in Mexico by transnational criminal organizations (TCOS). Literature on this topic is still scarce. However, Michael Ahn Paarlberg concludes that remittances from criminal activity occur at the individual and state level (Paarlberg, 2022). Steve Brito, Ana Corbacho and René Osorio found a correlation between remittances and a contraction of homicides per 100,000 inhabitants at a municipal level (Brito et al., 2014).
In the face of this conundrum, we question whether there is enough evidence to correlate the boom in Mexico’s remittances with Mexican TCOS and the outbreak of the drug overdose death crisis in the United States in 2015. We have posed three lines of inquiry: 1) Where do Mexican migrants choose to establish themselves in the United States and how has migration changed in the last four decades? 2) What kind of relationship exists between Mexican TCOS and their activities on the one side and Mexican migrants living in the United States on the other? And finally, 3) What conclusions can be drawn from an exploratory data analysis (EDA), using public data related to these variables? In the first section, we identify the main origins and destinations of Mexican immigrants in the United States to see how migration has changed over the past decades.
In second part, we address the drug overdose death crisis in the United States and focus on the most affected region establishing possible linkages among migration, remittances, and criminality in Mexico. In the third section we conducted an EDA using data between QI-2015 and QIII-2021. We then ran correlations between drug overdose deaths, remittances, and unemployment between California and Texas versus the State of Mexico, Jalisco, Michoacan, Mexico City and Guerrero; and between New Mexico versus the State of Mexico, Mexico City and Guerrero. We found evidence that COVID-19 changed conditions of the Mexican immigrant employment market, making it possible to trigger an outstanding number of remittances. However, the possibility that this boom in remittances is also linked to a windfall in drug revenue from Mexican TCOS cannot be ruled out.
Mexican Migration: Origins and Destinations
According to Douglas S. Massey and colleagues in their paper entitled “The Geography of Undocumented Mexican Migration” (Massey et al., 2010), it is possible to conduct a census regarding the origin of Mexican migrants through the Matricula Consular, a document issued by Mexican authorities that is used by undocumented Mexicans living in the United States as an identification card that is recognized by U.S. authorities and other organizations. The origin of Mexican immigrants per region appears in Table 1. As can be seen, two regions, Historical and Central account for 82.6 percent of total migrants; the largest group is the former, with 45.2 percent composed mainly of Guanajuato (8.8 percent), Jalisco (10.8 percent) and Michoacan (12.6 percent). The second group, with a share of 37.4 percent, comprises Mexico City (6.6 percent), Guerrero (7.6 percent), State of Mexico (5.1 percent) and Oaxaca (5.5 percent), among others.
Table 1 REGIONAL AND STATE ORIGINS OF IMMIGRANTS REGISTERED IN MEXICO’S MATRICULA CONSULAR PROGRAM, 2006
| Region | Share (%) | Region | Share (%) |
|---|---|---|---|
| Historical | 45.2 | Central | 37.4 |
| Aguascalientes | 0.9 | Mexico City | 6.6 |
| Colima | 0.7 | Guerrero | 7.6 |
| Durango | 2.9 | Hidalgo | 2.8 |
| Guanajuato | 8.8 | State of Mexico | 5.1 |
| Jalisco | 10.8 | Morelos | 2.2 |
| Michoacan | 12.6 | Oaxaca | 5.5 |
| Nayarit | 1.8 | Puebla | 6 |
| San Luis Potosi | 2.9 | Queretaro | 1.2 |
| Zacatecas | 4.2 | Tlaxcala | 0.6 |
| Border | 10.7 | Southeast | 6.4 |
| Baja California | 1.1 | Campeche | 0 |
| Chihuahua | 2.3 | Chiapas | 1.2 |
| Coahuila | 1.1 | Quintana Roo | 0.2 |
| Nuevo Leon | 1.5 | Tabasco | 0.2 |
| Sinaloa | 2.0 | Veracruz | 4.3 |
| Sonora | 0.9 | Yucatan | 0.5 |
| Tamaulipas | 1.8 |
Source: Compiled by Gerardo Reyes based on Massey et al. (2010).
From 1910 to 1960, 90 percent of Mexican immigrants were living in border-lands (California, Arizona, New Mexico, and Texas), as well as the industrial hub of Illinois. By 1960, 42 percent of all Mexican immigrants lived in California, 36 percent in Texas, 6 percent in Arizona and 2 percent in New Mexico. In 1980, 57 percent were living in California, 23 percent in Texas and 8 percent in Illinois. After 1986, immigration became more difficult due to stricter border controls as the result of immigration reforms. From 1993 onward, the U.S. Border Patrol began to militarize border crossings such as El Paso and San Diego. At the same time, the U.S. government began to build a wall along the border. These measures led illegal immigrants to explore new routes, and the borderlands and Illinois were no longer the primary destinations of subsequent migration waves. After 2003, Mexican migrants went to the Northwest (Idaho, Nevada, Oregon, Utah and Washington); the Northeast (Connecticut, Maine, Massachusetts, New Hampshire, New Jersey, New York, Pennsylvania, Rhode Island and Vermont); the Great Lakes region (Illinois, Indiana, Michigan, Ohio and Wisconsin); the Deep South (Alabama, Arkansas, Kentucky, Louisiana, Mississippi, and Tennessee), and the Great Plains (Colorado, Iowa, Kansas, Minnesota, Missouri, Montana, Nebraska, North Dakota, Oklahoma, South Dakota and Wyoming). In 2006, 60.9 percent of all documented Mexicans lived in the borderlands, 8.5 percent in the Northwest, 12 percent in the Great Lakes region, 2.9 percent in the Northeast, 9.6 percent in the Southeast, 1.5 percent in the Deep South and 4.7 percent in the Great Plains. In this context, the same document (Massey et al., 2010) traced the top five preferred cities by Mexican immigrants until 2006: Los Angeles (13 percent), Chicago (9.8 percent), Dallas (6 percent), Santa Ana (5.5 percent), and Houston (4.9 percent). After 2006, the new favorite cities were Atlanta (3.9 percent), Phoenix (3.1 percent), Raleigh-Durham (2.6 percent), and Portland (2.2 percent).
Massey et al. inform about the state-to-state flows involving 10,000 or more migrants. The most important flows connect California with Jalisco and Michoacan, involving 64,000 people; these flows are followed by Guerrero-California (30,000) and Mexico City-California (26,000); Guanajuato-California, Oaxaca-California and Puebla-California (23,000 migrants each). Secondly, Texas-Guanajuato (22,000) and Texas- San Luis Potosi (19,000). Thirdly, Arizona-Tamaulipas, Illinois-Tamaulipas, Arizona- Michoacan and Illinois-Michoacan (13,000 each). The same source concluded that 60 percent of the 45 flows registered involved traditional regions of origin and destination. In terms of state to city flows, the most outstanding were Los Angeles as the main destination for migrants coming from Jalisco, Michoacan, Puebla and Mexico City; Chicago with Jalisco, Michoacan, Mexico, Guerrero, Guanajuato; and Dallas with Guanajuato.
Net flows from Mexico to the United States have varied since 1990. Daniel Chiquiar and Alejandrina Salcedo (2013) estimated that from 1990 to 2000, 466,000 Mexicans emigrated to the United States annually. Net flows reached their lowest levels during the economic crisis of 2008. Apart from the subprime crisis and Obama’s deportation program (Brotherton, 2018), three elements could have driven down Mexican migration: 1) a more stable economy in Mexico, 2) stricter controls on the Mexican-U.S. border and 3) aging of Mexican population as well as a constant reduction in fertility rates. During 1990-2000, most of migrants were low skilled and worked in the agriculture and construction industries located in borderlands, mainly in California. After that period, the number of migrants diminished, and their skills improved. Migrants had better education, were fewer in numbers and went to other U.S. states and regions including the Northeast. Chiquiar and Salcedo (2013) also found that as digitalization started to replace jobs with computers and handheld devices, a qualitative change in jobs taken by Mexicans took place, going from simple repetitive activities to more complex ones. This was also accompanied by a slight reduction of wages for jobs typically taken by Mexicans. Furthermore, Ana Gonzalez-Barrera from the Pew Research Center (Gonzalez-Barrera, 2020) distinguished four overlapping periods that reflect net flows between Mexico and United States. In the first one (1990-2000) 670,000 Mexicans returned to Mexico from the United States and 2,940,000 went from Mexico to the United States, for a positive net outflow of 2,270,000; in the second one (2005-2010) 1,390,000 came back and 1,370,000 left for the United States, resulting in a negative net flow of 20,000; in the third one (2009-2014) 1,000,000 went back to Mexico and 870,000 emigrated to the United States, for a negative flow of 130,000 and in the fourth period (2013-2018) 710,000 came back and 870,000 went to the United States, which equals a positive outflow of 160,000. Gonzalez-Barrera noticed a drop of 1.4 million Mexican migrants going from 12.8 million in 2007 to 11.4 million in 2019. The same source noted that in 1970 almost 1 million Mexican immigrants lived in the United States; 9.4 million in 2000 and 12.8 million in 2007. Decreases were also registered in entry permits granted to Mexicans during the pandemic: tourist and business visas, as well as Green Cards and working visas like H-2A or H-1B. However, apprehensions of illegal Mexican immigrants at the border soared from 166,458 in 2019 to 253,118 in 2020, outnumbering the non-Mexican illegal migrants for the first time since 2013. Many later became legal citizens through family sponsored channels. Many others benefited from the Deferred Action for Childhood Arrivals Program or (DACA) by which they were allowed to work, study and remain in the United States. It is estimated that more than 500,000 people benefited from this program (Batalova, 2020).
Drug Overdose Deaths, Mexican TCOS and Migration
According to the Wall Street Journal, 107,000 people in the United States died from overdoses of illicit forms of fentanyl in 2021. Since 2000, one million overdose deaths have taken place in the United States, with more than half occurring since 2015. Most of illegal fentanyl consumed in the United States is produced in clandestine labs in Mexico. Fentanyl is 50 times more potent than heroin, rather cheap, easy to get, and is classified as a synthetic drug because it is made of chemicals. Deaths are related to consumption of cocktails of fentanyl-methamphetamines and fentanyl-cocaine, as well as fake fentanyl-laced pills (Kamp, 2022). Table 2 shows the most affected states from the drug overdose death crisis. Based on information published by State Health Facts, most of the states are in the northeast region of the United States, with West Virginia, Ohio, Pennsylvania, Kentucky and Massachusetts listed among the top ten from 2015 to 2019 (KFF, 2022).
Table 2 ALL DRUG OVERDOSE DEATH RATE PER 100,000 PEOPLE
| 2015 | 2017 | 2019 | |||
|---|---|---|---|---|---|
| W. Virginia | 41.5 | W. Virginia | 57.8 | W. Virginia | 52.8 |
| New Hampshire | 34.3 | Ohio | 46.3 | Delaware | 48 |
| Kentucky | 29.9 | New Hampshire | 44.3 | D. of Columbia | 43.2 |
| Ohio | 29.9 | D. of Columbia | 44 | Ohio | 38.3 |
| Rhode Island | 28.2 | Pennsylvania | 37.2 | Maryland | 38.2 |
| Pennsylvania | 26.3 | Kentucky | 37 | Pennsylvania | 35.6 |
| Massachusetts | 25.7 | Maryland | 37 | Connecticut | 34.7 |
| New Mexico | 25.3 | Massachusetts | 36.3 | Kentucky | 32.5 |
| Utah | 23.4 | Delaware | 34.4 | Massachusetts | 32.1 |
| Tennessee | 22.2 | Rhode Island | 31.8 | New Hampshire | 32 |
| Connecticut | 22.1 | Maine | 31 | New Jersey | 31.7 |
| Delaware | 22 | Connecticut | 30.9 | Tennessee | 31.2 |
Source: KFF (2022).
According to information published by the Migration Policy Institute (2020) between 2015 and 2019, 1,800 Mexicans lived in West Virginia, a share of 0.0 percent of all immigrants from Mexico at that time (11,250,500); Delaware: 16,700 (1 percent); Pennsylvania: 56,500 (0.5 percent); Ohio: 45,000 (0.4 percent); Maryland 37,200 (2 percent); Connecticut 17,400 (0.2 percent); New Jersey 110,200 (1 percent); Massachusetts 14,900 (0.1 percent); New Hampshire, 2,100 (0.0 percent); Rhode Island 3,000 (0.0 percent); Kentucky 32400 (0.3 percent) and Tennessee 91,100 (0.8 percent). Conversely, borderlands showed a larger proportion of Mexican migrants: California 4,076,100 (36 percent); Arizona 511,900 (4.5 percent); New Mexico 135,700 (1.2 percent) and Texas 2,516,700 (22.4 percent). This means that there is a limited share of Mexicans living in the states where the opioid crisis is most acute (Migration Policy Institute, 2020). Therefore, the registered drug overdose deaths are not correlated to the number of Mexicans living in that region.
However, the 2020 National Drug Threat Assessment (DEA, 2021) affirms that while cocaine production and supply have been left to Colombian cartels-which collect their product from Colombia, Peru and Bolivia-Mexican criminal organizations are in charge of trafficking cocaine. Mexican organizations also widely dominate the heroin and synthetic drugs market in the United States. Colombian and Dominican criminal groups use the Eastern Pacific routes by means of go-fast vessels to move cocaine from South America to Mexico, but once on U.S. soil, U.S. criminal groups, as well as street gangs, perform the mid and retail-level distribution. Customers are additionally contacted through the dark web. The same source points out that 74 percent of the cocaine transportation takes place through the Eastern Pacific vector, 16 percent Western Caribbean vector, and 8 percent use the Caribbean corridor. Crack cocaine is managed by U.S. criminal groups and street gangs. The intensity of cocaine trade has been calculated through the seizures registered in Florida, California, Pennsylvania, and Puerto Rico.
The same DEA report (2021) has identified large flows of drug trafficking coming from Mexico into the United States. They have identified the Sinaloa and Jalisco Nueva Generación (CJNG) cartels as the most important suppliers of heroin, fentanyl, and methamphetamines in all forms. Heroin is produced in white powder and black tar with 47 percent and 45 percent purity, respectively. According to the DEA, Mexican TCOS have established sophisticated clandestine laboratories in Mexico to also produce derivatives like oxycodone pills (known as “Mexican Oxy” or “M30s”) and a combination of heroin-fentanyl and methamphetamine-fentanyl, using precursors imported from China and India. In this regard, fentanyl-laced counterfeit pills have been introduced into the U.S. market from 2019 on. This is attributable to Mexican TCOS seeking to distribute and reach prescription opioid users.
Poppy cultivation areas to produce heroin in Mexico fell from 41,800 hectares in 2018 to 30,400 hectares in 2019, but with no decline in the flows of heroin to the United States. Low poppy prices and higher demand for fentanyl are cited as reasons for the decrease in cultivation. It is believed that Mexican TCOS will dominate the fentanyl market in the future because they have proved to be highly adaptable and innovative. Regarding precursors to produce methamphetamines, for instance, they have changed from ephedrine and pseudoephedrine to phenyl-2-propanone (P2P), a reductive animation method, to produce highly pure and potent, but less expensive methamphetamines. Thus, they have displaced actual and potential internal U.S. competitors. Following the DEA report, the number of domestic methamphetamine laboratory incidents in the U.S. went from 23,703 in 2003 to 890 in 2019. This downtrend could be a consequence of Mexican imports substituting domestic production, since methamphetamine seizures on the south border increased from 10,960 kilograms in 2013 to 68,355 kilograms in 2019, a yearly annual increase of 29.8 percent. Clandestine labs are ubiquitous since they can be set up anywhere, including hotels, apartments, mobile homes, apartments, campgrounds, and commercial establishments. Mexican TCOS control wholesale shipments, while the distribution is shared with domestic criminal groups throughout the United States.
Innovative techniques of Mexican TCOS have also been detected in tricks used to smuggle drugs. They dissolve methamphetamines in a variety of liquids, including vehicle fluids, fuels, water, and alcoholic beverages, which are harder to detect. TCOS are responsible for trafficking these drugs across the southwest border. They use airlines, buses, trains, and shuttle services, as well as tractor trailers and parcel deliver services. Heroin continues to have a strong presence in the Great Lakes region, the Midwest, and the Northeast, and is highly intertwined with fentanyl. Fentanyl reports to the National Forensic Laboratory Information System increased 18 times, from 5,541 in 2014 to 100,378, in 2019. The DEA seized 6,951 kilograms of heroin in 2019, 30 percent more than in 2018. The states with most DEA fentanyl reports also have the most heroin reports: New Jersey, New York, Ohio, and Pennsylvania. Heroin reports are also alarming in California, Texas, and Florida. Fentanyl seizures in 2019 took place mainly in California, Arizona, and Texas, but also in Illinois, Ohio, Pennsylvania, New Jersey, and New York. California, Texas, and Arizona are the main entry points from heroin coming from Mexico. New York is regarded as the most significant heroin market and distribution hub in the United States (DEA, 2021). The DEA report notes that the COVID-19 pandemic triggered price increases of both heroin and fentanyl due to the restrictions imposed on the Mexico-U.S. border. Furthermore, the drug market has been changing, with fentanyl and fentanyl mixtures replacing drugs that used to be sold in a single form like heroin, methamphetamines, and cocaine. Deaths resulting from overdoses implicate the consumption of these new mixtures that bring Mexican TCOS high profit margins at the cost of the lethality. Thirty-eight states reported deaths attributed to fentanyl-laced counterfeit pills through January 2020. For instance, overdose deaths involving synthetic opioids other than methadone increased at 24.8 percent per annum on average, from 1,742 in 2005 to 31,335 in 2018.
Figure 1 plots the trajectory of murders related to organized crime in Mexico, remittances, and drug overdose deaths in the United States. We can observe that the three variables seem to increase simultaneously, accelerating the increase after 2015. Drug overdose deaths seemed to be stable until 2013, and although synthetic drugs have been in the market since the nineties, the boom in fentanyl consumption began in 2015. Drug overdose deaths and remittances behave similarly, whereas violent murders in Mexico have also augmented but more irregularly and with an important backlash in 2021; they have stabilized at around 35,000 murders a year on average.
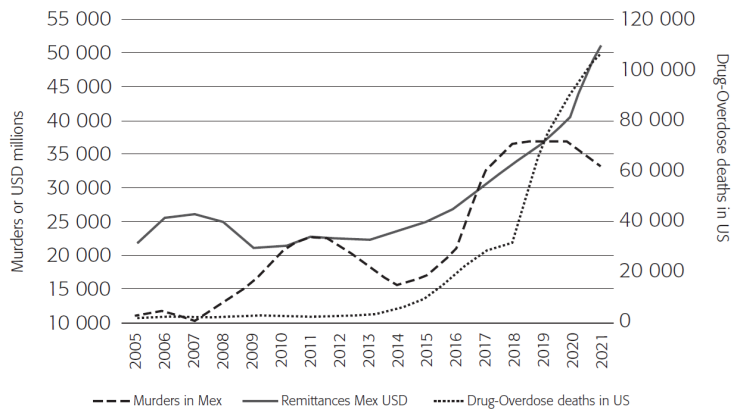
Source: Compiled by Gerardo Reyes based on INEGI (2022) and DEA (2021).
Figure 1 MURDERS, REMITTANCES AND DRUG-OVERDOSE DEATHS IN THE UNITED STATES
Table 3 displays the top seven states in violent murders and their share in remittances from 2003 to 2020. The high level of violence in terms of murders by the seven states is strongly correlated to a strong presence of CJNG and clandestine labs to produce synthetic drugs (Ravelo, 2016). The leader of the CJNG, Nemesio Oceguera Cervantes, was arrested in Sacramento, California when he was 25 years old (Ravelo, 2016). Thus, there could be relevant linkages between these groups and migrants living in borderlands. CJNG, La Familia Michoacana, Guerreros Unidos, Los Caballeros Templarios and La Familia are managing organized crime in the State of Mexico (Animal Político, 2020); Guerrero is a well-known place for opium plantations controlled by criminal groups, like Los Rojos and Guerreros Unidos. Four criminal groups have established themselves in Oaxaca: Cártel Pacífico-Sinaloa (CDP), CJNG, Cártel del Golfo (CDG) and Organización Criminal de los Beltrán Leyva (OCBL) (Pineda, 2021); La Familia Michoacana, Los Viagras and Las Autodefensas are operating in Michoacan (Abi-Habib, 2022) and the CJNG and Cartel Santa Rosa de Lima, among others, are dominating criminal activities in Guanajuato. CJNG and Cartel de Sinaloa, as well as local groups like Unión de Tepito, operate in Mexico City. The fact that these states accounted for 41.46 percent of violent murders between 2003 and 2020 and at the same time they also received 48.28 percent of remittances in the same period, give cause to suspect that the money sent could be camouflaging revenue from drug trafficking.
Table 3 MURDERS & REMITTANCES: 2003-2020
| Murders | Share (%) | Cumulative (%) | Remittances | Share (%) | Cumulative (%) |
|---|---|---|---|---|---|
| State of Mexico | 11.04 | 11.04 | Michoacan | 9.69 | 9.69 |
| Guerrero | 7.60 | 18.64 | Guanajuato | 8.67 | 18.36 |
| Oaxaca | 4.82 | 23.47 | Jalisco | 8.18 | 26.54 |
| Jalisco | 4.74 | 28.21 | State of Mexico | 6.64 | 33.18 |
| Michoacan | 4.51 | 32.72 | Oaxaca | 5.16 | 38.35 |
| Guanajuato | 4.48 | 37.20 | Guerrero | 5.11 | 43.45 |
| Mexico City | 4.44 | 41.64 | Mexico City | 4.83 | 48.28 |
Source: Compiled by Gerardo Reyes based on INEGI (2022).
Exploratory Data Analysis: Drug Overdose Deaths, Unemployment and Remittances
For this analysis, we will consider New Jersey and New York, two states located in the northeast region of the United States, where the drug overdose death crisis has been most acute and where Mexican migrants are also living. However, as we saw from Massey et al., most of the Mexican immigration is concentrated in the borderlands.
We took quarterly data published by Data Center for Disease Control (Centers for Disease Control and Prevention, 2022) from QI-2015 to QIII-2021 and found significant correlations between drug overdose deaths vs. remittances.
As can be seen from Table 4, the seven Mexican states receiving 40 percent of remittances show a positive significant correlation with drug overdose deaths in borderlands, as well with New Jersey and New York. Based on R2 and β2 (the coefficient’s slope of simple linear regression model), not all correlations are significantly over 0.8 in terms of R2. For instance, we read the first correlation of Table 4 as, for ever unit of remittances received in Mexico, there are on average 14.84 drug overdose deaths in California. Neither New Jersey (NJ) nor New York (NY) show R2 over 80 percent, so we can put them aside and concentrate the analysis on those states where R2 surpasses 80 percent (bold and italics in Table 4).
Table 4 DRUG OVERDOSE DEATHS IN THE UNITES STATES VS. REMITTANCES TO MEXICO: QI2015-QIII2021 (β2 AND R2)
| CA | AR | NM | TX | NJ | NY | ||
|---|---|---|---|---|---|---|---|
| State of Mexico | β 2 | 14.84 | 0.42 | 1.12 | 5.10 | 3.28 | 2.42 |
| R 2 | 0.88 | 0.71 | 0.86 | 0.87 | 0.46 | 0.62 | |
| Jalisco | β 2 | 7.77 | 0.21 | 0.56 | 2.68 | 2.08 | 1.35 |
| R 2 | 0.85 | 0.63 | 0.78 | 0.86 | 0.65 | 0.67 | |
| Guanajuato | β 2 | 9.87 | 0.26 | 0.72 | 3.41 | 2.94 | 1.71 |
| R 2 | 0.69 | 0.50 | 0.64 | 0.69 | 0.65 | 0.54 | |
| Michoacan | β 2 | 9.21 | 0.25 | 0.67 | 3.17 | 2.48 | 1.58 |
| R 2 | 0.82 | 0.60 | 0.75 | 0.82 | 0.63 | 0.62 | |
| Oaxaca | β 2 | 19.40 | 0.54 | 1.42 | 6.72 | 2.94 | 1.71 |
| R 2 | 0.71 | 0.54 | 0.66 | 0.72 | 0.60 | 0.55 | |
| Mexico City | β 2 | 13.56 | 0.36 | 1.01 | 4.64 | 2.83 | 2.22 |
| R 2 | 0.92 | 0.65 | 0.89 | 0.91 | 0.42 | 0.65 | |
| Guerrero | β 2 | 18.80 | 0.52 | 1.40 | 6.46 | 4.35 | 3.10 |
| R 2 | 0.87 | 0.67 | 0.84 | 0.87 | 0.50 | 0.62 |
Source: Centers for Disease Control and Prevention (2022) and Banxico (2022).
In looking at Figure 2, we observe remittances on the x-axis and drug overdose deaths on the y-axis. For example, if we read the first graph at the top left corner, we see that remittances in Mexico spiked from a US$369.50 monthly average to a more than US$846.70 monthly average, while drug overdose deaths in California increased from 4,608 to 10,635. Running a simple linear regression, we obtain the equation1 CA= -1332.35+14.81 (Mexico); R2: 0.8899. Thus, California’s drug overdose deaths showed a significant correlation with remittances sent to Mexico (0.8899), Jalisco (0.8574), Michoacan (0.8217), Mexico City (0.9254) and Guerrero (0.8798). Texas had also an important correlation with the same states; Mexico (0.8798), Jalisco (0.8632), Michoacan (0.8216), Mexico City (0.9132) and Guerrero (0.8759). New Mexico’s drug overdose deaths presented a significant correlation with remittances in Mexico (0.8684), Mexico City (0.8936) and Guerrero (0.8467).
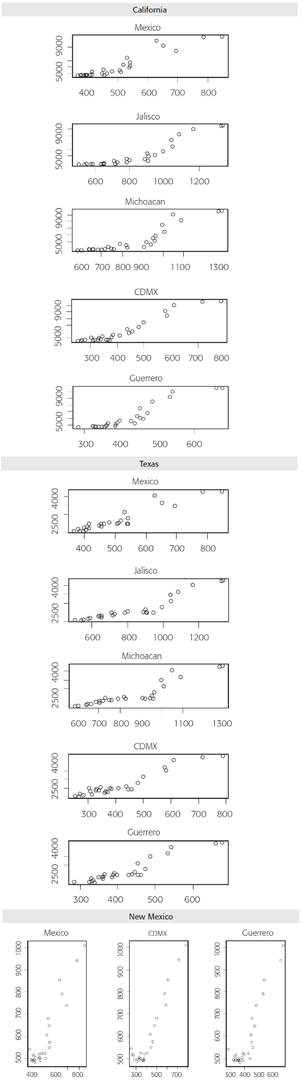
Source: Compiled by Gerardo Reyes based on INEGI (2022).
Figure 2 DRUG OVERDOSES VS. REMITTANCES WITH A R2 OVER 0.80
A typical source of remittances is the economic activity in the United States, reflected in rates of unemployment, so the higher the unemployment rate, the less the working opportunities for Mexicans and the less the number of remittances sent to Mexico. This was typically the case during the Great Recession of 2008, when remittances fell from US$25.5 billion in 2008 to US$21.9 billion in 2009.
As we can see from Figure 3, there was a spike in the unemployment rate during the COVID-19 pandemic in March 2020, reaching its highest point in June 2020 at 14.1 percent in California, 10.1 percent in Texas and 9.5 percent in New Mexico. If we correlate unemployment rates with overdose deaths in those states, we find a mild significant but positive correlation in terms of p-value and R2 in California (p-value: 0.00261; R2: 0.309), Texas (0.00253; R2: 0.3106) and New Mexico (0.0284; R2: 0.1779).
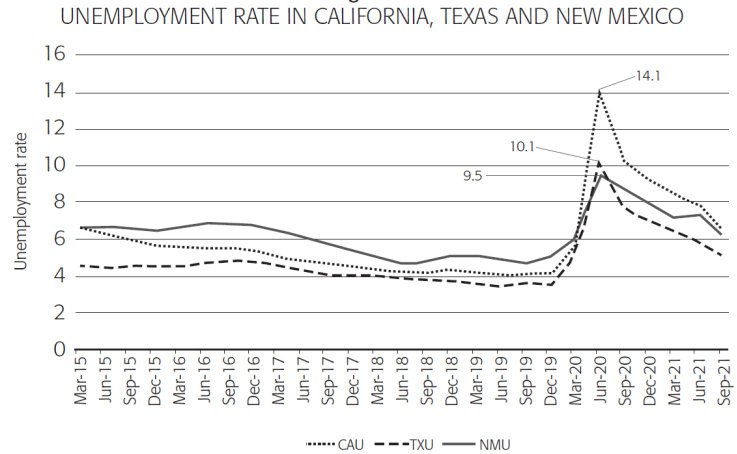
Source: Compiled by Gerardo Reyes based on USBLS (2022).
Figure 3 UNEMPLOYMENT RATE IN CALIFORNIA, TEXAS AND NEW MEXICO
In Figure 4 we can see first a correlation between unemployment in California and remittances in the States of Mexico; California vs. Jalisco; California vs. Michoacan; California vs. Mexico City and California vs. Guerrero. The size of the spheres represents California’s number of drug overdose deaths in thousands and the gray color the year in which they occurred. Smaller spheres colored in dark gray represent numbers taking place between 2015 and 2019 and indicate a normal correlation between lower rates of unemployment and larger number of remittances by the five states. However, as spheres turn bigger and lighter gray (in all five cases occurring between 2020 and 2021), to a larger the number of drug overdose deaths, corresponds a larger number of remittances and a higher rate of unemployment. In fact, the COVID-19 pandemic was a game changer since bigger spheres appear in the upper right area of the graph. The correlation between unemployment and remittances is still negative but reflect higher levels of unemployment and larger numbers of overdose deaths; all taking place between 2020 and 2021 as the lighter gray color spheres indicates. The same pattern can be observed between unemployment in California and remittances in Jalisco, Michoacan, Mexico City and Guerrero. Therefore, the COVID-19 pandemic affected the correlation unemployment-remittances by creating two episodes: in the first one 2015-2019, the correlation is negative with smaller and deep gray spheres, portraying a falling unemployment rate with increasing number of the remittances; in the second, higher unemployment rates are correlated with much larger average of remittances per month. Thus, we can sustain the hypothesis that Mexico’s spike in remittances is not correlated with historical low rates of unemployment and this boom in remittances coincides with higher prices of synthetic drugs and larger numbers of drug overdose deaths. The same pattern with slight differences can be observed in Texas (Figure 5) and New Mexico (Figure 6), respectively.
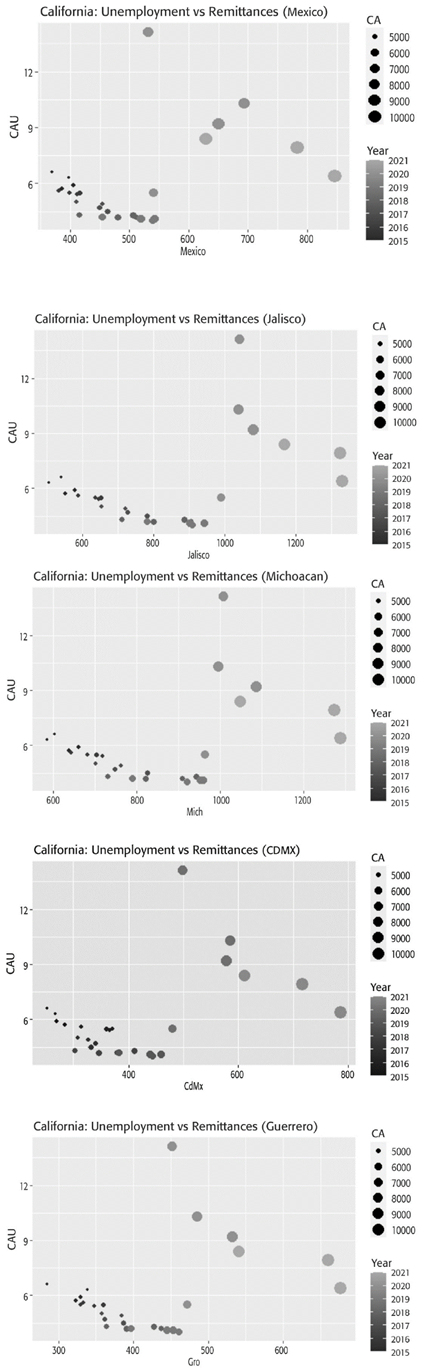
Source: Compiled by Gerardo Reyes based on INEGI (2022) and USBLS (2022).
Figure 4 CALIFORNIA: UNEMPLOYMENT VS REMITTANCES AND OVERDOSE DEATHS PER YEAR

Source: Compiled by Gerardo Reyes based on INEGI (2022) and USBLS (2022).
Figure 5 TEXAS: UNEMPLOYMENT VS. REMITTANCES AND OVERDOSE DEATHS PER YEAR

Source: Compiled by Gerardo Reyes based on INEGI (2022) and USBLS (2022).
Figure 6 NEW MEXICO: UNEMPLOYMENT VS. REMITTANCES AND OVERDOSE DEATHS PER YEAR
Conclusions
Based on the analysis made from publicly available data, we found answers to the questions posed at the beginning of this paper. First, there had been structural changes in Mexican migration since 1970. Mexicans continued to migrate to the borderlands but as the migration policy became stricter, they began to splinter into other regions of the United States. There was an important contraction in migration flow in the first decade of the 21st century, especially during the Great Recession in 2009 and the Obama administration, but in 2017 Mexican migration rebounded and then increased sharply during the COVID-19 pandemic. Secondly, the presence of Mexican immigrants in the northeast region of the United States, where the opioid crisis has been most acute, proves to be meaningless. That means that the drug supply there must have been eased by U.S. domestic criminal networks. However, the share of Mexican immigrants living in borderlands turned to be highly significant while the opioid crisis there was also an issue. Mexican TCOS are responsible for the production and export of heroin, methamphetamines, and modern synthetic drugs (fentanyl). They seemed to be correlated to migrant routes and networks, since their presence in seven states that registered 41.44 percent of violent murders were also those that received 48.28 percent of remittances between 2003 and 2020. Thirdly, a first moment using EDA showed a significant positive correlation between drug overdose deaths and remittances in these seven states and borderlands as well as New Jersey and New York. However, the highest significant correlations were found between California and Texas versus Mexico, Jalisco, Michoacan, Mexico City and Guerrero, respectively, and between New Mexico versus the State of Mexico, Mexico City and Guerrero. In a second moment, a correlation was run between unemployment rates in the borderlands and remittances received in the seven Mexican states, indicating at the same time, the number of drug overdose deaths and the year in which they took place. In all three U.S. borderland states, the graphs show that COVID-19 made a dent in this matter. From 2015-2019 the correlation between unemployment and remittances was negative, so to a smaller extent, the unemployment rate corresponds a higher level of remittances. That result follows the fundamentals of economic theory. However, from 2020 to 2021, the correlation was also negative but at higher levels of unemployment and larger amounts of remittances, both matching with larger number of drug overdose deaths. This could either be the result of more migrants working in the United States or higher revenues obtained by Mexican TCOS due to higher drug prices during the lockdowns and freezing of economic activity during the COVID-19 pandemic. This conclusion represents a single approach to a complex and dynamic phenomenon, and it is based on public data.

