


 nueva página del texto (beta)
 Inglés (pdf)
 Artículo en XML
 Referencias del artículo
 Enviar artículo por email
 Citado por SciELO
  Similares en
SciELO
Similares en
SciELO 
 Permalink
Introduction
The emergence of China as a direct investor in Latin America and the Caribbean (LAC) has been verified since 2010. In 2020, China displaced the United States as the main country of origin of cross-border Mergers and Acquisitions (M&A) type investments and ranked fourth as the origin of new greenfield projects (ECLAC, 2021). This process has been accompanied by a growing diversification of investments towards activities in electricity, construction of transport infrastructure, manufacturing, finance, and information and communication technologies (ECLAC, 2021; Dussel Peters, 2021). Chinese direct investors in Mexico are predominantly private companies that arrive through new projects aimed at the auto parts and automotive industry (AAI), as well as transportation and communications.
The article examines the determinants of Chinese direct investment in Mexico from a systemic and territorial perspective. The premise is that the growing presence of direct investment by Chinese private companies in the AAI is explained by the favorable prospects for demand generated by the presence of global assemblers in Mexico. Location variables also play a role, such as proximity to the United States, agglomeration economies and the benefits of the United States-Mexico-Canada Agreement (USMCA).
The document is structured in four sections. The first part describes the behavior of overseas foreign direct investment (OFDI) from China to Mexico since 2010. The second part introduces the OLI paradigm, allowing to understand the reasons behind the internationalization of multinational enterprises (MNE) towards developing countries. The third part provides an overview of the international empirical literature on the determinants of China’s OFDI and the internationalization of its MNEs, with an emphasis on location variables. The fourth part provides evidence of the determinants of location of Chinese investment in the AAI in the Mexican state of Aguascalientes from two dimensions: i) the regional perspective to investigate the possible presence of agglomeration economies, this through the spatial correlation index of Moran and heat maps and ii) the case study of the Chinese subsidiary Minth Aguascalientes based on a triangular approach. The last section is dedicated to the conclusions.
Conduct of Overseas Direct Investment from China to Mexico
According to the Monitor of Chinese OFDI in Latin America and the Caribbean 2021 (Dussel Peters, 2021), in the period 2010-2020 the accumulated flow of Chinese OFDI in LAC was 139,191 million dollars, a figure seven times higher than that of the period 2000-2009. The relative share of these flows in global foreign direct investment rose from 1.44 percent between 2000-2004 to 7.99 percent between 2015-2020. Brazil, Peru, Chile, Argentina, and Mexico have together captured 85.50 percent of Chinese OFDI. The predominant mode of entry is cross-border M&A, which has represented 70.64 percent of Chinese OFDI since 2010.
The relative share of Chinese investment in raw materials fell from 81.39 percent in 2000-2004 to 51.43 percent in 2015-2020, in contrast, the share of manufacturing increased (from 1.19 percent to 17.93 percent). The predominant investment agent is the public company, which has been responsible for almost four-fifths on average of Chinese direct investment in the region.
Mexico advanced from position seven to position five as the destination of Chinese OFDI in LAC, going from 1,088 million dollars to 12,946 million dollars in the reference period (Dussel Peters, 2021). In the regional context, Mexico appears as the second destination of Chinese OFDI directed to manufacturing and as the first destination in the AAI since 2010. In this regard, 100 percent of the Chinese OFDI in the AAI originated after 2010 and from this, 97.45 percent has been produced since 2015. Despite the Chinese OFDI boom, its share in global direct investment went from 0.19 percent in 2010 to 0.68 percent in 2020 and in manufacturing it went from 0.22 percent to 0.80 percent (SE, 2022).
Seventeen Chinese companies have carried out 22 transactions in the AAI, accumulating an investment of 4,130 million dollars (see Table 1). The following aspects stand out: i) Hidalgo, Jalisco, Coahuila, San Luis Potosí and Aguascalientes have captured 83.17 percent of the Chinese OFDI in the AAI: ii) two companies belong to the terminal segment (BAIC and JAC Motors) and their investment represents a quarter of the cumulative flow of Chinese direct investment in the AAI since 2017; iii) 12 private equity companies have accounted for 95 percent of Chinese investment.
Table 1 MEXICO: CHINESE INVESTMENT IN THE AAI AT THE COMPANY LEVEL (2009-2019)
| Year | Investment company | Destination territory | Employment (number of workers) | Investment (millions of dollars) | Company type |
|---|---|---|---|---|---|
| 2009, 2014 2017 | Minth Group (3) | Aguascalientes | 2 010 | 403 | Private |
| 2014-2017 | Saargummi (2) | Coahuila, Querétaro | 1 200 | 38 | Public |
| 2015 | AMI PPM de Mexico (1) | San Luis Potosí | 100 | 500 | Private |
| 2015 | Ningbo Jinlong Electric Appliance Co., Ltd. | Jalisco | 10 | 932 | Private |
| 2015-2017 | Sanhua Automotive (2) | Coahuila | 21 | 600 | Private |
| 2016 | Zhuzhou Times New Material Tech (1) | San Luis Potosí | 373 | 43 | Public |
| 2017 | BAIC (1) | Ciudad de México | 500 | 30 | Public |
| 2017 | Cheerson (1) | Querétaro | 200 | 8 | Private |
| 2017 | JAC Motors (1) | Hidalgo | 4 400 | 1 000 | Private |
| 2017 | Key Safety Systems (1) | Tamaulipas | 1 800 | 89 | Private |
| 2017 | Suzhou Sonavox Electronics (1) | Tlaxcala | 205 | 3 | Private |
| 2017 | Pirelli (ChemChina2015) (1) | Guanajuato | 400 | 200 | Private |
| 2018 | Beijing West Industries (1) | Chihuahua | 280 | 62 | Public |
| 2018 | XZB (1) | Nuevo León | 50 | 9 | Private |
| 2018 | Yanfeng Global Automotive (1) | Querétaro | 1 200 | 50 | Public |
| 2018 | Mexin (1) | Nuevo León | 460 | 28 | Private |
| 2016-2019 | Minghua de México (2) | San Luis Potosí, Puebla | 750 | 135 | Private |
| Total | 17 | Querétaro (3/16) | 13 959 | 4 130 | 12/17 private |
Source: Developed by the authors based on Dussel Peters (2021).
In sum, unlike LAC, Chinese companies in Mexico predominantly arrive at the AAI, with new investments and joint ventures (JV) being the most usual entry modes, and the predominant investment agents being private. All the above warns of the potential of Chinese companies to help amplify the capital stock and generate technology and knowledge transfer processes in Mexico.
The search for profits that usually typifies private investment responds to the prospects of demand and its behavior is affected by a group of systemic and territorial determinants that can be ordered according to Dunning’s eclectic paradigm, which will be discussed below.
Review of Theoretical and Conceptual Bibliography
The eclectic OLI paradigm is useful to identify the variables that affect the internationalization of the MNE (Dunning and Lundan, 2008). The paradigm assumes that a company’s cross-border value-added activities depend on it meeting four conditions: i) it has unique and sustainable ownership (or O-type) advantages over local and other national companies; ii) that it perceives that it is in its best interest to add value to its type O advantages instead of selling them to independent foreign companies, these are called internalization (or type I) advantages; iii) that its global interests are satisfied through the creation, access or use of its type O advantages abroad. In addition, it is assumed that the spatial distribution of resources, capabilities and institutions linked to location (type L advantages) is unequal, therefore, it will confer a competitive advantage to the countries that possess them; iv) given the specific configuration of OLI, internationalization will be verified if the company considers that production abroad is consistent with its long-term objectives. Thus, the more Type O advantages a company from one country has over those from other countries, the greater its incentive to internalize its activities, the more interested the company will be in exploiting location advantages abroad, and the more likely it will be for it to participate in OFDI.
The industrial organization theory studies type O advantages, which arise from the possession of specific assets, providing MNEs with superior comparative advantages over national companies, and which derive from their superior market power (Hymer, 1982). Dunning and Lundan (2008) have studied three modalities of type O advantages: asset, transaction and institutional.
The property rights and internalization theory explain why firms internalize activities abroad (Buckley and Casson, 2009). Among the type I advantages, it stands out that the company seeks to avoid situations such as: search and negotiation costs; moral hazard and adverse selection costs; the cost of broken contracts and subsequent litigation; the buyer’s uncertainty about the nature and value of the inputs; or exploit government intervention.
They are also presented due to the seller’s need to: protect the quality of intermediate or final products; capture external economies; control supplies, etc. (Dunning and Lundan, 2008).
The location and international trade theories address the factors that explain the location of production and can favor host countries to the extent that they have the potential to increase their bargaining power vis-a-vis the MNE. The L determinants can be classified into four motivations (Dunning and Lundan, 2008):
Market search is guided by market size (local and adjacent), consumer preferences, market structures, psychic distance, etc.
The search for resources is guided by the costs of: land, construction, rent, raw materials and intermediate inputs, unskilled and skilled labor, etc.
The search for efficiency is guided by productivity, transportation and communication costs, membership of a regional integration agreement, institutions, etc.
The search for strategic assets is guided by competition policies; technological, managerial, and relational assets; physical infrastructure and business ecosystem.
Location decisions and the causes of spatial concentration (which lead to agglomeration economies) are closely linked and constitute the object of study of economic geography and urban and regional economics (Capello, 2007; Fischer and Nijkamp, 2014). Agglomeration economies contribute to firm performance through local knowledge spillovers, concentrations of skilled workers, or the presence of local inputs. The advantages derived from the economies of scale linked to the economies of location and urbanization can also be counted among the causes of concentration (McCann and Van Oort, 2019).
The updated paradigm accepts that OLI benefits are dynamic and interdependent and that certain contextual variables influence the OLI configuration. In other words, the propensity of the company to participate in OFDI depends on the specific economic, territorial, institutional, and cultural characteristics of its countries (of origin/destination), the type of industry and the company’s own management and strategy. With this, the flexibility of the OLI paradigm allows examining the incentives of MNE based in developing countries, through the incorporation of contextual variables (Basave, 2016).
For Basave (2016) the contextual variables as contingency factors should be read as factors that condition the responses of the MNE based in developing countries. However, it has also been pointed out that the success of an internationalization strategy for an MNE depends not only on contextual variables, but also on absorption capacity (Petti, et al., 2021). Absorptive capacity refers to the company’s ability to recognize the value of new external information, to assimilate it and apply it for business purposes (Cohen and Levinthal, 1990), so it is influenced by the characteristics of the environment where it operates (Narula and Driftfield, 2012).
Review of Empirical Literature
Studies at the OFDI Flows Level
The literature roughly identifies market size, agglomeration economies, political environment, exchange rate, natural resource endowment, technology, and culture as the main determinants of Chinese OFDI. These factors differ according to the destination region and the type of project: while greenfield projects allow companies to penetrate sectors where they have well-developed capabilities, M&As allow them to ensure the supply of natural resources in LAC, and access to technology leading in Europe and North America (ECLAC, 2021). The incentives differ depending on the agent: while public companies pursue China’s strategic needs and invest in natural resources through M&A, private companies consider political risk and are therefore guided by demand prospects and strategic assets (Dreger, et al., 2017).
A group of recent investigations provide empirical evidence in such aspects:
Hai, et al. (2017) examine Chinese OFDI targeting 93 countries between 2003-2015, distinguishing two groups: 49 countries covered by the One Belt One Road Initiative (OBOR) and 44 countries outside the OBOR. They found that OFDI in OBOR countries is stimulated by: i) the appreciation of the renminbi, to the extent that it reduces the cost of acquiring certain foreign assets; ii) the market potential and the coefficient of external openness. They found that China invests in countries with less infrastructure (to the extent that it opens up business opportunities) and that natural resource endowments attract/do not attract Chinese OFDI in non-OBOR/OBOR countries.
Dreger, et al. (2017) examines Chinese OFDI in the EU for 2003-2014, distinguishing between new investments and M&A. They identified the size of the market and bilateral trade as the main attractions. They found that high labor costs (LC) inhibit new investments, but do not affect M&A investments, since established companies have already demonstrated their ability to compete even in the presence of high LC.
Mumtaz and Smith (2018) examined Chinese OFDI in 67 countries during 2006-2015. They classified the countries into three groups: one (26 countries from Asia and Eastern Europe), two (24 African countries), and three (17 LAC countries). For the entire sample, OFDI was positively related to competitiveness and inversely to GDP, wages, country risk, and distance. By region, it was observed that: the product was positively associated in group 1, while for LAC it showed a negative effect; the search for raw materials influenced the OFDI directed to LAC; and the risk variable was positive in all regions.
Several authors have verified the influence of agglomeration economies in the location decisions of Chinese OFDI. In the context of the OBOR initiative, Hai, et al. (2018) found that between 2004 and 2015, there was a clear effect of agglomeration economies in 129 recipient countries of Chinese OFDI targeting the manufacturing industry. In a panel study for 19 countries (the most important as origin and destination of global direct investment), Choi, et al. (2020) found that the agglomeration of Chinese companies abroad had a positive influence on the location decision of Chinese OFDI in these territories during the period 1997-2015.
Tuman and Erlingsson (2020) examine Chinese OFDI in the 32 states of Mexico during 2004-2014. They found that the size of the market, a skilled labor force, the presence of seaports, and partisan control of state government influence the selection stage. On the other hand, the level of Chinese FDI responds to the market potential and the qualification of the labor force. Mining resources, homicides, unionization, and state taxes do not have significant effects.
Studies at Company Level
In 2016 CAITEC, MOFCOM, et al. (2017) applied a questionnaire to 543 Chinese companies operating in OBOR countries. Among the characteristics of the companies, it was found that: 59 percent are private; 45 percent have operated abroad for more than 10 years; a third showed an investment scale of more than 100 million dollars (md); 55 percent belongs to the manufacturing and construction industry; 51 percent enter through new investments. The questionnaire provides an indirect understanding of some of the motivations behind the internationalization strategy of Chinese companies in the OBOR region:
Strong relationship between size, antiquity, and profitability. Companies with an investment of more than 50 million dollars and with 10-15 years of existence showed higher levels of profitability. Likewise, 56 percent of the companies have obtained profits.
They seek to exploit certain ownership advantages, such as work ethic, high productivity, low costs, advanced technology and equipment, qualified work-force, and financial support.
The market search has been an investment incentive. 74 percent of the companies mainly serve the host country market and 66 percent indicated that they have long-term plans (more than 10 years) for their operations in the host countries.
They seek to take advantage of location advantages linked to local supply chains. More than 51 percent expressed their preference for purchasing supplies and services locally. For 114 companies, local contracting represented more than 40 percent of their total purchases.
At a macro level, 93 percent of companies take the development strategies of the host countries into account; 357 companies depend heavily on financing from Chinese institutions. The main macro risks identified are political situation, employee safety, inflation, labor issues and corruption.
Studies of Chinese companies in LAC identify uncertainty and the investment maturation/learning period as determining factors. The lack of information from the Chinese company regarding specific issues (e.g., suppliers, customers, regulations), as well as the little knowledge of the LAC governments about Chinese companies (Dussel Peters, 2019) are conditions that increase the uncertainty factor, which, in turn, adversely impacts profitability. At the country level, the following stand out:
In Argentina, Chinese public companies are guided by political objectives, focused on ensuring the supply of food to China. They also have a unique advantage: financing (Stanley, 2019). The oil companies CNOOC and Sinopec seek resources and increase their technical experience via JV. Huawei seeks to supply the domestic market with communication equipment produced in China and increasingly through maquila, which is driven by sector policy (López and Ramos, 2014).
The predominance of Chinese state-owned companies in Brazil reveals the central role of state planning in the internationalization process and its articulation with a national development strategy (Hiratuka, 2019). Chinese OFDI in Brazil is guided by market potential (in the case of Lenovo) and follows the public policy agenda of that country (in the case of State Grid) (De Freitas et al., 2014).
The automakers Chery and Lifan went to Uruguay because it is an ideal way to enter the Mercosur region under more favorable conditions, in terms of requirements to import inputs and regional content (Bittencourt and Reig, 2014).
The low Chinese OFDI in Mexico reveals uncertainty, which is manifested in the cautious posture of Chinese companies in the face of the “complexity” of the Mexican market, all of which has been derived from: i) the cancellation and/ or failure of important investment and infrastructure projects, e.g., the FAW-Grupo Salinas alliance, Dragon Mart, and the Mexico-Querétaro fast train; ii) the psychic distance in business culture and the little knowledge about Chinese companies in Mexico (Monitor de la Manufactura Mexicana, 2015). Psychic distance can be defined as “the factors preventing or disturbing firms learning about and understanding of a foreign environment” (Vahlne and Nordstrom, 1992: 3). At the company level, Huawei is looking for a market and has overcome various entry barriers such as corporate cultural differences and mistrust towards Chinese brands (Dussel Peters, 2014). On the other hand, FAW Trucks entered Mexico in a JV with Giant Motors Latin America, motivated by the strength of the automotive industry in Mexico, the rules of origin of the North American Free Trade Agreement (NAFTA), the Mexico-United States transportation costs and low-cost supply (Dussel Peters, 2014).
In sum, an expanding domestic market, a qualified labor force, the presence of seaports, the proximity to the United States, the benefits of NAFTA, and the strength of the industry, are incentives for Chinese OFDI in Mexico. In contrast, the uncertainty factor and psychic distance are factors that inhibit investment.
Determinants of Chinese OFDI in Mexico: The Case of the Company Minth
This section analyzes, first, the productive structure and degree of specialization in the transport equipment manufacturing sector in the Mexican microregion of Aguascalientes, where Minth, one of the 100 most important companies in the sector, is located. In addition, evidence of the presence of agglomeration economies in the sector and region where this company carries out its operations is presented through two instruments: heat maps with kernel density and global spatial association index. Finally, information is presented on the profile and characteristics of this company to have elements that allow us to think about the determinants of direct foreign investment in the sector.
Regional and Local Determinants: The Forces of Agglomeration
Productive Structure of Microregions and Specialization. To examine the location factors of Chinese OFDI in Mexico from a regional perspective, the territorial areas were delimited for nine microregions in which the 11 Chinese companies identified in Table 1 are located. The delimitation of the spatial units of analysis was made based on the location of 11 companies in the automotive and auto parts sector depicted in Table 1. Based on the location of such companies, nine micro-regions were identified based on the methodological proposal of the Center for Regional and Sustainable Urban Development Studies (Cedrus) of the National Autonomous University of Mexico (Universidad Nacional Autónoma de México, UNAM), which groups the national territory into homogeneous areas. from local administrative units (Asuad, 2020). The set of nine microregions is made up of 100 local demarcations that cover an area equivalent to 6.5 percent of the Mexican territory. Table 2 reports the results for the microregion of Aguascalientes, where the Minth company is located.
Table 2 MEXICO: VALUE ADDED, EMPLOYMENT AND LOCATION COEFFICIENT AT THE MICRO-REGION LEVEL
| Indicator | Aguascalientes micro-region | Nine micro-regions | National | |||
|---|---|---|---|---|---|---|
| Higher education, 2020 | 19.51 | 20.94 | 16.10 | |||
| Health services, 2020 | 81.07 | 80.52 | 73.47 | |||
| Total EAP, 2020 | 50.64 | 50.53 | 49.42 | |||
| Human development index, 2015 | 0.71 | 0.70 | 0.77 | |||
| Marginalization index, 2020 | 58.04 | 56.98 | 53.91 | |||
| Population density, 2020 (inhab/kmˆ2) | 343 | 122 | 111 | |||
| Aguascalientes micro-region | Nine micro-regions | National | ||||
| Value added (%) | Employed personnel (%) | Value added (%) | Employed personnel (%) | Value added (%) | Employed personnel (%) | |
| Manufacturing (2018) | 66.13 | 36.32 | 53.02 | 33.48 | 23.93 | 31.99 |
| Transportation equipment | 75.57 | 37.06 | 48.50 | 29.61 | 19.9 | 31.4 |
| Food | 5.45 | 11.59 | 6.34 | 10.36 | 16.8 | 14.2 |
| Computer and electronic product | 3.50 | 9.02 | 1.22 | 2.83 | 5.8 | 3.1 |
| Beverage and tobacco product | 3.42 | 3.72 | 3.07 | 1.73 | 2.9 | 5.8 |
| Apparel | 1.89 | 8.38 | 0.46 | 2.08 | 5.2 | 1.6 |
| Fabricated metal product | 1.89 | 6.48 | 4.36 | 8.44 | 7.0 | 4.4 |
| Others | 8.27 | 23.75 | 36.05 | 44.95 | 36.1 | 45.0 |
| Total | 100 | 100 | 100 | 100 | 100 | 100 |
| Location coefficients | ||||||
| Manufacturing (2018) | 1.25 | 1.13 | - | |||
| Transportation equipment | 1.56 | 1.16 | - | |||
Source: Developed by the authors based on the 2020 Population and Housing Census, INEGI (2020; 2021); United Nations Development Program, National Population and Housing Council (PNUD, 2010-2015); Economic Censuses 2019, INEGI (2019); Conapo (2020).
The Aguascalientes micro-region is made up of five municipalities: Jesús María, San Francisco de los Romo, El Llano, Aguascalientes and Ojuelos de Jalisco. The five municipalities have a total population of 1.2 million inhabitants and a population density of 340 inhabitants per square kilometer, more than three times the national average. The microregion has similar sociodemographic and development characteristics to the nine microregions, although, slightly more favorable in all indicators.
In the nine microregions, the relative share of employment and manufacturing value added is high. In the Aguascalientes micro-region, the relative participation of added value and the employed population is even higher with percentages of 66.13 and 36.32, respectively. Within manufacturing, the manufacture of transportation equipment represents 48.50 percent of the sectoral value added in the nine microregions, more than double compared to the national figure. The share of this subsector in the micro-region where Minth is located is 75.57 percent. The relative specialization or location coefficient corroborates the significant presence of manufacturing activity in the nine microregions, while the levels of relative specialization in manufacturing and the transport equipment subsector are even higher for the Aguascalientes microregion.
Spatial Distribution Patterns and Agglomeration Forces. The analysis of the agglomeration forces in the AAI was carried out through two elements: Moran’s spatial correlation indices and heat maps with kernel density. The National Statistical Directory of Economic Units (Directorio Estadístico Nacional de Unidades Económicas, denue for its acronym in Spanish) allowed spatially locating the economic units that were members of the AAI in the period 2010-2020. The AAI is made up of three branches: 3361 car and truck manufacturing; 3362 bodies and trailers manufacturing; 3363 parts for motor vehicles manufacturing.
Moran’s I was used to measure the global spatial autocorrelation in the set of microregions for the variable number of economic units per municipality of the three branches that make up the AAI. Spatial autocorrelation is “the functional relationship between the values that an indicator takes in a space zone and in neighboring zones” (Chasco, 2003: 50). The indicator was estimated using Anselin (2020) and a queen-type spatial weight matrix of order 1 was used. Moran’s I measures the degree of linear association between the variable of interest and the average value of the neighbors’ variable, and its value is between negative one and positive one.
According to Anselin (2020), Moran’s I is one of the most common measures to detect global autocorrelation, that is, the spatial correlation over the entire dataset. It is the variable (expressed in deviations from the mean) multiplied by the weighted average value of the neighboring variable. Following Anselin’s notation (2020), and if z
i
= x
i
-
Where is each one of the elements of the weight matrix that reflects the neighborhood or spatial structure, here we use a queen-type neighborhood structure of first order; while, S 0 = Σ i Σ j w ij is the sum of all weights and n is the number of observations. Moran’s I measures the degree of linear association between the variable of interest and the average value of the neighboring variable and its value is between negative one and positive one.
Between 2010 and 2020, the number of AAI economic units increased by 65 percent in the set of micro-regions, going from four hundred eighty to seven hundred ninety-six. The global correlation coefficient, Moran’s I, identified positive and significant spatial autocorrelation with a confidence level of 95 percent, although its value is relatively small, it has been increasing since in 2010 it was 0.18, while in 2020 it reached a value of 0.25. However, those values indicate a non-random distribution of the economic units of the AAI in the microregions considered. In other words, its spatial distribution accounts for patterns of spatial concentration that could be associated with agglomeration forces.
The heat maps are graphical tools that allow the identification of groupings or clusters based on the estimation of the kernel density. The kernel density consists of the calculation of “the density of points in a neighborhood around each output raster cell, which represents the characteristics of the point distributions” (Lu and Cao, 2019: 6). In other words, the kernel density shows how dense the concentration of elements is in an area based on a point. The calculation of the kernel density for points, as it is in our case, is based on the classic work of Silverman (1986) in which the density is calculated as:
where i = 1, ..., are the points considered for the density calculation, which should only be included in the sum if they fall within the search radius of the neighborhood, which in our case was 45 thousand meters (radio) for the purpose of identifying concentrations on a national scale; meanwhile, pond i is an element that allows weighting the importance of the points, usually it can be a value such as population, when pond i = 1, each point is assigned the same relative importance, which was what here we meanwhile made dist i the distance between point i and the reference location. The search radius used was 10 km and the raster cells were defined at a pixel size of 80 to generate discrete interpolation maps and equal intervals of four classes (Figure 1).
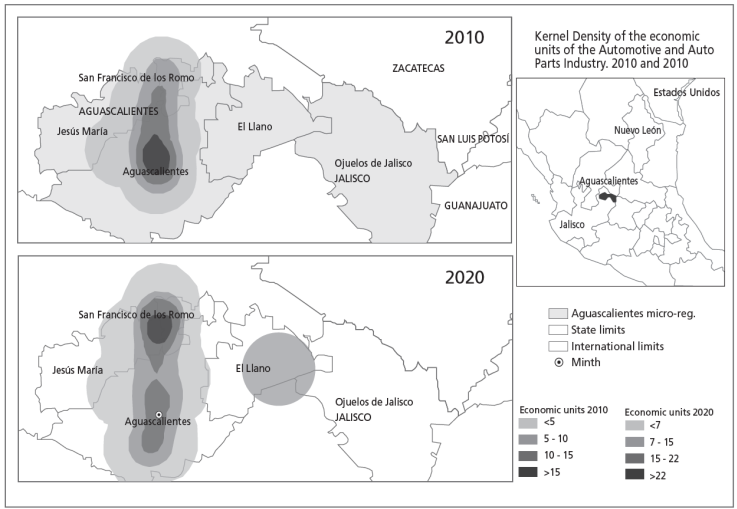
Source: Developed by the authors based on INEGI (2021), indicated years.
Figure 1 KERNEL DENSITY 2010 AND 2020 OF THE ECONOMIC UNITS OF THE AAI IN THE MICROREGION OF AGUASCALIENTES
The number of economic units belonging to the AAI in the Aguascalientes micro-region went from 48 to 91. In the two-time cuts, groupings of economic units were identified through this instrument. These clusters spread along Federal Highway 45, the so-called Pan-American Highway, which stretches from the border with the United States in Ciudad Juárez, Chihuahua, to the state of Hidalgo, in central Mexico. In addition, the density of economic units increased, going from a maximum threshold of 15 economic units in the search radius to one of 22 economic units.
In 2010, the highest density area in the microregion was identified south of the city of Aguascalientes, a group where the Minth company is located (Figure 1a). The southern grouping extends around the population center called Ciudad Industrial, with more than 15 AAI economic units in the search radius. The cluster extended to the north of the city, but with a gradually decreasing density. The main change identified in 2020 in relation to the previous time cut is that the highest area of density in the microregion moved north of the city of Aguascalientes, to the municipalities of San Francisco de los Romo and Jesús María, with a density of 22 economic units within the search radius, mainly around the San Francisco Industrial Park. However, the loss of importance of the southern part of the city is only relative, since in absolute terms the number of AAI economic units increased and spread further south, towards the city airport where the finsa industrial park is located, near which plant 2 of the Nissan assembly plant is located.
These results are an indication of the presence of agglomeration forces that affect the location decisions of companies operating in the AAI, both in the set of nine microregions (Moran’s I positive and significant), and at the level of the microregion of Aguascalientes, where two important groups are identified, one to the south (where Minth is located) and another to the north.
Microeconomic Factors: The Case of the Minth Company
In November 2019, field work was carried out at the Minth plant located in Aguascalientes, Mexico. A year later, in November 2020, a virtual semi-structured interview was conducted with the plant’s director of sales and infrastructure. The interview was part of the UNAM-PAPIIT IA302620 Program “Las empresas chinas en la industria de autopartes y automóviles en México: condiciones actuales y perspectivas ante el Tratado México-Estados Unidos-Canadá (T-MEC)”. The authors thank Ing. Manuel Yoshiro Ando Camacho for the interviews granted. They also state that they are solely responsible for the information contained in the document.
The information collected was triangulated with the review of various financial reports of the parent company, conferences, specialized press, and other documents that allowed the construction of the case study from a triangular approach (Yin, 2014).
Minth Group. Minth Group Limited was established in 1997 and has its predecessor in Xiaogang-based Ningbo Minfu Mechanics Plant. It is one of the 100 global auto parts companies that develops activities of design, manufacture and sale of moldings, decorative parts, and metallic aluminum structural parts that are supplied to the main assemblers in the world. 51 percent of its sales revenue comes from GM, Nissan, and Honda. It has more than 50 plants and a workforce of 17,812 workers (Minth Group Ltd., 2021). Its manufacturing centers are located in China, the United States, Mexico, Thailand, Germany, Serbia, the United Kingdom and the Czech Republic. Its sales, design and research & development (R&D) centers are located in China, Germany, the United States, Japan and Korea.
In 2020, the group’s income fell by 5.5 percent, causing gross profit to contract at a rate of 6.2 percent. The gross profit rate stood at 31 percent, experiencing a decrease of 0.2 percentage points compared to 2019. The slight drop in the profit rate was mainly attributed to the decrease in the utilization rate of installed capacity, due to the drop in sales revenues in 2020 derived from the impacts of the pandemic, and the pressures in the decrease of merchandise prices for older models and higher tariffs on Chinese products in the United States. These negative trends outweighed other trends with a favorable impact on the profit rate: the start-up of new production lines and the launch of various stimulus policies for economic recovery by the Chinese government. In short, the corporate profit rate has fallen particularly sharply since 2009, but the investment rate has multiplied by 2.6 times.
In a context of crisis, Minth Group increased its spending on physical investment, its investment rate was 51 percent in 2020. This was attributable to the expansion of R&D activities in battery-housing, an active implementation of intelligence development strategies, and the initiative to establish an intelligent industrial park for the car of the future, all of which are consistent with the global trend of the automobile industry (Minth Group Ltd., 2021). This makes it clear that, in its investment decisions, the group follows the demand perspectives of global automakers.
Between 2009-2020 Minth Group reduced by 25 percentage points the relative share of its revenues originating from its clients located in China and increased the share of sales from its clients located in North America and Europe by 11 and 14 percentage points (see Table 3). In other words, since 2009 Minth has increased its insertion in global automotive value chains around Europe and North America.
Table 3 MINTH GROUP: ECONOMIC INDICATORS (2004-2020)
| 2004 | 2008 | 2009 | 2010 | 2015 | 2016 | 2017 | 2018 | 2019 | 2020 |
|
|
|
|---|---|---|---|---|---|---|---|---|---|---|---|---|
| Ennploynnent (number) | 1 264 | 3 492 | 5 148 | 6 353 | 11 337 | 13 657 | 16 360 | 18 391 | 17 740 | 17 812 | 407 | 346 |
| Gross profit rate (%) a/ | 40.19 | 36.28 | 38.11 | 36.57 | 31.72 | 34.58 | 33.81 | 32.05 | 31.23 | 30.95 | 95 | 81 |
| Investment rate (%) b/ | 53.27 | 35.96 | 23.34 | 29.28 | 48.61 | 37.40 | 55.61 | 55.35 | 40.63 | 61.21 | 44 | 262 |
| Revenues by geographic markets (as a percentage of the total): | ||||||||||||
| China | 8.50 | 80.36 | 84.58 | 76.47 | 60.23 | 62.00 | 61.51 | 60.86 | 57.62 | 59.29 | 995 | 70 |
| North America | 5.54 | 6.87 | 6.95 | 12.30 | 24.70 | 22.97 | 20.24 | 18.93 | 20.89 | 18.12 | 125 | 261 |
| Europe | 4.63 | 4.23 | 2.75 | 3.39 | 8.73 | 8.82 | 12.68 | 15.06 | 16.91 | 17.23 | 60 | 625 |
| Pacific Asia | nd | 8.55 | 5.71 | 7.84 | 6.34 | 6.21 | 5.57 | 5.15 | 4.57 | 5.36 | nd | 94 |
a/ Gross profits to sales revenues ratio; b/ Investment (tangible and intangible) to gross earnings ratio.
Source: Developed by the authors based on financial reports of the Minth Group (2004-2020).
Minth Mexico. Minth México started operations in 2009 through the acquisition of a Japanese logistics plant, beginning with the assembly of auto parts for its only client at the time: Ford. In 2014, through a JV with the Japanese Tokai Kogyo, it opened an anodizing plant for premium vehicles, but the alliance failed and by 2016 the plant became controlled by the Japanese firm. In 2015 Minth invested approximately 50 million dollars for its new aluminum extrusion plant. Currently, the company specializes in four processes: sheet rolling, plastic extrusion, aluminum anodizing, and aluminum extrusion, with the following characteristics: low levels of competition in Mexico (in rolling, it has three competitors; in aluminum, it has one competitor, and in both cases, they are foreign subsidiaries); high technical requirements and high risk due to the cost of the process.
Currently, the plastics and stamping plant supplies conventional customers (Nissan, GM, Volkswagen, and Ford) and 70 percent of its sales are exported. The aluminum plant supplies premium customers (BMW, Mercedes-Benz, Volvo, Audi, GM) and 90 percent of its sales are exported. The company replicates the industrial organization of the auto parts segment in Mexico, its main feature being the high dependence on imports, for example, about 90 percent of the inputs are of U.S. origin and the rest is from Asian and Mexican suppliers. Similarly, 98 percent of the raw material is imported.
It is a large company, with productivity levels similar to those of the parent company, although the cost of production is still 30 percent lower in China. Between 2009-2018, it reported an average annual growth in sales of 68 percent. Minth México is a relevant case because it is the first Chinese company that came to the Mexican AAI and the one that has developed the most investment projects. Among the contextual factors that explain the growing presence of the foreign subsidiary, the following stand out:
Dynamics of the global automotive industry: Minth Group follows the international expansion phase of its main clients (Honda, Nissan and Ford), since the automotive industry works with global platforms and anchor projects, e.g., the Ford Fiesta model required the installation of supplier plants in Thailand and Mexico.
Strategies of the parent company: internationalization appears as a strategy before the risk of expropriation by the Chinese government and to “dodge” a possible imposition of tariffs by the United States on Chinese imports. It sought to take advantage of the benefits of NAFTA and low Chinese labor costs that would allow it to supply the supply chain in the North American region at more competitive prices.
Policies and institutions in China: the aid from the Chinese government to the automotive industry in China (credit, subsidies, promotion of support industries) is a factor that favors the internationalization of the Minth Group.
Location factors in Mexico: the presence and expansion of the company is guided by the prospects of demand, thus its arrival in 2009 is explained by the requirements of Ford, while the 2015 plant followed the expansion of the premium industry in Mexico. NAFTA and the industrial agglomeration in Aguascalientes are added to the above (see previous section).
It is interesting to point out that the internal monetary policy reflected in the behavior of the interest rate does not seem to be a factor for the expansion of Minth in Mexico, since the new investments are completely financed with resources from the parent company (which, in turn, obtains financing through public institutions in China and through its participation in the stock market), while the capital increases are financed by the subsidiary in Mexico through the reinvestment of profits. On the other hand, the behavior of the exchange rate affects the decisions of the subsidiary because the depreciation processes of the peso-dollar exchange rate stimulate the Chinese OFDI since it generates savings through labor costs. Due to its growing international expansion and strong fluctuations in the foreign exchange market, the Minth Group carefully follows exchange rate expectations when deciding on the billing currencies of its relevant businesses (Minth Group Ltd., 2021).
More than a decade after the arrival of Minth in Mexico, three major problems can be identified that reflect the learning and adaptation processes that the subsidiary has gone through:
The psychic distance at the level of cultural differences and the management of the workforce and the client have hindered Minth’s operations in Mexico. For example, although the Minth Group and Tokai Kogyo already had several JVs in China, their strategic visions did not coincide on the direction of operations in Mexico. While the former was betting on accelerated growth, the latter was seeking slower and more orderly growth; that led to the failure of the JV. On the other hand, the work culture and language have hindered the adaptation of the organization for Chinese manufacturing in Mexico, which, in turn, has led to an increase in the percentage of Chinese workers in the plant, from 1 percent to 10 percent, that is, to the maximum allowed by the National Institute of Migration of Mexico.
The high turnover under Chinese leadership prevents continuity. At the management level, there is an annual turnover rate of 20 percent, which is very high when compared to the average turnover of around 2 percent in the automotive industry.
Finally, the USMCA can cause two effects for Minth Mexico. On the one hand, it could mean higher sales in the United States, on the other, it could lead to a loss of regional competitiveness with Asia, particularly due to the steel chapter in the agreement. In effect, the new agreement forces companies to buy steel and aluminum from companies in the region and particularly from the United States, all of which will have an impact on costs. The auto parts companies will have two years to look for suppliers of steel and aluminum from the United States or Mexico. Focused on Mexico, the task is not minor, considering that the structural steel industry is practically a transnational oligopoly and because of the incipient aluminum industry. Minth is currently seeking to develop suppliers in Mexico, but given the price, quality and production scale requirements, only large companies (typically MNEs) have the potential to participate as suppliers.
Conclusions
The growing presence of Chinese companies participating in the AAI in Mexico will be sustained in the coming years. The evidence presented based on the Minth Group case study and regional analysis techniques suggest that Chinese OFDI in Mexico’s auto parts-automotive industry is guided by favorable demand prospects that stimulate private company profitability. Demand is fundamentally stimulated by global projects in the automotive industry, where supplier companies are linked through anchor projects. On the other hand, companies take advantage of localization, such as proximity to the United States, the benefits offered by NAFTA, now the USMCA, as well as the agglomeration economies that derive from the presence of multiple economic units in the same industry.
Minth arrived in Mexico through an anchor project for the manufacture of the Ford Fiesta model in 2010, which was expanded in 2015 following the consolidation of the premium automotive industry in Mexico. The company has sought to exploit certain localization advantages, for example, it was strategically located in Aguascalientes given its geographical proximity to the Nissan plant and took advantage of its proximity to the United States as well as the NAFTA rules of origin. The psychic distance at the level of language and work culture have been present as obstacles.
Unfortunately, the Chinese subsidiary reproduces the organization of the AAI in Mexico: its high dependence on imported inputs and a weak capacity to generate link-ages with local suppliers and technological spillovers. In such a context, it is the task of Mexican public institutions to influence the modification of the development pattern.
The United States and the European Union have advanced, at least since 2017, towards greater regulations on OFDI, particularly Chinese OFDI (ECLAC, 2021), which mean new barriers to investment. The “new normal” in regulation must be adopted by the LAC countries and must be manifested in laws aimed at prohibiting foreign investment in strategic assets such as mining. It must impose performance requirements and promote strategic alliances with local companies, so that knowledge and technology transfer processes can be generated. Public financing becomes a necessary condition of the new strategy, e.g., the performance requirement linked to the MNEs must buy more locally requires a public policy for the development of local suppliers through joint ventures and/or to guarantee credit at low rates to potential local suppliers. The USMCA requires that the automotive chain buy steel and aluminum from the region, without a large-scale supplier development policy, the fruits of the agreement will be transferred to the transnational oligopoly that controls the Mexican steel company.

