


 nova página do texto(beta)
 Inglês (pdf)
 Artigo em XML
 Referências do artigo
 Enviar este artigo por email
 Citado por SciELO
  Similares em
SciELO
Similares em
SciELO 
 Permalink
Introduction
According to James Rickards (2012; 2014), Western nations, mainly the United States, display severe financial problems as a consequence of the 2008 economic crisis. Besides the increasing public debt, a demographic bottleneck seems to have triggered a hegemonic reconfiguration of the world economy. It went from unipolar domination by the United States after the fall of the Soviet Union in the 1990s, to the emergence of several newcomers that today challenge U.S. leadership. These new actors are organized in economic blocks like the G-20, BRICS, and MIKTA. The new contenders in the world economy struggle to enhance their economic influence due to the fact that multilateralism failed with the freezing of the Doha round negotiations at the beginning of the twenty-first century.
Countries like the United States, Germany, France, Japan, and the UK, here known as the Big Five, famous in the past for their sympathy for free trade and democracy, have now resorted to protectionism and nationalism, whereas most members of the G-20, BRICS, and MIKTA are pushing for more trade. Mo Jongryn (2015), Andrew Cooper (2015), Choi Heeman (2015), and Richard Gowan (2015) point out that middle-power nations play an increasing role in determining economic policy in the international arena. These middle powers have the means to act as intermediaries in a new multipolar world economy, but mainly between the U.S. and China. From these middle powers came a group of nations first coined as MIST by Goldman Sachs in 2011, meaning Mexico, Indonesia, South Korea, and Turkey. In 2013, the UN General Assembly included Australia, and MIST became MIKTA (Maihold, 2014). At the beginning of 2019, a MIKTA summit took place in Jakarta, where Mexico took the lead to foster cooperation among the members in three areas: trade and tourism, social development, and multilateralism. All of these constitute the guidelines of MIKTA’s 2030 agenda. The main objective is to promote entrepreneurship, innovation, and the use of technology among small and medium-size enterprises. Education, environmental protection, and multilateralism are the pillars of cooperation in this group (El Economista, 2019).
The world’s structure of production changed from 1989 to 2015. The participation of the Big Five went from 60 percent in 1989 to 42 percent in 2015, whereas that of the BRICS increased from 9 percent to 22 percent, and of MIKTA, from 5 percent to 7 percent in the same period. The power of China and India can explain the outstanding evolution of BRICS in the first place; Brazil and Russia in the second; and South Africa just with a marginal contribution. The Big Five will be struck by a demographic setback in the near future (Macarrón, 2017). Their fertility rates lie below the replacement rate of 2.1 children per woman. In the 2010-2015 period, this indicator was 1.47, for Germany; 1.98, for France; 1.42 for Japan; 1.81, for the UK; and 1.86 for the United States. With the lack of children as well as a longer life expectancy and aging population, production will slow and public expenditure will increase, triggering a major economic downturn for the coming decades. A similar contraction in the population also jeopardizes BRICS members (except for India and South Africa). For the same period (2010-2015), Brazil reported 1.82 children per woman; Russia, 1.75; India, 2.48; China, 1.55; and South Africa, 2.4. MIKTA has the advantage that its population growth is still in good shape (except for South Korea and Australia). In the same period, Mexico reported 2.29 children per woman; Indonesia, 2.5; Turkey, 2.1; South Korea, 1.26; and Australia, 1.8 (Macarrón, 2017).
The purpose of this article is to shed some light onto business opportunities within MIKTA by comparing the main economic features of three of its members: Mexico, Indonesia, and Turkey. The hypothesis to be proved is whether or not these economies are equal, based on their respective GDP per capita, a variable used as a proxy for labor productivity and market size (Balassa, 1980). If they are, an asymmetry hindrance could be ruled out and therefore a gate for trade benefits could open, bestowing the MIKTA agenda 2030 with realistic working inputs to fulfill its objectives. We have divided the article into three sections. In the first, we analyze the members of MIKTA based on their GDP per capita from 1967 to 2018. Using this data, published by the World Bank, we conducted an ANOVA test to find out which countries are equal or unequal. The ANOVA test showed that only Mexico, Indonesia, and Turkey have equal means; whereas Australia and South Korea did not. Thus, we proceeded to compare their key macroeconomic and socioeconomic indicators. In the second part, we delve into further trade and competitive features, focusing on the essential advantages for each country in world record terms. In the third section, we rate all observations on a scale from one to three according to the importance of each indicator and classify them into five areas: balance of payments, competitiveness, macroeconomic stability, political stability, and demographics. We add up the results to identify which country obtained the highest scores in each area. Finally, in the third section we ran a second ANOVA test using the values of all 87 observations in a logarithmic scale to prove that the differences are not significant and that the three countries’ mean remains equal. We conclude that by such similarities, there are plenty of trade opportunities among these three countries that could be fostered within the MIKTA framework.
mikta Countries: Comparing Compatible Members
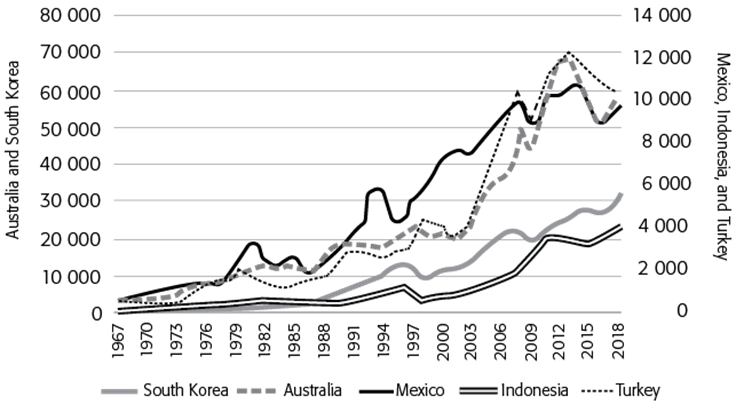
According to Béla Balassa, the size of an economy expressed in GDP also represents the size of the market. Thus, GDP per capita is a key indicator of productivity and competitiveness. The higher the GDP per capita, the bigger the market and the higher the probability of productive sectors obtaining increasing rates of return (Balassa, 1980).
Graph 1 displays per capita income of MIKTA members. It is evident that South Korea and Australia, surpass the rest of the MIKTA members significantly. Therefore, the graph has two vertical axes with two scales. South Korea (SK) and Australia (AUS) had levels in this indicator that rank from US$30 000 to US$50 000 per capita (left axis) by the end of 2018. Conversely, Mexico (Mex), Indonesia (Ind), and Turkey (Tur) remain within an interval between US$3 000 and US$10 000 per capita (right axis) in 2018.
To prove which MIKTA member countries can be compared based on their annual GDP per capita in current U.S. dollars published by the World Bank for 1967-2018, we conducted an ANOVA test. Our null hypothesis () states that all MIKTA members have an equal GDP per capita mean, whereas the alternative () hypothesis states the opposite.
| Df | Sum Sq | Mean Sq | F value | Pr(>F) | |
| ind | 4 | 1.684e+10 | 4.21e+09 | 42.09 | <2e-16 *** |
| Residuals | 255 | 2.550e+10 | 1.00e+08 |
Signif. codes: 0 ‘***’ 0.001 ‘**’ 0.01 ‘*’ 0.05 ‘.’ 0.1 ‘ ’ 1
The model run in R software (Allaire, 2015) displays a very small p-value and an F-value of 42.09, with which the null hypothesis can be rejected; this means the MIKTA member countries are different.
A Tukey HSD (honestly significant difference) analysis delves into details concerning the evaluating hypothesis showing its results in Table 1. We reject the with a p-value smaller than 0.05. Under this category fall country-pairs, whose GDP per capita mean is unequal (Table 1, last column right in italics). Conversely, we accept the by those country-pairs whose GDP per capita mean is equal and have a p-value > 0.05 (Table 1, last column in bold). Thus, only Turkey-Mexico, Indonesia-Mexico, and Indonesia-Turkey are equal and can be comparable. As mentioned before, Australia and South Korea have reached a higher level of development, and South Korea’s export-led model was especially successful. Their respective GDP per capita speak to a considerable advantage in terms of competitiveness and productivity compared to the rest of the group.
Table 1 TURKEY, MULTIPLE COMPARISONS OF MEANS 95 PERCENT FAMILY-WISE CONFIDENCE LEVEL
| Diff | Lower | Upper | p-value | ||
|---|---|---|---|---|---|
| 1 | Tur-Mex | -3771.5192 | -9160.13439 | 1617.096 | 0.3078169 |
| 2 | IND-Mex | -608.5769 | -5997.19208 | 4780.038 | 0.9979776 |
| 3 | SK-Mex | 5469.7308 | 81.11561 | 10 858.346 | 0.0447092 |
| 4 | AUS-Mex | 18967.9423 | 13 579.32715 | 24 356.557 | 0.0000000 |
| 5 | IND-Tur | 3162.9423 | -2225.67285 | 8551.557 | 0.4906733 |
| 6 | SK-Tur | 9241.2500 | 3852.63484 | 14 629.865 | 0.0000396 |
| 7 | AUS-Tur | 22 739.4615 | 17 350.84638 | 28 128.077 | 0.0000000 |
| 8 | SK-IND | 6078.3077 | 689.69253 | 11 466.923 | 0.0182243 |
| 9 | AUS-IND | 19 576.5192 | 14 187.90407 | 24 965.134 | 0.0000000 |
| 10 | AUS-SK | 13 498.2115 | 8109.59638 | 18 886.827 | 0.0000000 |
Source: Authors' calculation using R software and World Bank Data.
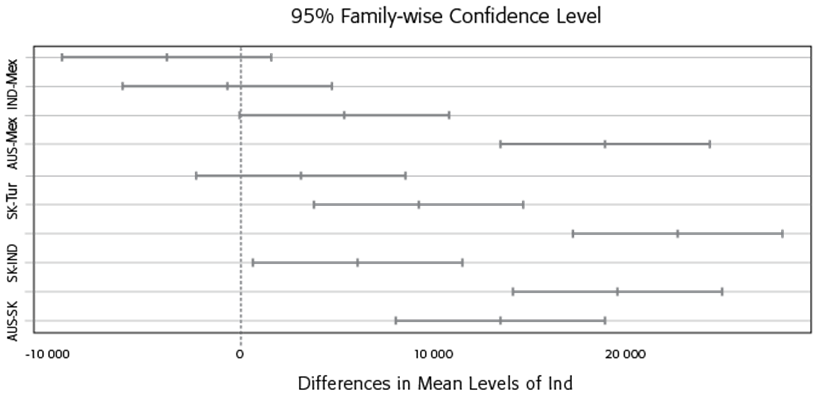
This analysis can also be seen in the form of a 95-percent confidence interval displayed in Graph 2. Ten lines depicting the country-pairs appear in Table 1. The lines crossing the zero are the first, the second, and the fifth and match with those mentioned in Table 1 with a p-value >0.05, meaning those country-pairs with an equal GDP per capita mean. The rest of the lines are pairs of countries whose GDP per capita mean is unequal and have a p-value <0.05.
Table 2 shows the average economic growth of these three countries from 1961 to 2015 based on World Bank Data. The mean for Mexico is 4.04; Indonesia, 5.2; and Turkey, 4.51. The most volatile economy is Turkey, with a standard deviation of 3.91, followed by Mexico with 3.60, and Indonesia, 3.44. Sticking to the same data, the average growth of the world economy in this period was 3.54, with a standard deviation of 1.625. Thus, the probability of finding a country like Mexico with an average growth of 4.04 or more is 38 percent, which means that almost 4 out of 10 countries in the world have an average economic growth equal or greater than Mexico; the probability of finding a country that grows at the annual average rate of Indonesia’s 5.26 percent is 14.5 percent. In the case of Turkey, the probability of finding a country whose average economic growth is equal to or greater than the Turkish 4.51 percent is 27 percent. From this point of view, we cannot state that Mexican or Turkish average economic growth is weak. But we can say than Indonesia’s average growth has been outstanding, since only 14.5 percent of the countries in the world perform the same or better.
Table 2 ECONOMIC GROWTH: STATISTICAL DESCRIPTIVE ANALYSIS (1961-2015)
| Indicators | Mexico | Indonesia | Turkey |
|---|---|---|---|
| Minimum | -5.80 | -13.10 | -5.70 |
| 1º Quartile | 2.55 | 4.65 | 2.55 |
| Mean | 4.20 | 5.90 | 5.00 |
| Mean | 4.04 | 5.2 | 4.51 |
| 3º Quartile | 5.90 | 7.00 | 7.30 |
| Maximum | 11.90 | 10.9 | 11.20 |
| Standard D. | 3.60 | 3.44 | 3.91 |
Source: Developed by the authors using World Data Bank data (2019).
Table 3 compares the three countries in terms of population, nominal GDP in U.S. dollars, and nominal GDP per capita in U.S. dollars. The total population of the group increased by 30 percent from 361 million in 2000 to 468 million in 2019, for an average annual growth rate of 1.37 percent. Mexico grew the most with 35 percent and an annual average growth of 1.6 percent, followed by Indonesia and Turkey with 28 percent and 25 percent or 1.32 percent and 1.2 percent, respectively. Indonesia is the most populated country, maintaining its participation of more than 50 percent in the group during the whole period. Mexico gained one percent, going from a population share of 26 percent to 27 percent. Turkey dropped slightly from 17.5 percent to 16.9 percent in the same time span.
Table 3 BASIC MACROECONOMIC INDICATORS
| 2000 | 2007 | 2015 | 2019 | ∆ | average (%) | |
|---|---|---|---|---|---|---|
| Population in Millions | ||||||
| Mexico | 94.3 | 104.9 | 116.1 | 127.5 | 1.35 | 1.60 |
| Indonesia | 203.4 | 222.6 | 244 | 261 | 1.28 | 1.32 |
| Turkey | 63.4 | 72.3 | 74.5 | 79.5 | 1.25 | 1.20 |
| Total | 361.1 | 399.8 | 434.6 | 468 | 1.30 | 1.37 |
| Nominal GDP in U.S. Dollars | ||||||
| Mexico | 348.6 | 677 | 1 178 | 1 077 | 3.09 | 6.12 |
| Indonesia | 221.5 | 258 | 878 | 932 | 4.21 | 7.86 |
| Turkey | 199.3 | 303 | 789 | 863 | 4.33 | 8.02 |
| Total | 769.4 | 1 238 | 2 845 | 2 872 | 3.73 | 7.18 |
| Nominal GDP per capita in U.S. Dollars | ||||||
| Mexico | 3 700 | 6 450 | 9 750 | 8 446 | 2.28 | 4.44 |
| Indonesia | 1 110 | 1 160 | 3 560 | 3 571 | 3.22 | 6.34 |
| Turkey | 3 130 | 4 190 | 10 670 | 10 860 | 3.47 | 6.77 |
| Total | 7 669 | 81 165 | 11 182 | 10 450 | 1.36 | 1.64 |
Source: The Economist (2000; 2007; 2015; 2017; 2019).
The average number of children per woman (fertility rate) has dropped in all three countries. From 1950-1955 to 2010-2015, it went from 6.75 to 2.29 in the case of Mexico, a drop of -66 percent; Indonesia decreased from 5.49 to 2.5 (-52 percent); and Turkey, from 6.62 to 2.1 (-68 percent). All three are still above the natural replacement rate of 2.1, but what could turn into a shortcoming is the velocity at which the population is shrinking (Macarrón, 2017).
In terms of nominal GDP, Mexico remained the largest economy but with the slowest average economic growth. Mexico’s GDP tripled from US$348 billion in 2000 to US$1077 billion in 2019, with an average growth of 6.12 percent. However, its participation in the group dropped from 45.3 percent in 2000 to 38.7 percent in 2019. Indonesia’s GDP quadrupled, with an annual average growth of 7.86 percent. Its share in the group soared from 28.7 percent in 2000 to 32 percent in 2019. Turkey’s economy quadrupled and scored the highest average annual growth rate of the group: 8 percent. Its share also increased from 26 percent to 30 percent. This performance matches with the income per capita’s trend. Turkey’s income per capita scored the highest rate of average annual growth with 6.77 percent, followed by Indonesia, with 6.34 percent, and Mexico, with 4.44 percent.
Graph 3 depicts the Big Mac Index in which a currency is over/undervalued with respect to the U.S. dollar from 2002 to 2018. The price of a Big Mac hamburger in the United States increased from US$2.46 to US$5.58, or at an average annual rate of 4.8 percent. The Turkish lira almost kept pace with the U.S. dollar from 2002 to 2006, entering the overvalued segment from 2007 to 2010. From that year on and as a consequence of continuous depreciation, the lira was the group’ most undervalued currency in 2018. The Indonesian rupiah has been its most undervalued currency until 2018 when it gained value compared to the Turkish lira. The Mexican peso was steadily undervalued for the whole period. The fact that these three currencies are undervalued means they give their exports extra support to become more competitive. Their trade balances should thus be moving toward trade surpluses with the United States.

Table 4 GDP (BILLIONS OF U.S. DOLLARS IN PPP)
| 2000 | 2007 | 2012 | 2016 | |
| Mexico | 765 | 1017.5 | 1985 | 2367 |
| Indonesia | 679 | 785.2 | 1373 | 3032 |
| Turkey | 412 | 556.1 | 1204 | 1994 |
| Total | 1856 | 2358.8 | 4562 | 7393 |
| Per capita GDP in U.S. dollars PPP (thousands) | ||||
| 2000 | 2007 | 2012 | 2016 | |
| Mexico | 7.57 | 9.16 | 16.54 | 18.63 |
| Indonesia | 3.21 | 3.38 | 5.53 | 11.61 |
| Turkey | 6.51 | 8.00 | 15.96 | 25.08 |
Source: Big Mac Index and The Economist (2000; 2007; 2015; 2019).
This analysis has important implications since, in real terms, these economies are undervalued. Calculating per capita GDP and income in purchasing power parity (PPP) allows us to see these economies’ real size. According to The Economist data, Mexico’s economy tripled from US$765 billion in 2000 to US$2.3 trillion in 2016, an annual average of 7.13 percent; whereas Indonesia’s increased from US$679 billion to US$3 trillion, 4.4 times with an annual average growth of 9.8 percent; and Turkey’s went from US$412 billion to almost US$2 trillion, 4.8 times the 10.36 percent annual average, respectively. Together they represent a region of US$7.3 trillion, slightly behind India’s GDP in PPP, which amounted to US$8.7 trillion in 2016 and ranked as the world’s third-largest economy. Now, if we translate these numbers into per capita income, Mexico ended up in 2016 with US$18 639, Turkey with US$25 000, and Indonesia with US$11 600 per capita annually.
Furthermore, and based on data published by Expansion, the minimum wage in Mexico dropped from 115.3€ in 2003 to 113.6€ in 2019; in the same period, Indonesia’s minimum wage went from 44.6€ to 104.8€, and Turkey’s, from 176.1€ to 422.3€. That turns Turkey into a regional superpower followed by Mexico, with Indonesia in third place. Turkey’s remarkable performance is a result of productivity growth, even though in this period, its population soared 25.7 percent, followed by Indonesia at 23.4 percent and Mexico at 25.3 percent. Only Mexico had a slight setback in the minimum wage, whereas Indonesia showed the highest salary growth (Datosmacro.com).
According to fundamental macroeconomic theory, a current account deficit (CA), which often entails a trade deficit as well in which exports (X) are less than imports (M), must be offset by a capital account surplus, either through foreign direct investment or foreign debt. This results from a negative difference between domestic savings (S) and total investment (I). Thus, CA= S<I, means that domestic savings are not enough to finance investment (Obstfeld, 1996: 16). If CA = X<M, then the trade deficit turns into the main feature of a debtor country. As we can see from Table 5, Mexico distinguishes itself by having the most stable components in its balance of payments. Mexico’s CA deficit remains within the ranking of from -1.1 percent to -2.1 percent as a share of GDP. Investment as a share of GDP is amazingly high in Indonesia, over 30 percent throughout the period, followed by Turkey with an average of 25 percent; Mexico follows with the weakest level in this indicator, barely higher than 20 percent. Since investment is the main driving force of economic growth, these numbers correlate with average economic growth, led by Indonesia in first place, Turkey in second, and Mexico in third. Mexico’s foreign debt as a percentage of its GDP increased from 32.4 percent in 2000 to 40 percent in 2019, which is still manageable, taking into account that both exports and levels of foreign currency reserves are abundant. Moody’s sovereign debt rating for Mexico was A3 negative in 2019; Fitch downgraded Mexico from BBB+ in October 2018 to BBB in June 2019; and S&P gave Mexico a BBB+ with a negative expectation at the beginning of 2019 (Datosmacro.com, 2019). Exports as a percentage of GDP went from 28.3 percent (US$110 billion) in 2000 to 38 percent (US$373.9 billion) in 2019. This strong performance in trade correlates with its increasing levels of foreign currency reserves. They went from US$28.9 billion to US$178 billion in the same period. In 2019, unemployment in Mexico was 3.9 percent; the interest rate, 8.3 percent; and inflation, 3.9 percent. All this places Mexico as the largest foreign exchange recipient among the three countries and the Mexican peso as the most stable currency.
Table 5 BALANCE OF PAYMENTS INDICATORS
| 2000 | 2007 | 2015 | 2019 | |
|---|---|---|---|---|
| Current Account Balance/GDP | ||||
| Mexico | -2.1 | -1.1 | -1.3 | -2.1 |
| Indonesia | -2.2 | 1.2 | -2.7 | -1.8 |
| Turkey | -1.3 | -5.1 | -6.1 | -3.8 |
| Investment/GDP | ||||
| Mexico | 21.1 | 21.8 | 23 | 23 |
| Indonesia | 31.6 | 22.8 | 36 | 34 |
| Turkey | 25.1 | 26 | 20 | 28 |
| Exports/GDP | ||||
| Mexico | 28.3 | 30.1 | 33 | 38 |
| Indonesia | 27.9 | 30.9 | 24 | 19 |
| Turkey | 24.3 | 29 | 26 | 22 |
| Foreign debt/GDP | ||||
| Mexico | 32.4 | 22 | 30 | 39.3 |
| Indonesia | 65.3 | 63 | 29.1 | 33.9 |
| Turkey | 47.1 | 67 | 43.1 | 47 |
| Level of reserves in U.S. dollars | ||||
| Mexico | 28.9 | 64.2 | 167 | 178 |
| Indonesia | 17.5 | 36 | 112.8 | 116.4 |
| Turkey | 19.7 | 37.3 | 119.1 | 105.9 |
Source: The Economist (2000; 2007; 2015; 2017).
Indonesia showed more volatility in its CA, going from -2.2 percent in 2000 to a 1.2-percent surplus in 2007 and a -2.7-percent deficit in 2015. This matches the fact that the Indonesian rupiah has been the most undervalued currency as mentioned above. Its exports as a percentage of GDP and in billions of U.S. dollars went from 27.9 percent (US$53.5 billion) in 2000 to 19 percent (US$145 billion). Indonesia has made remarkable progress in bringing down its foreign debt by almost 50 percent, going from 65.3 percent of its GDP in 2000 to 33.9 percent in 2019. This positive trend kept pace with growing levels of foreign currency reserves. Official reserves went from US$17.5 billion in 2000 to US$116.4 billion in 2019, a more than six-fold jump. In 2019, Moody’s gave Indonesia a Baa2, a medium-low grade; S&P rated it at BBB; and Fitch, BBB. In 2019, unemployment in Indonesia was 4.3 percent; the interest rate, 6.8 percent; and inflation, 5.3 percent. As a consequence, this country became an important destination for foreign direct investment (FDI).
Turkey shows the most unstable CA balance with a deficit of -5.1 percent in 2007 and -6.1 percent in 2015. The Turkish lira was overvalued from 2000 to 2009. Its exports as a percentage of its GDP decreased slightly from 24.3 percent in 2000 to 22 percent in 2019, but soared in absolute terms, jumping from US$26.2 billion to US$142.5 billion in the same period. Its foreign debt remained at 47 percent of its GDP for 19 years, but its levels of reserves quadrupled from US$19.7 billion in 2000 to US$105.9 billion in 2019. Moody’s gave Turkey a B1 negative in 2019; S&P, B+ stable; and Fitch, BB- in 2018. Turkey’s geopolitical location puts additional pressure on its public finances due to its conspicuous military expenditure and proximity to Syria. In 2019, unemployment in Turkey was 10.8 percent; its interest rate, 7.3 percent; and inflation, 8.6 percent. The country with the soundest public finances is thus Mexico, followed by Indonesia, with Turkey in the third place. What the three countries have in common is that they have strengthened their manufacturing export sector, becoming important trade competitors worldwide. They have become much more resilient by building a considerable amount of foreign exchange reserves, which means that capital influx has been expedite and business confidence is flourising.
Socio-economic Indicators. Other indicators worth mentioning due to their potential business interest for small and medium-size enterprises are population size, height, intelligence, human development, temperature, happiness, inequality, and freedom. WorldData.info publishes statistics on the average size of men and women. It states that the taller its residents, the wealthier the country. The average height for men in Mexico in 2018 was 1.68 m; weight, 79 kg; and body mass index (BMI), 27.5; for females, the same figures were 1.56 m; 69.4 kg; and 28.5. Indonesia’s numbers for men were 1.63 m; 59.5 kg; and 22.4; Indonesian women measured 1.52 m; 54.8 kg; and 23.7. For Turkey, the numbers for men were 1.74 m; 82.4 kg; and 27.2. Turkey’s females measured 1.60 m; 73.7 kg; and 28.8. The BMI data suggests that the Mexican and Turkish populations are overweight. The same source uploaded to the web a study of intelligence quotient based on averages between 1990 and 2010: Mexico scored an IQ of 86 points; Turkey, 89; and Indonesia, 84. Another source that took data from 2002 to 2006 updated the IQ test with the following ranking: Mexico, 88; Turkey, 90; and Indonesia, 87 (Brainstats.The Benchmark of IQ Test). Here, too, Turkey continues to dominate, followed by Mexico, but Indonesia seems to be catching up. Thus, Turkish people are taller, more intelligent, and wealthier under these parameters, followed by Mexicans in second place, and Indonesians in third. Intelligence seems to match with development. For instance, in 2019, the Human Development Index (HDI) for Turkey was 76.7; Mexico, 76.2; and Indonesia, 68.9 (The Economist, 2019). The HDI integrates educational level, income per capita, and life expectancy. With respect to literacy, Turkey heads the group with 95.6 percent of adults, followed by Indonesia’s 95.4 percent, and Mexico’s 94.9 percent (The Economist, 2019). The yearly average temperatures are 29.2°C in Mexico, 19.9°C in Turkey, and 31.8°C in Indonesia (WorldData.info). On the other hand, the happiness index ranks Mexico within the top 20 countries of a total of 156, where Denmark ranked first as the happiest country in the world in 2019. Following the happiness index for the years 2013, 2015, and 2016, Mexico ranked in position 16, 14, and 21, respectively; Turkey, 77, 76, and 78; and Indo nesia, 76, 74, and 79. In almost 20 years, life expectancy in females increased in Mexico from 75.5 in 2000 to 80.6 years in 2019; in Indonesia it rose from 70.6 to 72.6 years; and in Turkey, from 72.1 to 80.4. In spite of the improvements in life expectancy, all three seem to have become unhappier, although Mexico remains strongly happier than its peer countries (Datosmacro.com, 2019). A Gini coefficient measurement of a total of 157 countries (where the most equal is the Faroe Islands with 22.7 and the most unequal is Lesotho, with 63.2) ranks Mexico in 24th place, the most unequal of the group with a Gini of 48.2; Turkey took 63rd place with 40.2; and Indonesia, 83rd with 36.8. (CIA, 2019). Freedom, for which Sweden ranks 100/100, scores Mexico with 62/100 (partly free/press freedom, status, not free); Indonesia 64/100 (partly free/press freedom, status: partly free), and Turkey 32/100 (not free/press freedom, status: not free) (Abramowitz, 2019). In 2018 there were 203 364 prisoners in Mexico (0.15 percent of the population); 265 079 in Indonesia (0.10 percent of the population), and 260 000 in Turkey (0.32 percent of the population). Transparency International measures corruption and places Mexico in position 138 out of 180; Indonesia, 89/180; and Turkey, 78/180 (Transparency International, 2019). Despite its remarkable place as an uncorrupt and wealthy country, Turkey scores as the most oppressive, unhappy, and unfree country.
Foreign Trade and Competitiveness
Export, Production, and Trade Partners
Mexican exports almost quadrupled from US$110 billion in 2000 to US$373.9 billion in 2019. Mexico ranked in 2017 as the 19th largest exporter in the world. The Mexican export sector’s structure has been stable. Manufactured goods as a share of total exports increased from 86 percent (2000); 83 percent (2007); 81 percent (2015); to 90 percent (2019) (The Economist, 2019). Crude oil and derivatives have been losing traction, falling from 10 percent in 2000 to 5 percent in 2019, whereas agricultural products have kept their share at around 3 percent to 4 percent. But in 2017 the following key branches of production broke through: according to The Economist World Figures (2020), Mexico held twelfth place in the world with the largest manufacturing output of the three countries (US$198 billion); twelfth in agricultural output (US$39 billion); ninth in coffee production (270 000 tons); ninth in sugar production (6 million tons); third in orange juice production (195 000 tons); tenth in copper production (742 000 tons); fifth in lead production (241 000 tons); eighth in gold production (130 tons); first in silver production (5 394 tons); ninth in cotton production (335 000 tons); and was the ninth largest car producer, with an output of more than 2 million units. BBC news reported huge lithium findings in 2009 in Zacatecas, with a capacity for producing 2.5 million tons (Najar, 2009). Other sources point out that Sonora has one of the largest lithium reserves in the world (Bacanora Lihium). In 2019, a US$420-million Sonora Lithium project announced a planned production of 17 500 tons annually. Lithium is a key commodity in the production of batteries and has a bright future in industry (Tribuna, 2019). In terms of services and transfers, tourism left revenues of US$22.5 billion in 2017, taking fifteenth place in the world with almost 40 million visitors. Remittances amounted to US$30.61 billion in 2017, which placed Mexico as the world’s fourth largest. Its number of trade partners has increased from three to four, suggesting that export destinations have diversified slightly. Thus, in 2000, 84 percent of all exports went to the U.S., 2.1 percent to Canada, and 0.9 percent to Japan. But in 2019, the export destination structure was 80.9 percent to the U.S.; 2.8 percent to Canada; 1.4 percent to China; and 1.1 percent to Germany. This means that China and Germany displaced Japan. The backbone of Mexican manufacturing exports is the automobile industry and the assembly lines known as maquiladoras, both run by foreign capital. In 2017, Mexico received US$29.6 billion in FDI. Manufacturing, tourism, remittances, and fdi strongly contributed to a foreign exchange surplus reflected in US$176.3-billion official reserves in 2017.
Indonesia’s exports tripled from US$53.5 billion in 2000 to US$145 billion in 2019. In 2017 this country ranked as the thirty-fifth largest exporter in the world. The export structure has been changing. Between 2000 and 2007, crude oil and derivatives made up more than 11 percent of all exports, followed by textiles and clothing with 10 percent to 11 percent, and natural gas, 9 percent to 10 percent. Plywood and rubber, products exported in 2000, disappeared in 2007. In 2015, 33 percent of all exports were mineral fuels and the rest, equally distributed at 12 percent each, machinery and transport, manufactured goods, and animals and vegetable oil (palm oil). In 2019, manufactured goods once again made up 74 percent of all exports, followed by mining and other products with 21 percent and animal and vegetable oils, 4 percent. In 2017, Indonesia ranked twelfth worldwide with the largest manufacturing output (US$205 billion); fourth in agricultural output (US$134 billion); the third rice producer (37 million tons); the seventh tea producer (139 000 tons); the second nickel producer (358 000 tons); the third rubber producer (3.4 million tons); the first vegetable oil producer (palm oil) (41 million tons); the sixteenth car producer with more than half a million units; and the third coal producer (323.3 million tons). Indonesia is a naval power with 1948 vessels and was first in 2018 in ship flags registrations. Indonesia’s main trade partner is Japan, where 23.3 percent (2000), 24.3 percent (2007), 15.9 percent (2015), and 11.5 percent (2019) of Indonesia’s exports were sent. Countries that lost their share in 2019 as Indonesia’s export destinations compared to 2000 were the United States and Singapore dropping from 13.3 percent (2000) to 11.2 percent (2019) and from 10.2 percent (2000) to 8.2 percent (2019) respectively; and South Korea and the Netherland were eliminated. Conversely, China gained participation by going from 4.1 percent in 2000 to 11.6 percent in 2019. In 2017, Indonesia ranked sixteenth as the largest FDI recipient (US$23 billion), sixteenth for remittances (US$9.0 billion), and twenty-first for official reserves (US$120 billion).
In 2017, Turkey took thirty-third place on the world list of exporters. Turkey’s exports quintupled, going from US$26.2 billion in 2000 to US$142.5 billion in 2019. The export structure has also been biased toward manufacturing. Textiles and clothing were the key export products in 2000 but have been losing traction ever since, falling from 35 percent in that year to 11 percent in 2019. Iron, steel, and metal also fell from 15 percent in 2000 to 9 percent in 2019. Transport and equipment, an industrial branch related to the automobile industry, have been gaining share, rising from 9 percent in 2015 to 16 percent in 2019. Agricultural products take the largest share with 17 percent (2015) and 18 percent (2019). Almost one-third of Turkey’s exports consist of agricultural products and textiles. As a major player in the world economy in 2017, Turkey made a dent in the following branches: seventeenth place in manufacturing output (US$149 billion); the tenth largest agricultural output (US$52 billion); the ninth largest wheat producer (21 million tons); sixth tea producer (234 000 tons); ninth zinc producer (67 400 tons); fifteenth car producer with almost a million units; eighth cotton producer (792,000 tons); and twelfth arms exporter (US$364 million). Turkey is the thirteenth most visited country, generating US$31.9 billion in tourism and receiving 37 million tourists in 2017. It is also a major figure in merchant fleets, with 1522 vessels, taking twelfth place, higher than the UK in this sector. Turkey’s main export destinations have also changed. In 2000, 20 percent of exports went to Germany; 7.9 percent to Russia; 7.6 percent to the U.S.; 5.7 percent to the UK; 5.3 percent to Italy; and 4.4 percent to France. In 2019, 9.8 percent went to Germany; 5.4 percent to Iraq; 5.3 percent to Italy; 8.2 percent to the UK; and 47.9 percent to the EU28. It seems that Turkey diversified its trade partners, preferring to target the EU28 and skipping the U.S. and Russia as important export destinations. Turkey received US$10.8 billion as fdi in 2017 and just US$1 billion in remittances. However, it generated a surplus of foreign exchange, allowing it to take the twenty-sixth place with the largest official reserves, US$92.41 billion in 2018.
Imports, Consumption, and Trade Partners
From 2000 to 2019, Mexico’s imports more than tripled, from US$112 billion to US$387 billion. Its imports structure has been stable: 75 percent intermediate goods, 15 percent capital goods, and 10 percent consumer goods over 19 years. Major changes have taken place among import suppliers. In 2000, 75 percent of Mexico’s imports came from the U.S., 4 percent from Japan, and 3.6 percent from Germany. In 2019, 49 percent came from the U.S., and 17 percent from China. Japan and Germany kept their share, but China and other Asian countries like South Korea seem to have been displacing the United States as the main Mexican import supplier.
Indonesia’s main imports consisted of manufacturing in 2000, like machinery and transport, chemicals, fuel, food, drink, and tobacco, as well as raw materials. Throughout the period, Indonesia has developed a powerful manufacturing industry. This has changed its import structure radically. In 2019, 70 percent of its imports were raw materials; 17 percent, capital goods; and 13 percent, consumer goods. Important changes have also occurred in the supplier structure. In 2000, 20 percent of its imports came from Japan; 13 percent from the U.S.; 8.2 percent from Singapore; 6.3 percent from Germany; 5.8 percent from Australia; and 5.6 percent from South Korea. Nineteen years later, 9.6 percent of Indonesia’s imports came from Japan, 22 percent from China, 10.7 percent from Singapore, and 6.4 percent from Thailand. China has displaced the United States, Germany, South Korea, and Australia as Indonesia’s main import supplier. Japan lost almost half of its participation, and Singapore continued.
Turkey has been importing manufactured goods throughout the period. In 2000, 20 percent, machinery; 13 percent, minerals; 11 percent, vehicles; 10 percent, chemicals; and 9 percent, metal. In 2019, 15 percent of its imports were chemicals; 11 percent, mechanical equipment; and 10 percent, transport and equipment. Turkey has also become an important player in vehicle production, taking fifteenth place with more than 300 000 vehicles in 2017. That is why most of its imports are inputs for its export sector. Regarding its import partners, changes have also taken place. In 2000, 17 percent of its imports came from Germany; 9.3 percent, from Italy; 8.6 percent, from the U.S.; 6.2 percent, from Russia; 5.7 percent, from the UK; and 2.2 percent, from France. In 2019, 10.8 percent of imports came from Germany; 7.6 percent, from Russia; 12.8 percent, from China; 5.5 percent, from the U.S.; and 39 percent, from the European Union. China and Russia have been displacing Germany and the United States as Turkey’s import partners, although most of its imports still come from the European Union. China seems to have turned into a major supplier for the three countries, displacing mainly the United States, Germany, and Japan.
Analysis and Results
We classified 87 macroeconomic and socio-economic observations for each country in five groups: 1) balance of payments, including exports and reserves; 2) competitiveness: literacy, IQ, temperatures, and FDI (2017); 3) macroeconomics: GDP in PPP, average economic growth, GDP per capita, investment as a share of GDP, unemployment, inflation, interest rate, debt as a share of GDP, and wages; 4) politics: the Human Development Index, the Happiness Index, the number of prisoners, Gini coefficient, freedom, and corruption; and 5) demographics: total population, life expectancy, height, weight, Body Mass Index (BMI), and fertility rate. We used a scale from one to three to evaluate each country´s performance, with three as the best indicator; two, the middle; and one, the worst. Adding up all points derived from the categories and evaluation, Mexico obtained a total of 205 points, Indonesia 164, and Turkey 153.
Table 6 shows the results in absolute and relative terms for each group according to the given rate. Seventy-eight percent of Mexico’s strength consists of 39 percent for macroeconomic stability, 22 percent for healthy demographics, and 17 percent for strong indicators on its balance of payments. Eighty percent of Indonesia’s strength consists of 45 percent for macroeconomic stability, 21 percent for healthy demographics, and 14 percent for political stability. Seventy-seven percent of Turkey’s strength consists of 41 percent, macroeconomic stability; 23 percent, healthy demographics; and 14 percent, political stability. Interestingly, Turkey scored the highest competitive rate (12 percent).
Table 6 ACCUMULATED POINTS ACCORDED (ABSOLUTE AND RELATIVE)
| Indicator | Mexico | Indonesia | Turkey | |||||||||
|---|---|---|---|---|---|---|---|---|---|---|---|---|
| 1 | 2 | 3 | total | 1 | 2 | 3 | total | 1 | 2 | 3 | total | |
| B. of payments | 0 | 2 | 33 | 35 | 4 | 14 | 3 | 21 | 8 | 8 | 0 | 16 |
| Competitiveness | 1 | 10 | 6 | 17 | 4 | 6 | 3 | 13 | 3 | 0 | 15 | 18 |
| Macroeconomics | 9 | 20 | 51 | 80 | 9 | 34 | 30 | 73 | 18 | 18 | 27 | 63 |
| Politics | 2 | 8 | 18 | 28 | 4 | 10 | 9 | 23 | 6 | 6 | 9 | 21 |
| Demographics | 1 | 20 | 24 | 45 | 11 | 2 | 21 | 34 | 7 | 16 | 12 | 35 |
| Total | 13 | 60 | 132 | 205 | 32 | 66 | 66 | 164 | 42 | 48 | 63 | 153 |
| Concepts | 1 | 2 | 3 | total | 1 | 2 | 3 | total | 1 | 2 | 3 | total |
| B. of payments | 0.00 | 0.03 | 0.25 | 0.17 | 0.13 | 0.21 | 0.05 | 0.13 | 0.19 | 0.17 | 0.00 | 0.10 |
| Competitiveness | 0.08 | 0.17 | 0.05 | 0.08 | 0.13 | 0.09 | 0.05 | 0.08 | 0.07 | 0.00 | 0.24 | 0.12 |
| Macroeconomics | 0.69 | 0.33 | 0.39 | 0.39 | 0.28 | 0.52 | 0.45 | 0.45 | 0.43 | 0.38 | 0.43 | 0.41 |
| Politics | 0.15 | 0.13 | 0.14 | 0.14 | 0.13 | 0.15 | 0.14 | 0.14 | 0.14 | 0.13 | 0.14 | 0.14 |
| Demographics | 0.08 | 0.33 | 0.18 | 0.22 | 0.34 | 0.03 | 0.32 | 0.21 | 0.17 | 0.33 | 0.19 | 0.23 |
Source: Authors’ calculations.
That does not mean Mexico is better than the rest. To prove this, we took all categories in a logarithmic scale and re-ran a second anova test using R. The null hypothesis (H 0 ) states that the mean of all categories is equal in the three countries. The alternative hypothesis (H 0 ) states the opposite.
By running the model, the results were:
| Df | Sum Sq | Mean Sq | F value | Pr(>F) | |
| ind | 2 | 1.3 | 0.648 | 0.151 | 0.86 |
| Residuals | 255 | 1091.9 | 4.282 |
Signif. codes: 0 ‘***’ 0.001 ‘**’ 0.01 ‘*’ 0.05 ‘.’ 0.1 ‘ ’ 1
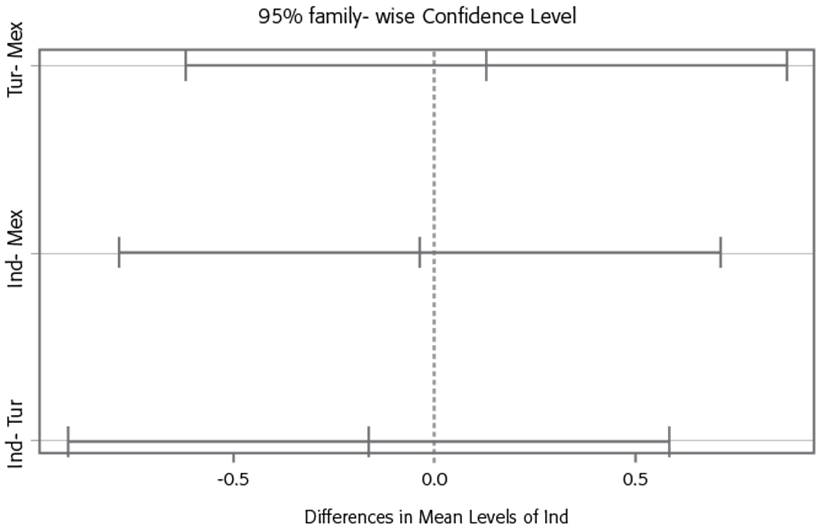
With a p-value of 0.86 and F value of 0.151, we accept the affirming that the three countries are the same. Table 7 displays p-values > 0.05, and Graph 4 shows a 95-percent confidence interval, where all bars cross the zero value, thereby proving that there is no difference between their categories’ means.
Table 7 TURKEY MULTIPLE COMPARISONS OF MEANS 95 PERCENT FAMILY-WISE CONFIDENCE LEVEL
| Diff | Lower | Upper | p adj | ||
|---|---|---|---|---|---|
| 1 | Tur-Mex | 0.12597249 | -0.6179523 | 0.8698973 | 0.9159422 |
| 2 | Ind-Mex | -0.04051067 | -0.7844355 | 0.7034141 | 0.9909555 |
| 3 | Ind-Tur | -0.16648316 | -0.9104080 | 0.5774416 | 0.8578934 |
Source: Authors’ calculations based on the values of 87 observations in a logarithmic scale.
Conclusions
Major changes in the world economy are being driven by population growth and productivity. The Big Five are losing their share in world production, being displaced by BRICS and MITKA. The Big Five and BRICS are facing demographic bottlenecks that will restrain their economic performance in the near future. Only India seems to be managing the problem with a sound fertility rate and vigorous economic growth. Based on that scenario, the three MIKTA members analized in this study evolve as powerful players in the world economy. On the one hand, this is because of their solid macroeconomic and demographic features and, on the other, due to their significant natural resources and productivity in manufacturing, agriculture, tourism, and other key commodities like palm oil, gold, silver, lithium, and wheat, among others. Therefore, foreign direct investment will increase in these countries as the trade confrontation between the U.S. and China deepens and as demographic and technological changes become apparent.
We conducted two ANOVA statistical tests. In the first, significant differences among MITKA members resulted based on their income per capita, placing Australia and South Korea in one group and Mexico, Indonesia, and Turkey in a second. A common feature in the second group was that in all three countries, China displaced the United States, Germany, and Japan as import suppliers. We delved into more detail, including 87 observations, which we classified into five categories: balance of payments, competitiveness, macroeconomics, politics, and demographics. We compared the three countries in every category finding slightly insignificant differences by which Mexico ranked in first position, Indonesia in second, and Turkey in third. All values were converted into logarithms to conduct a second ANOVA test, by which the was accepted, therefore concluding that there was no difference in the mean of all 87 observations of these economies.
The fact that these three countries have much in common opens the opportunity to foster trade at a time when distance is shortened by means of information and communication technologies. At this writing, when Mexico is coordinating the MITKA agenda 2030, this article shows that there are huge trade opportunities among its peer members to spur trade and tourism, social development, and multilateralism. Trade agreements between countries with deep economic asymetries usually trigger protests from sectors that feel menaced by foreign competitors. In a time when the United States and Western Europe are resorting to protectionism, BRICS and MIKTA should work together to offset the losses of hitherto traditional export markets and explore trade opportunites among themselves.

