


Services on Demand
Journal
Article
 English (pdf)
 Article in xml format
 Article references
 Send this article by e-mail
Indicators
-
 Cited by SciELO
 -
 Access statistics
Related links
-
 Similars in
SciELO
Similars in
SciELO
Share

 Permalink
Norteamérica
On-line version ISSN 2448-7228Print version ISSN 1870-3550
Norteamérica vol.9 n.2 Ciudad de México Jul./Dec. 2014
Ensayos
Immigration Trends After 20 Years of NAFTA
Mónica Verea*
* Researcher and founding former director (1989-1997) of CISAN-UNAM, mverea@unam.mx.
Received: 08/27/2014
Accepted: 10/14/2014
Abstract
The twentieth anniversary of NAFTA is an opportunity to reflect on what has happened to migration flows. In this essay, the author gives an overview of the trends of Mexican legal high- and low-skilled migration flows as well as of unauthorized flows to the United States, which have increased significantly during the last 20 years, contrary to original expectations. She takes Mexican migration to Canada as a reference for comparison since the flows are less dynamic. Finally, she also analyzes the significant increase of foreigners entering Mexico and the new phenomenon of "return migration."
Key words: NAFTA, legal migration, migration flows, return migration.
Resumen
El vigésimo aniversario del TLCAN es una oportunidad para reflexionar acerca de lo que ha ocurrido con respecto a los flujos migratorios. En este artículo la autora ofrece un panorama sobre las tendencias migratorias a Estados Unidos de mexicanos con alta y baja calificación, así como acerca de los flujos de migración no autorizada que se han incrementado significativamente en los últimos veinte años, en sentido contrario a la expectativa original. La autora toma en cuenta la migración de mexicanos a Canadá como referencia comparativa ya que estos flujos son menos dinámicos. Finalmente, analiza el significativo aumento de extranjeros que entran a México, así como el nuevo fenómeno denominado "migración de retorno".
Palabras clave: TLCAN, migración legal, flujos migratorios, migración de retorno.
Introduction
The North American Free Trade Agreement (NAFTA) has no provisions for migration among the three countries, despite the strong pressure Mexico's negotiators brought to bear during the Salinas administration (1988-1994) to include articles about the free movement of persons across borders. One of the benefits of NAFTA was supposed to be that the dynamic exchange of goods would foster greater economic development in Mexico, creating an important number of jobs with significant increases in wages and, as a result, reducing the pressures to emigrate north.1 As an incentive to trade, NAFTA allowed investment and transfers between companies, as well as temporary moves of professionals and their families. It established a specific non-immigrant TN visa (Trade NAFTA) exclusively for several categories of professionals.
During the 20 years since NAFTA came into effect, it has indeed brought broad regional economic interaction among many sectors, greater dynamism in foreign investment, and myriad trade transactions that have led to diverse businesses opening in Mexico. However, the predicted growth of the Mexican economy due to the implementation of NAFTA, which was supposed to be enough to create a lot of jobs in Mexico and eventually diminish the flow of Mexican migrants to the United States, did not materialize. Not only that, but the flow actually increased, mainly during the first 15 years, since the push-pull factors of Mexican migration to the United States have persisted, mainly in periods of economic growth during the NAFTA era.
In this essay, I will present an overview of the trends of Mexican legal migration flows (high- and low-skilled), as well as of unauthorized flows to the United States over the last 20 years. For that purpose, I begin by describing a very broad perspective of the main economic trends during this period. Secondly, I analyze the legal entries or visas issued to Mexicans as immigrants or temporary workers in the U.S., as well as the trends in the naturalization process by our citizens. In the third place, I explore the trends of unauthorized flows, which increased significantly during the NAFTA era. It is important to mention that Mexican migration to Canada is always taken as a reference point for comparison, looking at different types of visas or entries of migrant flows to the U.S., since they are less dynamic than those between México and the United States. In the last section, I give a broad overview of the flow of foreigners entering Mexico for different purposes and categories and the new phenomenon of "return migration."
A Brief Analysis of Economic Development in the NAFTA Region
NAFTA created a US$19 trillion regional market by uniting the economies of the United States, Canada, and Mexico with around 470 million consumers. The U.S. Chamber of Commerce calculates that some six million U.S. jobs depend on trade with Mexico and eight million on trade with Canada. Nevertheless, the differences in economic development between Mexico and its neighbors and partners are still abysmal. The United States is the world's largest economy, Canada the eleventh, and Mexico the fifteenth, calculated by gross domestic product (DGP), according to 2013 World Bank figures (2014b). Despite these enormous differences in development levels, Mexico could be considered a successful example of economic integration, mainly due to the expansion of its international trade and increased foreign direct investment (FDI) in its businesses from both partner countries.
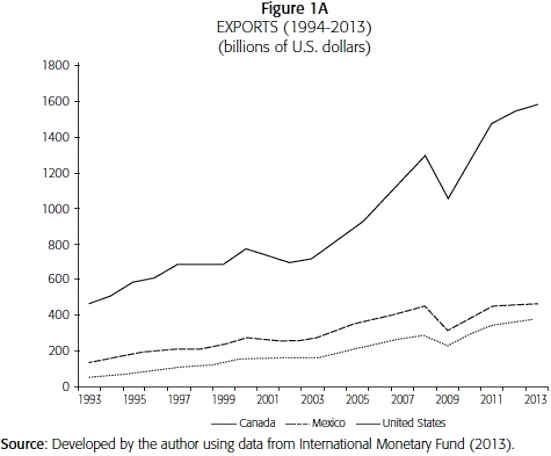
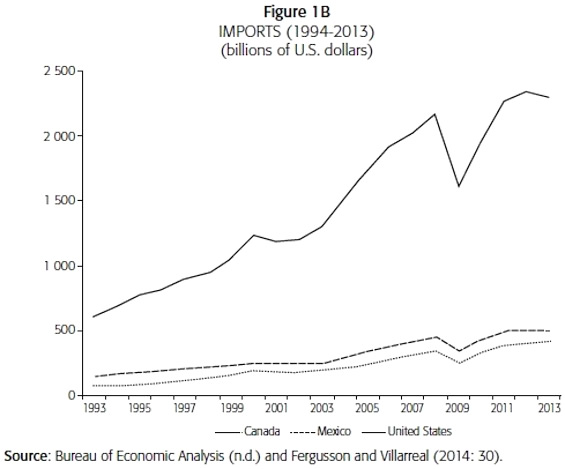
It is fair to recognize that during the last 20 years, Mexico's trade and FDI grew outstandingly. Today, Canada ranks as the United States' largest single export market and Mexico is the second. Intraregional trade flows have increased by roughly 400 percent, from around US$290 billion in 1993 to over US$1.1 trillion in 2012 (Hills, 2014). Each day, the United States conducts over US$3.2 billion in trade with its North American neighbors: nearly US$2 billion in goods and services cross the U.S.Canadian border, and Mexico exports roughly about US$1 billion worth of goods per day to the United States (Lanthemann, 2014). Mexico increased its imports more than ten-fold from around US$71 billion in 1993 to close to US$420 billion in 2013 (see Figure 1A). Its exports grew at the same pace, from around US$50 billion in 1993 to nearly US$400 billion in 2013 (see Figure 1B), that is, from US$144 million to US$1 billion a day, making it the fourth largest trading partner for the U.S. Even though over the years Mexico has relied heavily on the United States as an export market, this reliance has diminished during the NAFTA era. The percentage of Mexico's total exports going to the United States decreased from 83 percent in 1993 to 78 percent in 2012. Between 1993 and 2012, the U.S. share of Mexico's imports decreased from 78 percent to 55 percent. China is Mexico's second leading source of imports (Fergusson and Villarreal, 2014).
Although bilateral trade between Canada with Mexico has grown more than six-fold since NAFTA took effect in 1994, reaching US$28 billion in 2012, it is still very poor compared to Canada-U.S. bilateral trade, which for the same year was just over US$600 billion (The Economist, 2014). Canadian FDI in Mexico has doubled since the implementation of NAFTA. Today it is the fourth largest source of FDI in Mexico's economy, with more than 2 500 Canadian companies doing business in the country. Nevertheless, it represents less than 1 percent of total Canadian investment in the world, suggesting that there may be many more opportunities to explore for mutually profitable investment.
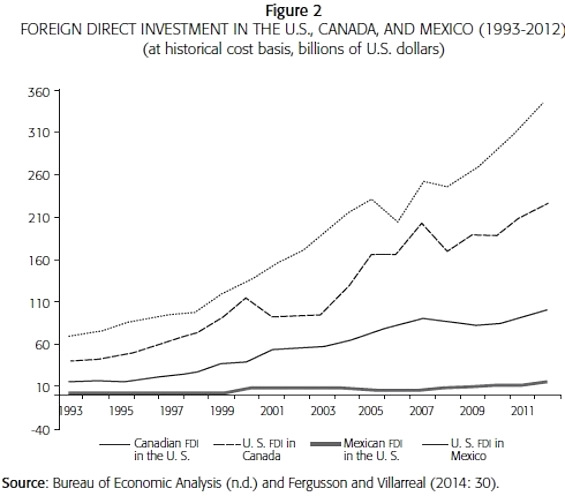
In terms of FDI, the United States is the largest source in Mexico, increasing its stock by 564 percent, from US$15.2 billion in 1993 to US$101 billion, in 2012. The FDI flows have been affected by several factors over the years, with higher growth during the late-1990s period of economic expansion, and slower growth in recent years, possibly due to the economic downturn caused by the 2008 global financial crisis and/or other internal factors. Mexican FDI in the United States, while substantially lower than U.S. investment in Mexico, has also increased rapidly, from US$1.2 billion in 1993 to US$14.9 billion in 2012, an hike of over 1 000 percent (see Figure 2).
We can say that during the last 20 years intraregional travel by businesspeople, tourists, and students has boomed. According to the U.S. Department of Commerce, in 2011, U.S. Americans made nearly 12 million trips to Canada and spent almost US$8 billion there, and they made 20 million trips to Mexico (the top destination for U.S. tourists) and spent over US$9 billion. Canadians made 21 million trips to the United States spending US$24 billion and Mexicans made more than 13 million trips spending almost US$8 billion (Hills, 2014: 33). Mexico is the second most important destination country for Canadian visitors, with about 1.6 million trips to Mexico recorded in 2011, some as tourists, students, and others who have bought properties and stay longer. Nevertheless, it is important to mention that in the number of Mexican tourists to Canada has dropped significantly since the 2009 imposition of a visa requirement for Mexicans to stem a surge in false refugee claims.2 Since then, the number of false claimants has indeed dropped significantly (fewer than 1 000 applicants in 2012, down from almost 10 000 in 2008) along with business and tourist visits, which dropped 50 percent.3 The requirement remains in place, leaving Mexico, the United States' NAFTA partner, in the company of countries such as Algeria and Iraq (The Economist, 2014).
With respect to the high expectations of closing the existing gap between Mexico and its NAFTA partners, according to World Bank data, in 1993, Canada's per capita GDP was US$19 549 and that of the United States, US$26 465. Twenty years later, in 2012, Canada's had grown 2.5 times to US$51 206.00, and that of the U.S. doubled, reaching US$51 749.00.4 Mexico did not grow as expected for different reasons: an average of only 1.2 percent economic growth per year was registered. Nevertheless, its per capita income almost doubled from US$5 566 in 1993 (28 percent of Canada's GDP and 21 percent of that of the United States) to US$9 749 in 2012 in current dollar terms (19 percent of the GDP of each of the other two), according to data from the World Bank (2014a). Several specialists think that while Mexico has not grown sufficiently, without NAFTA the situation would probably have been worse. We cannot underestimate the effects of the severe economic crises of 2001 and 2008/2009 that hit the Mexican economy and, of course, the deep Mexican economic crisis of 1994/1995. We have to recognize that even though the results in trade and investment have been very important for the Mexican economy, there is still a lot to work on to reduce the important gap between it and its partners, as well as to deal with the increasing vulnerability due to economic cycles.
The Mexican Population in the U.S. and Legal Admissions During The NAFTA Era
The Hispanic and Mexican population in the United States has doubled during the NAFTA era. According to the U.S. Census Bureau, in 2012, 53 million Hispanics living there represented 17 percent of the total population of 311 million. Of these, 65 percent, or 34.4 million, were of Mexican origin. This made people of Hispanic origin the nation's largest ethnic or racial minority. Just as a reference, in 1994, the total U.S. population was 260 million, 26.6 million of whom were Hispanic (17 million, or 64 percent of Mexican origin).
Mexicans are the largest group of migrants in the United States. In general terms, in 2013, nearly 11.8 million foreign-born residents in the United States were from Mexico (with or without a visa), 65 percent without authorization. This represents 4 percent of the U.S population and 29 percent of the country's 41 million immigrants (López et al., 2013).
Almost 3 million (3 086 000) Mexicans were admitted as immigrants to the United States and given the much sought-after green card from 1994 to 2013, an average of 155 000 a year.5 The majority (66 percent) of the 990 553 legal permanent residents (LPRS) admitted in 2013 were granted permanent-resident status based on a family relationship with a U.S. citizen or lawful permanent resident. The leading countries of birth of new LPRS were Mexico (14 percent), China (7.2 percent), and India (6.9 percent). Sixteen percent of immigrants admitted in 2013 became lawful permanent residents under the "employment" category (Monger and Yankay, 2014). In 2012, India made first place, receiving 22 percent of employment-based visas; Mexico was in sixth, place receiving 5.5 percent (almost double the 1994 amount). Mexicans are more likely than other immigrant groups to become legal permanent residents (LPRS) due to being immediate family members of U.S. citizens.
As a point of reference, Canada admitted 258 619 immigrants in 2013, compared to 224 385 in 1994, a constant amount that reflects their immigration policy over the last 20 years. Mexico occupied thirteenth place in the number of immigrant visas granted in Canada in 2013, while China, the Philippines, and India occupied the first three places. In 2003, 1 738 immigrants were admitted from Mexico, but in 2012 the amount doubled, rising to 4 032 Mexicans out of all the 257 887 immigrants given entry (Citizenship and Immigration Canada, 2011, 2012a, and 2012b). The amount is ridiculously low, compared to the Mexicans admitted yearly to the U.S., but the difference is that most of the Mexicans admitted to Canada went for employment rather than family reunification, which is the case for Mexicans admitted in the U.S.
In terms of naturalizations, 1.3 million Mexican LPRS became citizens during the last 20 years, representing only 9.5 percent of the almost the 13.7 million foreigners naturalized from 1994 to 2013.6 In 2013, about 779 929 LPRS became citizens and 99 385 (13 percent) were Mexicans. It is important to point out that Mexico's Non-Loss of Nationality Law, approved in 1998 under the Zedillo administration, allowed its citizens to have dual citizenship. It was created as an incentive for legal residents to have more interest in belonging to their new country and obtaining the rights they deserve as U.S. citizens. Even though today nine million U.S. citizens of Mexican origin have two passports (Serra Puche, 2014), nearly two-thirds of LPRS of Mexican origin still have not taken the step toward naturalization. This may be because it is costly or they do not intend to stay all their lives in U.S. territory and plan to return to Mexico when they retire.
As another point of reference, Canada, with the sixth largest foreign-born population of the OECD countries -the United States occupies the first place and Mexico the tenth of Canada's foreign-born population-, had a foreign-born population of about 6.8 million people in 2013 (CBC Canada, 2013).7 People born in the Caribbean and Central and South America represented 12.3 percent of all newcomers between 2006 and 2011, up from 10.5 percent from five years earlier.
Of the 11.8 Mexican immigrants living in the U.S., 7.7 million were part of the work force, of whom 91 percent had jobs and the rest were looking. Between 2009 and 2012, Mexican immigrants registered high unemployment rates. The majority of them work in the services sector: between 2000 and 2013, their participation increased from 51 percent to 65 percent, while their share of the secondary and primary sectors fell from 36 percent to 30 percent and from 12 percent to 5 percent, respectively. The industries with the highest percentage of Mexican migrants employed in 2013 were leisure and hospitality (18 percent), professional and business services (13.5 percent), and manufacturing (13 percent). Of these four sectors, employment in construction and manufacturing was hit by the 2008 economic crisis. Current population survey data shows that 40 percent of Mexican migrants with jobs were earning less than US$20 000 a year, and 17 percent earned more than US$40 000 a year (Fundación BBVA Bancomer et al., 2014).
The Growth of Mexican Non-Immigrant Admissions in the U.S.
During the 1990s, an important number of foreign highly- and low-skilled temporary workers were hired in the U.S. labor market because of that decade's sustained economic growth. The Department of State (DS) issued a significant number of visas for temporary workers, both high- and low-skilled. Even though statistics for DS-issued visas for 2004, when NAFTA came into effect, were available, I could not find precise data for migrants from Mexico for that year. So, I will only compare data from 2007 to 2013, the last year that statistics were published. It is important to stress that while the ds statistics reflect the number of visas issued or granted annually,8 Department of Homeland Security (DHS) data shows the multiple entries a visa holder may make in one year. Therefore, in general terms, if we compare number of visas issued with the total number of legal entries per fiscal year, we can find an important increase of entries per visa issued in this period, growing from 1.6 entries to 6.8 entries per visa granted (Jiménez, 2013). This means that foreign workers with visas go back and forth within a year more frequently than they did before. In order to understand which types of non-immigrant are hired in the U.S. labor market, I have divided the analysis into high- and low-skilled types of labor.
Highly-skilled Mexican non-immigrants
Today, the largest share of U.S. work visas for all nationalities goes to highly skilled workers, contrary to the widespread belief that most visas go to unskilled laborers. This has been the case during the NAFTA era. In 2010, 74 percent of the all visas were H1-B visas, L-type for intra company transferees, and NAFTA visas (TN) (Jiménez, 2013).
The number of highly skilled Mexican temporary workers granted H1-B visas during this period did not grow significantly, rising from 2 785 in 1997 to 3 683 in 2013, which represents only 2.4 percent of the total 153 223 visas granted in this category in that year. However, it occupied the third place after India, which received 65 percent, and China (see Table 1). The difference is that, during this period, they travel more often to Mexico; due to this, the number of admissions has grown significantly: while in 1997, there were 5 273 Mexican admissions, in 2012, there were 29 794.

The same has happened with L1 visas (intercompany transferees): in 1997, 2 346 visas were granted to Mexicans (6 percent of a total 36 589), and the number grew to 4 079 visas in 2013 (6 percent of a total 66 700). During this period, Canada moved from the sixth to first place with 25 percent. In addition, today they go back and forth more often to Mexico.
Based on the bilateral Free Trade Agreement signed by the United States and Canada in 1989, NAFTA established four types of persons to whom a non-immigrant Trade NAFTA or TN visa would be granted: business visitors, merchants, investors, and people transferred between companies. Around 60 classifications of professionals receive this status: 25 general professionals; 23 types of scientists; 12 professionals in the medical and biology sciences, and 3 in academic areas. TN status provides for a temporary stay of one year that can be renewed indefinitely. Holders of TN visas are not allowed to obtain permanent residence; this is why most professionals tend to apply for a H1-B visa, which can last six years and then the migrant can request permanent residence. It is important to mention that while Mexicans need to apply for a TN visa, Canadians do not, since they can get it upon entry to U.S. territory; this is a great inequality among partners not registered in their published statistics. Twenty years after NAFTA came into effect, the number of TN visas granted to Mexicans in the United States has been ridiculously low. Table 1 shows that the number of Mexican professional TN visa holders grew from 171 in 1997, to 9 548 in 2013. However, although they have grown over recent years, they are insignificant compare with the tremendous size of trade between the two countries.
Contrary to the belief that most Mexicans living abroad are low skilled with only very basic education, new studies have found that the number of Mexican professionals already living in the U.S., with or without authorization, has grown significantly. According to the Census Bureau's Current Population Survey data, the number of Mexican immigrants with some level of professional education or equivalent experience more than doubled between 2000 and 2010, going from a little over 400 000 to more than 1 million; and the number with graduate studies increased at an even higher rate, from 62 000 to almost 151 000 (Alba, 2013). A recent study released by Tuiran and Avila (2013) reveals that 862 000 highly skilled Mexican migrants were living in the United States in 2012. Eighty-five percent of them have a vocational level (professional and undergraduate studies) and 15 percent (153 000) had graduate degrees. Nevertheless, Mexicans have lower levels of education than the Hispanic population overall (10 percent of Mexicans ages 25 and older, compared to 13 percent of all U.S. Hispanics, have obtained at least a bachelor's degree). Sadly, Mexicans born in the U.S. are almost three times more likely to have earned a bachelor's degree than those born in Mexico (15 percent vs. 6 percent respectively). About 60 percent of Mexican immigrants have not earned a high school diploma compared with 21 percent of Mexicans born in the U.S. (Gonzalez Barrera and Lopez, 2013).
Low-Skilled Mexican Non-Immigrants
Unskilled Mexicans workers have gained an important place obtaining legal visas, mainly as agricultural workers, with H2-A visas, and non-agricultural workers, with H2-B visas. In this sense, Mexicans were granted 14 percent of all visas issued in both categories in 1990; this number almost doubled, with 26 percent of the total, in 2010 (Gonzalez Barrera and Lopez, 2013: 16).
Specifically, Mexican agricultural workers have been granted significantly more visas to work in the U.S. and maintain the same proportion against other nationalities. Table 1 shows that, while in 1997, 16 011 visas were issued to Mexican workers (96 percent of the total issued), in 2013 the amount grew more than 300 percent to 69 787 visas (94 percent of the total issued). In terms of number of admissions, while in 1994 Mexican migrants with H2-A visas registered 17 218 entries out of 22 141, in 2012 they registered 170 395 admissions out of a total of 183 860 to the U.S. (U.S. Department of Homeland Security, 2013b).
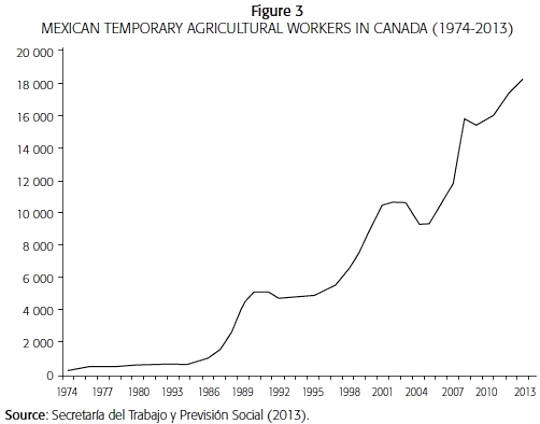
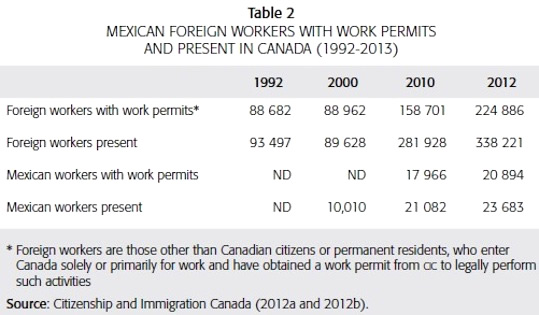
If we compare this data with the Temporal Agricultural Workers Program (TAWP) in Canada, Figure 3 shows how this flow has grown: from 2013 workers in 1974 when it was created to 17 626 Mexican workers hired in 2012,9 an amount equal to almost 25 percent of the Mexican agricultural workers (H2-A) hired in the U.S. Nevertheless, Canadian government statistics published in 2012 show that out of 224 886 temporary workers with work permits admitted, only 20 894 were Mexican;10 and out of 338 221 foreign workers present in that year, almost 23 683 were Mexicans, almost double the 10 010 Mexican workers present in 2000 (see Table 2). This represents a difference of 3 200 visas from those published by the Mexican government, and it is not specified whether they were high- or low-skilled workers. Nevertheless, it is important to mention that official Canadian statistics demonstrate that the number of foreign workers present in Canada has grown steadily: from 93 497 temporary workers present in 1994 to 338 213 in 2012 (Citizenship and Immigration Canada, 2012a and 2012b).
Only 7 678 Mexicans were granted H2-B visas to work in the United States as non-agricultural foreign workers in 1997, as shown in Table 1, and by 2004, this number had shot up to 52 556, dropping during the financial crisis in 2009 to 30 000; they then began to grow again, reaching 41 883 visas issued in 2013. While H2-B visas issued for Mexicans represented 49 percent of the total in 1997, during the last two decades their participation steadily grew to 73 percent of the total for 2013.
Just to compare with the role Mexicans have played in Canada's non-agricultural low-skilled labor market, under the Labor Mobility Mechanism of the Canada-Mexico Partnership, Canadian employers are allowed to hire Mexican workers in any sector and in any province for up to four years. According to information from the Mexican embassy in Canada, unfortunately only 160 low-skilled non-agricultural workers were hired under this mechanism in 2013. This situation represents the typical trend to get bilateral agreements instead of trying to "trilateralize" them. The lack of leadership within the three countries to go beyond NAFTA has been evident.
Mexican Undocumented Population in the U.S. During The NAFTA Era
The on-going tradition of U.S. employers hiring Mexicans, whether with a temporary visa or under the table, has been a constant during recent years; this constitutes invaluable human capital that is exported but not recognized. In this complex regional process, agents intervene to get visas for possible jobs, while traffickers charge large sums of money for transporting irregular migrants through increasingly dangerous points along the border, in some cases, making previous arrangements with U.S. employers.
Contradictory to the spirit of closer relations among the three countries through the establishment of a "formal" North American region with NAFTA, the same year it came into effect (1994), the U.S. government began militarizing the border with different operations that continued through the 1990s: Hold the Line in El Paso; Gatekeeper, in San Diego; followed by Rio Grande in south Texas; and Safeguard, in Tucson, some years later. Their main objective was to force migrants to cross the border through more dangerous rural and desert terrain, thus discouraging them, by erecting walls and other barriers at the most trafficked border points with the support of an important increase of border patrols.
The reinforcement policy got even tougher and much more brutal after the 2001 terrorist attacks and the 2007 financial crisis. So, during the most recent years, the increasing number of apprehensions, deportations, and migrant deaths has brought an important irritant into bilateral relations, an irritant that has grown or diminished according to prospects of the long-promised comprehensive immigration reform debated in 1996, 1997, and again in 2013, but still not approved. It is important to mention that in 2001, for the first time, President Fox proposed to President George W. Bush a bilateral agreement on migration accepting mutual responses, the famous "whole enchilada," just before the terrorist attacks, which for obvious reasons went no further.11
In order to appreciate the dimension of border enforcement during the NAFTA era, in 1992, only 5 000 border patrol officers were watching Mexico's 1969-mile northern border at different points. Twenty years later, 21 500 agents were hired by the DHS, which is already double its 2004 size. The budget of Customs and Border Protection (CBP) doubled between 2005 and 2012, growing from about US$1.5 billion to roughly US$3.8 billion. As is clear, border reinforcement has been brutal, significantly ratcheting up the cost of migrating and the growing the dangers associated with illegal border crossings, resulting in increased deaths and human rights violations. Experience demonstrates that the tougher the measures, the more likely immigrants will tend to remain in the U.S. Clearly, such spending hikes for reinforcing the border have been reflected in the number of apprehensions: they rose throughout the 1990s and peaked at 1.7 million in 2000. After dropping to somewhat lower levels between 2001 and 2007, they fell dramatically from 2007 to 2011 during the financial crisis. In 2012, the number of unauthorized Mexicans apprehended along the Mexican border was 365 000, a 78-percent decrease vis-à-vis 2000, a boom year; at the same time, apprehensions of non-Mexicans have been increasing.12 The increase/ decrease in immigrant flows has traditionally been tied to push-pull factors that also correspond to economic cycles.
Despite this tremendous spending in their "reinforcement only policy," the undocumented population in the U.S. has tripled during the NAFTA era: while in 1994 the number of undocumented aliens living in the U.S. was about 3.8 million (Migration News, 1994), the number peaked at 12.2 million in 2007 and fell to 11.3 million in 2009 during the economic recession. According to figures from Mexico's National Occupation and Employment Survey (ENOE), the annual volumes of Mexican emigrants to the U.S. fell from 793 000 to 321 000 people between 2007 and 2012; this has had a negative impact on the capital inflows of family remittances to the country
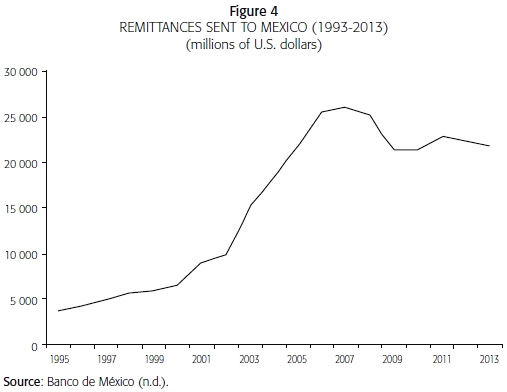
It is important to mention the significant economic resources that enter Mexico as remittances from migrants, both authorized and unauthorized, sent to their Mexican families affecting positively in their region (municipalities and states). These remittances, mainly from the U.S., have increased over the last 20 years: from US$3 673 million in 1995, peaking at US$25.1 billion in 2007, and then decreasing in 2012 to US$22.4 billion, according to the Bank of Mexico (see Figure 4). The severe recession in the United States has reduced remittance flows.
They have started to grow again due to the economic recovery: in 2013, the undocumented population was estimated at 11.7 million (52 percent of Mexican origin). In fact, a recent study reveals that during recent months, the unemployment rate of Mexican migrants in the U.S. has begun to decline, standing at very close to the national average. This is because incipient job growth has begun in the sectors that employ around 60 percent of Mexican immigrants (with or without authorization): agriculture, leisure and hospitality, construction, manufacturing, and wholesale and retail trade (Passel, Cohn, and Gonzalez Barrera, 2013).
Even though 6.1 million unauthorized Mexicans are still living in the U.S., three-fifths of them have lived there for more than a decade (Walter, 2012). For the first time in recent history, according to a Pew Hispanic study, Mexican-U.S. migration has registered an important shift in migration flows. Net migration (Mexicans who come to the U.S., the in-flow, minus those returning to Mexico, the out-flow) has reached an equilibrium (Passel, Cohn, and Gonzalez Barrera, 2012). Net migration from Mexico to the United States, both legal and illegal, now stands at zero or less. In other words, the number of migrants coming to the U.S. from Mexico is equal to, or less than, the number of migrants leaving or being deported from the United States and returning to Mexico (Walter, 2012). This phenomenon, known as the "zero net migration point," seems to be the result of several factors: the U.S. recession and slow economic growth since 2007 have weakened the U.S. job market, especially in housing construction; the rise in the U.S. unemployment rate created fewer jobs for both immigrant and native-born workers; increased border security, enforcement measures, and record-setting numbers of deportations of both unauthorized and legal immigrants (and their U.S.-citizen children); and the rising dangers associated with illegal border crossings. The establishment of more restrictive measures for U.S. employers like the E-Verify program has also made it harder to hire unauthorized immigrants.13 Also, by expanding the participation of state and local law enforcement agencies through Secure Communities and 287(g) agreements, local authorities have gotten involved with unauthorized migrants living in different states, sometimes helped by "vigilante groups"; this has led to an impressive increase in apprehensions and deportations of unprecedented numbers of aliens in recent years. Finally -but no minor problem- the very harsh anti-immigrant environment in some states during the last decade has had the effect of undocumented aliens emigrating either to other states with less anti-immigrant attitudes or going back to their countries of origin, or remaining and being much more vulnerable, because it is highly costly and risky to re-enter the U.S., and even more so if they have family members left some place.14 Within Mexico, several reasons have influenced this slowdown in the migration flow: the long-term decline in the birth rate; an increase in the average age of the Mexican population; and a broad improvement in Mexican economic conditions that has led to growing job opportunities that are lessening the pressure on Mexicans to leave their country in search of better opportunities. In spite of this new situation, I agree with Francisco Alba that even though nominal wage differentials have been hovering for years at about a 10-to-1 ratio for manual and semi-skilled jobs in favor of the United States, it is still very attractive to migrate. Whether this change is cyclical or structural remains to be seen, and will be put to a test once the U.S. economy is in full recovery and returns to dynamic growth (Alba, 2013).
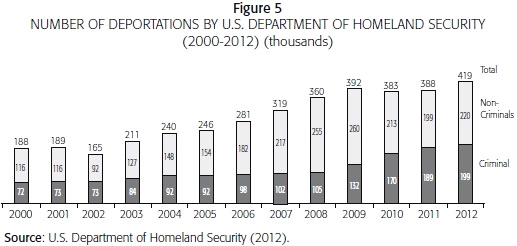
So far, during the five years of the Obama administration, from 2009 to 2013, the DHS has deported almost 2 million immigrants (Gonzalez Barrera, 2014). By comparison, 2.2 million migrants were deported during the eight years of the George W. Bush administration (see Figure 5). The Obama administration apparently has had the aim of deporting mainly "criminal illegals," but the truth has been that U.S. authorities have conducted brutal enforcement raids to localize undocumented aliens in their homes, on the streets, and in work places, without really trying to penalize employers who "illegally" hire undocumented aliens. Graph 3 shows that more than half of the deported aliens are not criminals.
A new phenomenon has emerged that is very difficult to resolve: unaccompanied children who arrive in the U.S. from Central America, mainly Honduras, Guatemala, and El Salvador. The number had increased significantly to 57 000 children -40 percent are girls- by July 2014, compared with 39 000 in 2013,15 overwhelming the capacity to accommodate them.16 A recent report by the United Nations Human Rights Council (UNHRC) on unaccompanied children leaving Central America and Mexico found that not all of them were seeking family reunification or looking for better economic opportunities. Instead, 58 percent said they were fleeing violence related to organized criminal groups or domestic violence in their families (Nazario, 2014). The report stated that the number of asylum requests by children had increased by 432 percent (UNHRC, 2014). This has aggravated the perception of some U.S. citizens that the government is out of control. President Obama has requested US$3.7 billion from Congress to deal with the crisis calling it an "urgent humanitarian situation." The president stated that the money will be used to set up new detention facilities, deploy more aerial surveillance, and hire immigration judges and border patrol personnel to respond to the flood of children (Ricardi, 2014). Restrictionists or anti-immigrant advocates will take advantage of pushing migration policy toward a more restrictive reinforcement policy instead of a policy of integration and legalization, something that will feed Republican elections campaign, even though they do not want to be seen as too extreme on the issue. Meanwhile, Democrats are hesitating about how best to handle the issue in order not to radicalize their positions. I agree with the United Nations recommendations; that is, this is a human problem and has to be treated as a refugee crisis. They support the creation of emergency refugee centers inside our borders, tent cities, operated by the United Nations and other relief groups like the International Rescue Committee, where immigrant children could be held for 60 to 90 days instead of being released (Nazario, 2014).
Aware that the large number of undocumented aliens, both adults and children, are a big problem that must be solved, the U.S. Congress has debated and approved several bills (in 2006 and 2007) to reform its clearly broken immigration system, bills that were frozen for six years. Surprisingly, in 2013 the Senate passed the comprehensive bipartisan Border Security, Economic Competitiveness, and Immigration Modernization Act of 2013 (S. 744). This bill includes, among many initiatives, increased border security and an enhanced E-Verify, a guest worker program; modifications in the visa system and a legalization program with a 13-year path to citizenship. The House of Representatives has decided not to support the Senate bill and instead has proposed several initiatives, a piecemeal approach instead of a comprehensive one, emphasizing stricter border enforcement, with no intention, so far, of legalizing the 11.7 million unauthorized migrants with a path to citizenship.17 President Obama, tired of the House of Representatives' inaction, has said he has no choice but to act alone. And, while legal experts say he has the authority as president to take bold steps, offering temporary deportation relief to as many as half the country's entire population of undocumented immigrants,18 this could result in a political firestorm and make the immigration issue more divisive.
Unfortunately, the immigration debate is ticking at the same pace as the elections clock. Among many things, the 2014 congressional elections have jeopardized the migration debate about a comprehensive immigration reform, leaving the 2013 Senate proposal frozen. Conservative Republicans, who support guest worker programs and reinforcement of the border, do not support comprehensive reform because they argue the legalization initiative would be a reward for unauthorized migrants who have broken the law, among other reasons. Immigration issues may well permeate the 2015-2016 presidential campaign. If the House passes some pieces of immigration legislation, whether they become law or not, immigration reform debate will still be a part, though not necessarily a major one, of presidential campaign issues for both candidates (Renshon, 2014).
Foreigners in Mexico and the New Phenomena of "Return Migration"
Mexico has always been a traditional migrant sending country, mainly to the United States. But today, besides being a country of emigration, it is one of immigration, transit, asylum, and return migration. Generally speaking, we can say that in the past Mexico has had a restrictive migration policy; its foreign-born residents represent only 1 percent of the population, compared to Canada and the United States, where 21 percent and 13 percent, respectively, are foreign-born.19 However, we must recognize that it has been very generous in receiving many foreigners persecuted for various reasons, such the case of the Spanish, Argentinians, Chileans, Cubans, and, as already mentioned, many Central Americans in different periods of Mexican history
Nevertheless, a new phenomena has emerged: Mexico's foreign-born population has doubled during the last decade. Table 3 shows that in 2010 the Mexican Census registered 961 121 foreign-born persons -77 percent were born in the U.S.-; whereas the 2000 census recorded 492 617 foreign residents in Mexico, 70 percent of whom came from the United States. The other five countries of origin of migrants in order of importance are Gautemala, Spain, Colombia, Argentina, and Cuba (Fundación BBVA Bancomer, BBVA Research, and SEGOB, 2014). Just to compare with other census data: the 1990 Mexican census documented 339 780 foreigners living in Mexico and 192 208 in 1970 (lNEGI, 2004).

Two main reasons explain this: new economic opportunities in Mexico make the country more attractive, and return migration of Mexican families and their U.S.citizen children living in the United States to different states in Mexico has risen tremendously. Some studies have demonstrated that many of the Mexicans who have returned have done so voluntary because U.S. economic conditions are no longer attractive; others have been deported due to the extremely harsh "deportation policy" that has taken them out of their workplaces or homes in the last decade.20 According to Mexican census data, 824 000 Mexicans left the U.S. to move to Mexico between 2005 and 2010 (Fundación BBVA Bancomer, BBVA Research, and SEGOB, 2014). Mexican-born adults make up just under three-quarters of the total flow; Mexican-born children are about 5 percent and U.S.-born children of Mexican parents are the remaining 20 percent, approximately 280 000 (Passel, Cohn, and Gonzalez Barrera, 2012). U.S.-born children residing in Mexico have been living here since a young age, but others have returned more recently to Mexico and are experiencing difficulty integrating into Mexican society and its educational system. Mexico is also home to a small number of U.S. retirees (Alba, 2013).
As indicated earlier, trade between the U.S. and Canada grew substantially as did investment. Likewise, jobs have been created but also lost in different sectors and regions. Nevertheless, the important hike in trade and investment has not been sufficient to create enough jobs to bring about the economic paradise that the negotiators dreamed of 20 years ago. Being realistic, free trade agreements are not substitutes for domestic economic growth strategies, essential for the economic development of any country.
It is true that the increased trade and investment did necessarily serve as a catalyst to promote the move of professionals, mainly U.S. citizens, to the Mexican labor market. Mexico's government established a formal process to permit the entry of foreign professionals, allowing both domestic and foreign companies to take advantage of the tremendous comparative advantage between their partners in highly qualified services. Statistics from the National Immigration Institute (LNM) of the Ministry of the Interior show the number of entries of different types of visitors, taking into account that a person may enter several times a year. The number of foreign non-residents entering the country between 1994 and 2012 increased 400 percent from 5.2 million to almost 18.7 million. The number of business visitors swelled from 30 000 to 680 000 in the same period (see Table 4).

The number of U.S. citizens who have been granted permanent resident visas (FM2) by the National Immigration Institute has been growing steadily, although in absolute terms it is small: from a total of 7 186 visas issued in 2007 (1 409 for U.S. citizens and 217 for Canadians) to 21 464 in 2011 (4 260 for U.S. citizens and 849 for Canadians). In 2013, almost 13 000 U.S. citizens had permanent residence permits and 374 renewed the ones they already had; 3 077 Canadians had permits and only 67 renewed them (Instituto Nacional de Migración, 2011a). Unfortunately, data from 1994 on cannot be compared to current data because the Mexican government used different methodologies for gathering them.
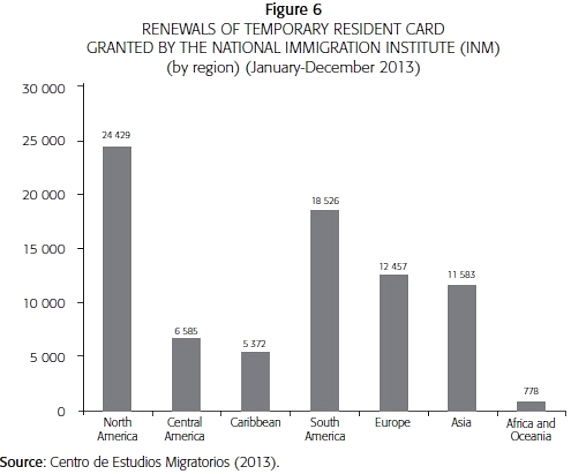
In the case of non-immigrants admitted with an FM3 visa, from 2009 to 2012, in 2012, the numbers had grown from 32 533 (8 570 U.S. citizens and 2 187 Canadians) to 39 685 (8 226 for U.S. citizens and almost 1 970 for Canadian citizens) (Instituto Nacional de Migración, 2011b). It is precisely in times of world economic crisis that Mexico received an important number of foreigners. In 2013, 79 731 FM3 temporary resident cards were renewed, 20 000 of them for U.S. citizens (6 314 for work purposes) and 5 000 for Canadians (1 419 for work purposes). There is also more demand for other foreigners to pursue economic opportunities in Mexico: 18 526 South Americans renewed their temporary resident cards, as did 12 457 Europeans in 2013 (see Figure 6). The entries of foreigners residing as non-immigrants in Mexico also grew significantly, from 84 000 entries at the beginning of the 1990s to 493 600 in 2012 (permanent residents from 33 400 to 150 600 and temporary residents from 50 000 entries to 342 000) (Centro de Estudios Migratorios, 2012).
It is important to stress that according to the Mexican census, 45.3 percent of immigrants in Mexico are in the work force; of these, only 4 out of every 100 are unemployed or looking for a job. Of the total employed immigrant population, around seven out of ten work in activities related to the services sector (Fundación BBVA Bancomer, BBVA Research, and SEGOB, 2014).
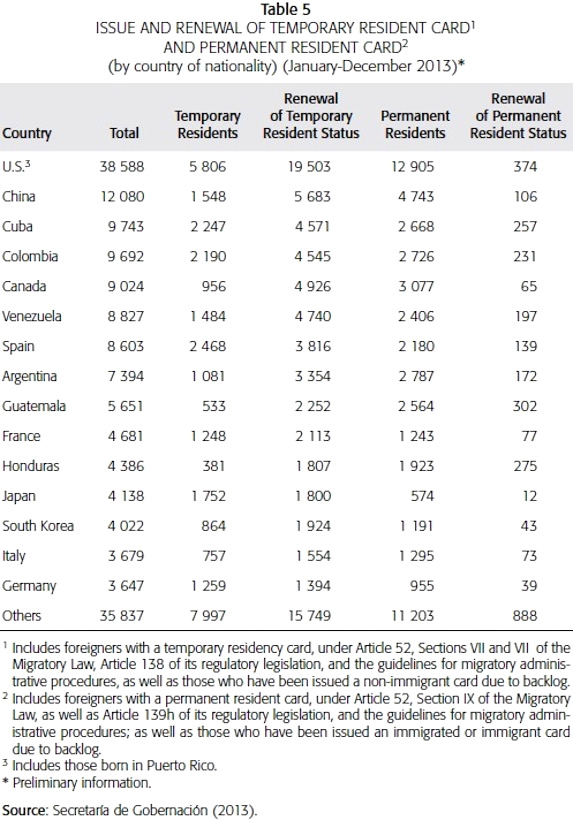
Traditionally, we have received "border workers" mainly along our southern border, from Guatemala and Belize. They receive regional temporary visitor visas and temporary border worker permits. For example, 5 561 permanent and temporary residents from Guatemala were registered in 2013 (see Table 5). The apprehensions or seizures, called "aseguramientos," of potentially deportable foreigners, mainly from Central America (45 percent from Guatemala), are counted as events, not persons. After 1995, they grew steadily and then began to decline in 2007 with the economic crisis. In 2011, the number of "aseguramientos" (66 583) was roughly one-quarter of its 2005 peak of 240 269 (Alba, 2013).
However, the number of people from North America who entered the country for business reasons increased significantly from 30 422 in 1994, when NAFTA was implemented, to 680 551 in 2012, having decreased considerably during the economic crisis to 334 899 and 299 100 in 2009 and 2010, respectively.21
The data mentioned above indicates that since NAFTA came into effect, significant numbers of business visitors, traders, investors, professionals, and workers have transferred to the Mexican labor market, indicating greater economic dynamism. This indicates the great amount of trade and international business during the period with their partners. The significant increase in trade transactions and the important foreign direct investment flows were catalysts for the movement of mainly U.S. professionals into the Mexican labor market. Many job opportunities, mainly in manufacturing, open up in Mexico every year because of its low labor costs and its proximity to the U.S. This ranges from the new, booming aerospace engineering sector in Queretaro and central Mexico (the Canadian company Bombardier) to traditional footwear assembly in Guanajuato. High-tech exports accounted for 17 percent of Mexican gross domestic product in 2012, while cars amounted to a quarter of all Mexican exports that same year. The high tariffs on high-tech products manufactured outside the NAFTA region give Mexico a notable advantage (Lanthemann, 2014).
Regarding transmigrants, Mexico has faced an important problem of simultaneously being a stopover for transit migrants, primarily undocumented, mostly from Central America on the way to the United States, and a traditional flow of temporary workers from Central America and a few other countries to work in Mexico. Today, this transit migration, specifically unaccompanied children, constitutes another hot issue complicating the already conflictive Mexico-U.S. migratory relationship, a situation that has exacerbated over the last year. In order to face this growing problem, President Felipe Calderon's administration took an important step proposing a comprehensive migration law. In 2011, Mexico's Senate followed up with a new migration law plus amendments to the 1974 General Law on Population and other related laws and codes (González-Murphy and Koslowski, 2011). This new law governs migration to, from, and through Mexico. The law came into effect in 2012 to better regulate visitors, temporary and permanent migrant flows, and to ensure migrants' rights in the face of increasing violations, including those of transmigrants whose rights are hugely violated in their hazardous sojourn through Mexico to the United States.
As mentioned above, the transit of unaccompanied Central American children through Mexico to the U.S. has become a highly divisive issue in bilateral relations. President Obama has started to pressure Mexican President Enrique Peña Nieto to "thoroughly collaborate" by stopping children at the southern border or deporting them before they arrive to the U.S.
Final Reflections
The important growth of exports to and foreign investment in Mexico from the U.S. and Canada has been insufficient to create the jobs needed, push wages up and reduce the pressure to emigrate to the United States as NAFTA negotiators had hoped, mainly during the first 15 years of its operation. We must recognize that the recurring, prolonged economic crises that we have experienced during the period analyzed, together with the complex readjustments in the Mexican economy have not benefited certain sectors like agriculture, but rather have caused severe regional inequalities. The important wage differentials for the same kinds of jobs that make U.S. salaries much more attractive for Mexicans, the dependence on remittances they send from abroad, and the growing, deeply-rooted, highly technical social networks that have grown during the last 20 years have been determining factors in continuing to make migration very attractive, influencing people's decision to emigrate north.
NAFTA, an expression of the economic ties among these three countries, undoubtedly did create a space for greater formal and informal, documented and undocumented labor mobility than expected when it was conceived. As trade partners, we must take responsibility for the direction we take in the near future. For that reason, we should ask what the next step through or within NAFTA should be. Is it feasible to renegotiate this treaty to include some immigration mechanisms to increase labor mobility? Now that Mexico has approved an energy reform that it had considered non-negotiable, could this be a good opportunity for a more ambitious regional project including labor? In the case of Canada, is it possible to strengthen our ties to build bridges to eliminate the visa imposed for Mexicans in 2009? Is it relevant to ask ourselves what our next step within NAFTA should be?
Given the infrastructure created by NAFTA, it is essential that the Mexican government explore the possibility of establishing a collateral or derivitive treaty within NAFTA to increase the number of TN visas for Mexicans as an option for medium- or low-skilled labor mobility and to expand the categories, so current undocumented Mexican workers are allowed to adjust their status to the TN status requirements. This labor is clearly required in the U.S., given the fact that a large proportion of the 6.5 million Mexican undocumented migrants have jobs.
The U.S. Congress must urgently approve truly comprehensive immigration reform to provide opportunities for increasingly vulnerable unauthorized migrants. Meanwhile, deportation relief is also urgent for this community. NAFTA may be an ideal platform upon which to base immigration reform, at least as it pertains to Mexico and Canada. Mexico does not have any migratory privileges, not even the "waiver." This could open the door toward legalization for those who have been living for many years contributing to the overall U.S. economy and who have U.S. citizen children or "Dreamers," who could get temporary visas as they wait for permanent ones. It is urgent to look ahead with a strategic vision to U.S. labor markets' future needs, establishing programs to import labor or increase the number of visas for that purpose. The needs of transnational families separated between the U.S. and Mexico must be dealt with immediately. Local communities, with limited infrastructure in Mexico, do not have sufficient means to help returning migrants and their families. Some deported aliens may attempt to return when the U.S. economy improves more, because they left very close family members all over the country.
Finally, more educational exchanges must be encouraged; one of the projects could be the creation of a program including technical training of temporary migrants, with the aim of their returning to their places of origin to contribute there for the benefit of a future North American community. New avenues should be built to foster a real North American region, not only to be more competitive, but also to share responsibilities among the three member countries in trying to solve the migration dilemma that has been growing since the creation of NAFTA 20 years ago.
Bibliography
Alba, Francisco. 2013 "Mexico. The New Migration Narrative," Migration Policy Institute, http://www.migrationpolicy.org/article/mexico-new-migration-narrative, accessed in January 2014. [ Links ]
Banco de México. n.d. Remesas familiares, http://www.banxico.org.mx/SieInternet/consultarDirectorioInternetAction.do?accion=consultarCuadroAnalitico&idCuadro=CA11§or=1&locale=es. [ Links ]
Barefoot, Kevin B., and Marilyn Ibarra-Caton. 2013 "Direct Investment Positions for 2012. Country and Industry Detail," Bureau of Economic Analysis (BEA), http://www.bea.gov/scb/pdf/2013/07%20July/0713_direct_investment_positions.pdf, accessed in May 2014. [ Links ]
Bloomberg Editors. 2014 "The Only Way to Stop Illegal Immigration," Bloomberg View, http://www.bloombergview.com/articles/2014-03-12/the-only-way-to-stop-illegal-im-migration, accessed in July 2014. [ Links ]
Bureau of Economic Analysis. n.d. Online database, http://www.bea.gov. [ Links ]
CBC Canada. 2013 "Canada's Foreign-Born Population Soars to 6.8 Million," http://www.cbc.ca/news/canada/canada-s-foreign-born-population-soars-to-6-8-million-1.1308179, accessed in December 2013. [ Links ]
Centro de Estudios Migratorios. 2013 "Renovaciones de tarjeta de residente temporal otorgadas por el INM a ciudadanos de Canadá y Estados Unidos," Secretaría de Gobernación, Unidad de Política Migratoria, cuadro 2.3.2 (mimeo). [ Links ]
---------- 2012 "Extranjeros no residentes y residentes en México: visitantes de negocios y trabajadores fronterizos, 1994, 2004, 2012," Secretaría de Gobernación, Unidad de Política Migratoria, http://www.politicamigratoria.gob.mx/es_mx/SEGOB/Series_Historicas, accessed in October 2013. [ Links ]
Citizenship and Immigration Canada. 2012a "Facts and Figures 2012-Immigration Overview: Permanent and Temporary Residents," http://www.cic.gc.ca/english/resources/statistics/facts2012/index.asp, accessed in October 2013. [ Links ]
---------- 2012b "Facts and Figures 2012-Immigration Overview: Permanent and Temporary Residents," http://www.cic.gc.ca/english/resources/statistics/facts2012/temporary/07.asp, accessed in December 2013. [ Links ]
---------- 2011 "Facts and Figures 2011-Immigration Overview: Permanent and Temporary Residents," http://www.cic.gc.ca/english/resources/statistics/facts2011/permanent/10.asp, accessed in December 2013. [ Links ]
CNN Expansión. 2013 "Visa canadiense tumba turismo mexicano," http://www.cnnexpansion.com/economia/2013/07/14/visa-canadiense-tumba-turismo-mexicano, accessed in May 2014. [ Links ]
Consejo Nacional de Población. 2010 XII Censo General de Población y Vivienda, Mexico City. [ Links ]
---------- 1990 XI Censo General de Población y Vivienda, Mexico City. [ Links ]
Consulado General de México en Toronto. 2014 "PTAT - Programa de trabajadores agrícolas temporales México-Canadá," Secretaría de Relaciones Exteriores, http://consulmex.sre.gob.mx/toronto/index.php/es/programa-de-trabajadores-agricolas, accessed in July 2014. [ Links ]
Corporate Canada. 2013 "Helping Tourism Business Prosper," Canadian Tourism Commission, https://encorporate.canada.travel/sites/default/files/pdf/Corporate_reports/final_2013_annual_report_en.pdf, accessed in July 2014. [ Links ]
Couronne, Ivan. 2014 "Facts and Figures on Child Migrants Heading to U.S.," Yahoo News, http://news.yahoo.com/facts-figures-child-migrants-heading-us-215205134.html, accessed in July 2014. [ Links ]
Economist, The. 2014 "Rivals More than Friends," Americas View, http://www.economist.com/blogs/americasview/2014/02/canadian-mexican-relations, accessed in May 2014. [ Links ]
Fergusson, Ian F., and M. Angeles Villarreal. 2014 "NAFTA at 20: Overview and Trade Effects," Congressional Research Service. Informing the Legislative Debate Since 1914, Washington, D.C., April, p. 18, http://fas.org/sgp/crs/row/R42965.pdf, accessed in May 2014. [ Links ]
Fundación BBVA Bancomer, BBVA Research, and SEGOB. 2014 Yearbook of Migration and Remittances, Mexico City, Bancomer. [ Links ]
Gonzalez Barrera, Anna. 2014 "Record Number of Deportations in 2012," Fact Tank. News in the Numbers, Pew Research Center, http://www.pewresearch.org/fact-tank/2014/01/24/record-number-of-deportations-in-2012/, accessed in February 2014. [ Links ]
Gonzalez Barrera, Anna, and Mark Hugo Lopez. 2013 "A Demographic Portrait of Mexican-Origin Hispanics in the United States," Pew Research Hispanic Trends Project, http://www.pewhispanic.org/2013/05/01/a-demographic-portrait-of-mexican-origin-hispanics-in-the-united-states/, accessed in December 2013. [ Links ]
González-Murphy, Laura V., and Rey Koslowski. 2011 "Understanding Mexico's Changing Immigration Laws", Woodrow Wilson International Center for Scholars. Mexico Institute, http://www.wilsoncenter.org/sites/default/files/G0NZALEZ%20%2526%20K0SL0WSKi.pdf, accessed in July 2014. [ Links ]
Hills, Carla. 2014 "Las ventajas económicas del TLCAN: el punto de vista de Estados Unidos," Foreign Affairs Latinoamérica, vol. 14, no. 2, April-June. [ Links ]
IMF (International Monetary Fund). 2013 IMF eLibrary - Data, http://elibrary-data.imf.org. [ Links ]
INEGI (Instituto Nacional de Estadística y Geografía). 2004 "México como país de destino, Censo General de Población, 1953, 1972 y 2001," Mexico City, Secretaría de Gobernación, Consejo Consultivo. [ Links ]
INM (Instituto Nacional de Migración). 2011a "Expedición de documentos para inmigrantes (FM2) otorgadas por el INM según continente, país de nacionalidad y sexo 2007-2011," www.inm.gob.mx/estadisticas/series_historicas/FM2xNacyS_07_11.xls, accessed in July 2014. [ Links ]
---------- 2011b "Expedición de documentos para no inmigrantes (FM2) otorgadas por el INM según continente, país de nacionalidad y sexo 2007-2011," www.inm.gob.mx/estadisticas/series_historicas/FM2xNacyS_07_11.xls/. accessed in July 2014. [ Links ]
Instituto de los Mexicanos en el Exterior. 2014 "Los mexicanos en Canadá 2011," Mexico City, Secretaría de Relaciones Exteriores, http://www.ime.gob.mx/estadisticas-de-mexicanos-en-canada, accessed in July 2014. [ Links ]
Isacson, Adam, Maureen Meyer, and Gabriela Morales 2014 Mexico's Other Border: Security, Migration, and the Humanitarian Crisis at the Line with Central America, Washington Office on Latin America (WOLA), http://www.wola.org/publications/mexicos_other_border, accessed in July 2014. [ Links ]
Jiménez G., Miguel Ángel. 2013 "Legal Migration and Free Trade in the NAFTA Era: Beyond Migration Rhetoric," Wilson Center, Mexico Institute, http://www.wilsoncenter.org/publication/legal-migration-and-free-trade-the-NAFTA-era-beyond-migration-rhetoric, accessed in December 2013. [ Links ]
Lanthemann, Marc. 2014 "NAFTA and the Future of Canada, Mexico and the United States," Stratfor Global Intelligence, http://www.stratfor.com/weekly/NAFTA-and-future-canada-mexico-and-united-states, accessed in February and March 2014. [ Links ]
Levine, Elaine, and Mónica Verea. 2014 Impacts of the Recent Economic Crisis on International Migration, Mexico City, CISAN-UNAM. [ Links ]
Limantour, José Yves 1965 Apuntes sobre mi vida pública, Mexico City, Porrúa. [ Links ]
Lopez, Mark Hugo, Paul Taylor, Cary Funk, and Anna Gonzalez-Barrera 2013 "On Immigration Policy, Deportation Relief Seen as More Important than Citizenship: A Survey of Hispanics and Asian Americans," Pew Research Hispanic Trends Project, http://www.pewhispanic.org/2013/12/19/on-immigration-policy-deportation-relief-seen-as-more-important-than-citizenship/, accessed in January 2014. [ Links ]
Migration News. 1994 "Illegal Immigration: Numbers, Benefits, and Costs in California," Migration News, vol. 1, no. 4, May, http://migration.ucdavis.edu/mn/more.php?id=298_0_2_0, accessed in January 2014. [ Links ]
Monger, Randall. 2013 Nonimmigrant Admissions to the United States: 2012, Department of Homeland Security (DHS), https://www.DHS.gov/sites/default/files/publications/ois_ni_fr_2012.pdf, accessed in June 2014. [ Links ]
Monger, Randall, and James Yankay. 2014 "U.S. Lawful Permanent Residents: 2013," Department of Homeland Security (DHS), http://www.DHS.gov/sites/default/files/publications/ois_lpr_fr_2013.pdf, accessed in June 2014. [ Links ]
Nazario, Sonia. 2014 "The Children of the Drug Wars: A Refugee Crisis, Not an Immigration Crisis," The New York Times, July 11, http://www.nytimes.com/2014/07/13/opinion/sunday/a-refugee-crisis-not-an-immigration-crisis.html?_r=0, accessed in July 2014.
Passel, Jeffrey S., D'Vera Cohn, and Anna Gonzalez Barrera. 2013 "Population Decline of Unauthorized Immigrants Stalls, May Have Reversed. New Estimate: 11.7 million in 2012," Pew Research Hispanic Trends Project, http://www.pewhispanic.org/2013/09/23/population-decline-of-unauthorized-immigrants-stalls-may-have-reversed/, accessed in October 2013. [ Links ]
---------- 2012 "Net Migration from Mexico Falls to Zero- and Perhaps Less. Migration between U.S. and Mexico," Pew Research Hispanic Trends Project, http://www.pewhispanic.org/2012/04/23/net-migration-from-mexico-falls-to-zero-and-perhaps-less/, accessed in September 2013. [ Links ]
Pew Research Center. 2013 "Immigration: Key Data Points from Pew Research," March 5, http://www.pewresearch.org/key-data-points/immigration-tip-sheet-on-u-s-public-opinion/, accessed in January 2014. [ Links ]
Renshon, Stanley. 2014 "The 2014 Congressional Elections and Real Immigration Reform, Pt. 4," Center for Immigration Studies, http://www.cis.org/renshon/2014-congressional-elections-and-real-immigration-refor-pt-4, accessed in July 2014. [ Links ]
Rhoda, Richard, and Tony Burton. 2010 "Where Do Most Foreigners Live in Mexico?" Geo-Mexico: The Geography and Dynamics of Modern Mexico, January, http://geo-mexico.com/?s=F0REiGN+RESIDENTS+&searchsubmit, accessed in July 2014. [ Links ]
Ricardi, Nicholas. 2014 "Child Migrant Surge Shifts Politics of Immigration," Yahoo News, http://news.yahoo.com/child-migrant-surge-shifts-politics-immigration-175907481-election.html, accessed in July 2014. [ Links ]
Secretaría de Gobernación. 2013 Estadística migratoria síntesis 2013, http://observatoriocolef.org/_admin/documentos/Sintesis2013.pdf. [ Links ]
---------- n.d.a Unidad de Política Migratoria, Series Históricas, http://www.politicamigratoria.gob.mx/es_mx/SEGOB/Series_Historicas. [ Links ]
---------- n.d.b http://www.estudiosdemigracion.org/inedim2013/index.php/mascoslegales/perfiles-nacionales/mexico. [ Links ]
Secretaría del Trabajo y Previsión Social. 2013 "Programa de trabajadores agrícolas temporales México-Canadá," http://www.empleo.gob.mx/en_mx/empleo/Programas_de_Empleo, accessed in October 2013. [ Links ]
Serra Puche, Jaime. 2014 "NAFTA in Its 20th Anniversary," paper presented at the international conference "TLCAN a 20 años de su entrada en vigor," Comexi, Mexico City, February 4. [ Links ]
Statistics Canada. 2011 "Immigration and Ethnocultural Diversity in Canada," National Households Survey, http://www12.statcan.gc.ca/nhs-enm/2011/as-sa/99-010-x/99-010-x2011001-eng.cfm#a2, accessed in January 2014. [ Links ]
Tutrán, Rodolfo, and José Luis Avila. 2013 "Migración calificada entre México-Estados Unidos: desafíos y opciones de política," Migración y desarrollo, vol. 11, no. 21, pp. 43-63. [ Links ]
UNHRC (United Nations Human Rights Council). 2014 Children on the Run: Unaccompanied Children Leaving Central America and Mexico and the Need for International Protection, http://unhcrwashington.org/children/reports, accessed in July 2014. [ Links ]
United States Citizenship and Immigration Services. 2012 The Triennial Comprehensive Report of Immigration, http://www.uscis.gov/sites/default/files/uscis/Resources/Reports%20and%20Studies/tri3fullreport.pdf, accessed in July 2014. [ Links ]
U.S. Department of Homeland Security (DHS). 2013a "Lawful Permanent Residents: Data Tables," Yearbook of Immigration Statistics, http://www.DHS.gov/yearbook-immigration-statistics, accessed in different years. [ Links ]
---------- 2013b "Naturalizations: Data Tables," Yearbook of Immigration Statistics, http://www.DHS.gov/yearbook-immigration-statistics, accessed in different years. [ Links ]
---------- 2012 "Immigration Enforcement Actions," Yearbook of Immigration Statistics, https://www.DHS.gov/yearbook-immigration-statistics, accessed in January 2014. [ Links ]
Verea, Mónica. 2014 "El debate hacia una reforma migratoria en Estados Unidos durante los primeros años del siglo XXI," in Patricia Galeana, ed., Migraciones en las Américas, Mexico City, UNAM. [ Links ]
---------- 2012 "Aproximaciones teóricas para entender las políticas migratorias restrictivas y los sentimientos anti-inmigrantes en el siglo XXI," in Mónica Verea, ed., Políticas y sentimientos anti-inmigrantes en América del Norte y la Unión Europea, Mexico City, CISAN-UNAM. [ Links ]
---------- 2010 "Los mexicanos en la política migratoria canadiense," Norteamérica, year 5, no. 1, January-June, pp. 93-127. [ Links ]
---------- 2007 "A 12 años de TLCAN = + migración," in Enriqueta Cabrera, comp., Desafíos de la migración: saldos de la relación México-Estados Unidos, Mexico City, Planeta. [ Links ]
---------- 2006 "Movilidad laboral a 10 años del espacio TLCAN," in Monica Gambrili, ed., Diez años del TLCAN en México, Mexico City, IIEC, Facultad de Economía, CISAN-UNAM. [ Links ]
---------- 2005 "Ten Years of NAFTA = Migration Plus," Voices of Mexico, no. 70, January-March, pp. 102-108. [ Links ]
Walter, Ewing. 2012 "Several Factors Cited for Drop in Net Migration from Mexico," Immigration Impact, http://immigrationimpact.com/2012/04/24/several-factors-cited-for-drop-in-net-migration-from-mexico/#sthash.RLItPi7N.dpuf, accessed in June 2014. [ Links ]
Wessler, Seth Freed. 2012 "Nearly 205K Deportations of Parents of U.S. citizens in Just Over Two Years," Color Lines: News for Actions, http://colorlines.com/archives/2012/12/us_deports_more_than_200k_parents.html, accessed in January 2014. [ Links ]
World Bank. 2014a "GDP Per Capita (Current U.S.$)," http://data.worldbank.org/indicator/NY.GDP.pcAP.CD?page=4, accessed in May 2014. [ Links ]
---------- 2014b "World Development Indicators," http://databank.worldbank.org/data/download/GDP.pdf, accessed in July 2014. [ Links ]
1 Since the end of the nineteenth century, there was an intention to establish a free trade agreement with the United States. In 1877, José Yves Limantour was appointed secretary of a commission to explore the possibility of proposing a trade agreement with the U.S. Before becoming minister of finance in 1892 under the Porfirio Díaz administration, he thought it was not the right time to propose it. His point of view clashed with that of Ignacio L. Vallarta, the foreign minister at the time, who believed an agreement would be very important for Mexico's economic development. The two men were my children's great-great-grandfathers (Limantour, 1965).
2 Although applications from Mexico almost tripled between 2005 and 2008, shooting up from 3 446 to 9 527, only 11 percent of the claims reviewed in 2008 were accepted; still, Mexico became Canada's top source country for asylum applications (Verea, 2010).
3 If in 2008, before the visa was imposed, 257 000 Mexican tourists and business people visited Canada, four years later, only half that number made the trip (139 700 Mexican travelers), after having fallen to 110 000 in 2010 (CNN Expansion, 2013; Corporate Canada, 2013).
4 The World Bank defines per capita GDP as the gross domestic product divided by mid-year population (2014a).
5 This is a calculation by the author using various years of data from the U.S. Department of Homeland Security (2013a).
6 Between 1994 and 2002, 473 380 Mexicans were naturalized; between 2003 and 2012, the number grew to 679 100 (U.S. Department of Homeland Security, 2013b).
7 Colombia, Mexico, and Haiti were the top three source countries for newcomers from the Caribbean and Central and South America (Statistics Canada, 2011).
8 This process takes place at the U.S. consulate in the country of origin of the foreign applicant to work in the U.S.
9 The Mexican Consulate in Toronto has published that 18 499 were hired in 2013 (Consulado General de México en Toronto, 2014).
10 Mexico was in second place after the United States with 36 346 temporary workers (Citizenship and Immigration Canada, 2012a).
11 The main proposals were regularizing the status of Mexicans already residing in the United States, establishing a guest-worker program, accepting enhanced border enforcement, and increasing the number of visas available for Mexicans.
12 In fiscal year 2012, the U.S. Customs and Border Protection (CBP) prevented nearly 145 000 individuals from entering U.S. territory, down from 215 600 in fiscal year 2011 (U.S. Department of Homeland Security, 2012).
13 The DHS has been upgrading the system so that it can access additional databases and more carefully filter applications. From 2007 to 2012, E-Verify queries from employers increased from 3.3 million to more than 21 million. As of February 2013, more than 432 000 employers were using the system to confirm the eligibility of prospective employees (Bloomberg Editors, 2014).
14 These states are emblematic precisely because they are relatively "new destinations" compared to the traditional ones, or their Latino populations grew rapidly, and locals have reacted adversely to their visible presence (Verea, 2012; Levine and Verea, 2014).
15 In 2011 and 2012, 16 000 and 25 000 unaccompanied children arrived in the U.S. (Couronne, 2014).
16 A June 2014 internal draft Homeland Security memo estimated that the number of unaccompanied children, mostly Central Americans and Mexicans, could climb to 90 000 for the fiscal year. CBP has also recorded a more modest, but significant, increase in apprehensions of unaccompanied Mexican children, going from 11 768 in FY 2011 to 17 240 in FY 2013 and 11 577 in the first eight months of FY 2014 (Isacson, Meyer, and Morales, 2014).
17 For more information, see Verea (2014).
18 In 2012, Obama took sweeping executive action on immigration called Deferred Action for Childhood Arrivals (DACA), a program in which immigrants brought to the U.S. as children, called Dreamers, were allowed to remain in the country without fearing deportation; this was highly criticized by conservative Republicans (Verea, 2014).
19 The states with most foreigners are Baja California (about 123 000), Jalisco (84 000), Chihuahua (80 000), Mexico City's Federal District (72 000), and Tamaulipas. After registering relatively few foreigners in 2000, Hidalgo was the state with the fastest growing number of foreigners, up 402 percent by 2010, followed by Tlaxcala (333 percent), Tabasco (281 percent), and Veracruz and Oaxaca (both with 272) (Rhoda and Burton, 2010).
20 For example, between 2010 and 2012, the U.S. government removed approximately 200 000 parents of U.S.-citizen children (Wessler, 2012).
21 The INM stipulates that business visitors include only those coming from the United States and Canada, according to the NAFTA agreement.

