SciELO - Scientific Electronic Library Online

 
vol.64 número1Virtual beams and the Klein paradox for the Klein-Gordon equationElectrones y huecos: perspectivas en torno al debate sobre el realismo científico índice de autoresíndice de assuntospesquisa de artigos
Home Pagelista alfabética de periódicos  

Serviços Personalizados

Journal

Artigo

Indicadores

Links relacionados

  • Não possue artigos similaresSimilares em SciELO

Compartilhar


Revista mexicana de física E

versão impressa ISSN 1870-3542

Rev. mex. fís. E vol.64 no.1 México Jan./Jun. 2018


Education

Finite difference calculation of optical properties of hydrogenic impurity in spherical quantum dot with parabolic confinement

Kriti Batraa  * 

Vinod Prasadb 

aUniversity School of Basic and Applied Sciences, GGS Indraprastha University, Dwarka, Delhi-110078, India.

bDepartment of Physics, Swami Shraddhanand College, University of Delhi, Delhi-110036, India.


Abstract

The optical properties of an electron with an impurity in a spherical quantum dot under parabolic confinement are studied and energies, wave functions, binding energies, radial matrix elements, polarizability, susceptibility and oscillator strength have been evaluated. The numerical method used is the finite difference method in the framework of the effective mass approximation. The variation of the energy levels and radial matrix elements have been studied as function of the radius of the GaAs sphere and also as function of the frequency of the harmonic oscillator potential or parabolic potential. In addition we have studied how polarizability, susceptibility and the oscillator strength vary as a function of dot radius and at different parabolic potential frequencies.

Keywords: Hydrogenic impurity; finite difference method; spherical quantum dots; optical properties

PACS: 78.67Hc; 73.21La; 75.30

1. Introduction

There has been a tremendous improvement in research activities on the low dimensional semiconductor quantum dots due to the advanced fabrication techniques invented for the past few decades. The study of semiconductor quantum dots and nanocrystals has been of a great interest from the experimental and theoretical point of view in recent years 1,2,3,4,5,6,7,8,9,10,11,12,13. The origin of the interest lies in the size of quantization. The electron energy spectrum of an ideal quantum dot comprises a set of discrete levels. This makes the semiconductor quantum dot very important in the applications of optical and transport properties of semiconductors. The physical properties of the quantum dot are attractive not only from the fundamental scientific point of view, but also because of its potential application in the development of semiconductor optoelectronic devices 13.

Impurities in semiconductors can affect the electrical, optical, and transport properties. Understanding the nature of impurity states in semiconductor structures is a crucial problem. Usually impurities are classified as deep or shallow according to their ionization energy. Shallow impurities are defined as those impurities whose ionization energy is comparable or smaller than the thermal energy at room temperature. Shallow impurities are usually known as hydrogenic impurities since they are well described by the hydrogen atom model. The underlying assumptions behind this model are that the binding energy is small compared with the energy gap and the spatial extent of the wave function is larger than the lattice period. As a consequence, carriers have an energy close to the band edge, move with an energy-independent effective mass me* and see the uniform medium of the semiconductor characterized by a dielectric constant ϵ that screens the Coulomb interaction with the impurity. With the characteristic dimensions comparable to the de Broglie wavelength of electron, these structures are particularly sensitive to atomic scale variations in geometry. Thus, impurity can dramatically alter the properties of a quantum device 14. In order to understand how a hydrogenic donor impurity affects the spectrum of a single electron in low-dimensional semiconductor structures, many researchers focused their attention on energy quantized states of the charged carriers. The study of the impurity states in semiconductor nanostructures was initiated only in the pioneering works of Bastard 15. In spite of the growing interest in the topic of impurity doping in nanocrystallites, most of the theoretical works carried out on shallow donors in spherical quantum dots employ variational approaches 16,17 or alternatively, perturbation methods limited to the strong confinement regime using square-well barriers 18,19, while exact solution has been obtained only for centered impurities 20,21. The binding energy of a shallow hydrogenic impurity in a spherical quantum dot with a parabolic potential shape has also been reported 22. Dipole and quadrupole oscillator strengths also have been reported recently by Stevanoviac for the hydrogenic impurity in a spherical quantum dot with an infinite confining potential 23.

The effects of hydrogenic impurity, hydrostatic pressure, temperature and geometrical parameters on optical absorption coefficients and refractive index of spherical quantum dots and raman scattering cross-sections have been reported by Karimi et al.24,25. Safarpour investigated the binding energy, and optical properties of an off center donor impurity in a quantum dot embedded in a nanowire and emphasized on how orientation and distance of impurity from center can serve as good factors in fabricating desired structures with specific electronic and optical properties 26. The effect of dot radius and parabolic potential on binding energy 1s-, 2p-, 3d- and 4f-states of a spherical quantum dot (QD) with parabolic potential has been recently reported 27,28 and the effect of electric field and magnetic field on the low lying states and optical properties of hydrogenic impurity has also been studied 29.

The presence of impurities in QD’s can significantly change the localization states. For simplicity and to protect the symmetric situation the impurity can be located at the center of the dot. An electron bounded to an impurity located at the center of quantum dot behaves like a bounded three-dimensional electron when the radius of the dot is very large. However, as the dot radius is reduced, spatial confinement becomes very important. Thus, spectroscopy tools provide information about the confining properties of electrons and holes bound to hydrogenic impurities in zero dimensional nanostructures.

The purpose of this work is to investigate hydrogenic impurities in spherical quantum dots characterized by the parabolic confining potentials, which have broader applications to realistic problems. The first part of the study contains the evaluation of the spectrum of hydrogenic impurity states and the second part involves study of optical properties. The emphasis is placed on the level energies, wave functions, binding energies, radial transition elements, and optical properties of hydrogenic impurities, varying with the confining potentials and the range of quantum dot. The Schrödinger equation is solved by finite difference method. We have calculated energy eigenvalues, eigenfunctions (Ψnlm) and also the coupling matrix elements Ψnlm|rcosθ|Ψn'l'm', Ψnlm|r2cos2θ|Ψn'l'm' for calculating the dipolar polarizability and also Ψnlm|r2|Ψn'l'm' for calculating the susceptibility of the hydrogenic impurity. Another practical quantity in the study of optical properties is oscillator strength. The oscillator strength gives us information about magnitude of the absorption i.e., the amount of the oscillator strength is directly proportional to the absorption coefficient. In the work we have reported how oscillator strength varies with confinement potential and dot size. A large number of researchers have recently investigated these optical properties and found out how these can be tuned with different dot geometries, size and confinement parameters 30,31,32,33,34,35.

2. Theory

Within the framework of effective-mass approximation, the Hamiltonian of a center hydrogenic donor confined by a spherical QD with a parabolic potential can be written by

H=p22me*+V(r)-γe2ϵr (1)

where the hydrogenic impurity is located at the center of the QD, e is the charge of the electron, r is the position vector of the electron originating from the center of the dot, me* is the effective mass of the electron, γ represents the impurity strength and V(r) is the parabolic confining potential in the form of

V(r)=12me*ω02r2 (2)

where ω0 is the confinement potential frequency. In our model, the Hamiltonian of single hydrogenic impurity in a spherical QD can be expressed as the sum of the original harmonic oscillator Hamiltonian term H 0 and a Coulomb interaction term H 1

H=H0+H1 (3)

where

H0=p22me*+12me*ω02r2 (4)

and

H1=-γe2ϵr (5)

Using p=-i the Hamiltonian becomes

H=-22me*2+12me*ω02r2-γe2ϵr (6)

The Schrödinger equation for the system

HΨ(r,θ,ϕ)=EΨr,θ,ϕ (7)

can be solved using method of separation of variables based on spherical symmetry, where Ψnlm(r,θ,ϕ) is defined as

Ψnlm(r,θ,ϕ)=NRnl(r)Ylm(θ,ϕ) (8)

where N is the normalization coefficient, Ψnlm(r,θ,ϕ) is the complete wave function, R nl (r) is the radial part, Ylm(θ,ϕ) is the angular part of the wavefunction which correspond to spherical harmonics and n, l, m are respectively, the radial, angular momentum and azimuthal quantum numbers. While the angular part of the wavefunction is Ylm(θ,ϕ) for all spherically symmetric situations, the radial part varies. The equation for R nl can be simplified in form by substituting unl(r)=rRnl(r). Therefore

Ψnlm(r,θ,ϕ)=unl(r)rYlm(θ,ϕ), (9)

Substituting Eq. (9) into the Schrödinger equation (7) and using separation of variables and simple mathematical steps the radial equation is written as:

[-22me*d2dr2+2l(l+1)2me*r2+12me*ω02r2-γe2ϵr]unl(r)=Enlunl(r) (10)

The energy eigenvalue E nl for a particular energy state is solved numerically using the finite difference method as explained in the next section.

2.1 Energy spectra and radial matrix elements

The eigenenergies and the wavefunctions are obtained by solving the time independent Schrödinger equation for the system, using finite difference method. This is a numerical method for solving the partial differential equation (PDE) based on discretization of the Hamiltonian on a spatial grid. We have taken the grid points N = 1020 and the tolerance of 1.0e-6 is considered. Finite difference method is a simple method that gives useful and accurate results for a wide range of problems dealing with differential equations. In this method, continuous wave function of r is represented by a set of N discrete quantities and effective potential energy

Ueff=2l(l+1)2me*r2+12me*ω02r2-γe2ϵr (11)

is given by (N - 2) × (N - 2) diagonal matrix. Boundary condition used is u0 = uN = 0. For second order centered finite difference approximation

u=u(rj+1)-2u(rj)+u(rj-1)Δ2 (12)

u(rj) is the eigenvector of the Schrödinger equation and Δ=rj+1-rj is the spacing between the two neighboring discrete points. The second derivative matrix becomes:

K=1Δ2-210...01-210..001-210.0....................1.....1-2 (13)

It is a (N - 2) × (N - 2) matrix. Hamiltonian matrix is [H] = [K] + [U eff], Schrödinger equation in matrix form becomes

HU=[E]|U (14)

where H is the Hamiltonian of the hydrogenic impurity in the semiconductor quantum dot(SQD) and E is the eigenvalue. The Hamiltonian H is reduced to tridiagonal matrix and is diagonalized using standard matlab subroutines to obtain the eigenvalues and the wavefunctions of a hydrogenic impurity in a SQD. This method has been implemented in various semiconductor heterostructures to obtain the unperturbed eigenvalues and wavefunctions 36,37.

In addition we have calculated optical properties like polarizability, oscillator strengths and susceptibility for a hydrogenic impurity in SQD atom under the effect of parabolic potential.

2.2 Polarizability

When a confined system is exposed to static electric field, the electron cloud gets displaced from its equilibrium position. This induces polarization, which is an important microscopic quantity because of its established relationship with another experimentally significant macroscopic property called refractive index. The electric dipole polarizability materializes the second order response of the system in a weak electric field. From perturbation theory, using the second order energy correction, the polarizability is obtained from the sum over states formula. The static 2 l -pole polarizability is given by:

αl=Σk0|Ψ0|rlcoslθ|Ψk|2Ek-E0 (15)

Where l = 1, 2, 3 for dipole, quadrupole and octupole cases, respectively.

2.3. Oscillator strength

Another physical quantity of practical importance in the study on the optical properties is the dimensionless oscillator strength P fi , which is defined by

Pfi=2me*2(Ef-Ei)|zif|2 (16)

where

|zif|2=|Rn'l'(r)rRnl(r)r2dr×Yl'm'(θ,ϕ)(cosθ)Ylm(θ,ϕ)sinθdθdϕ|2 (17)

for 1s-2p transition, l´ = 1, l = 0, and m´ = m = 0 the matrix element |zif|2 becomes

|zif|2=13|0R2,1(r)r3R1,0dr|2 (18)

and

Pfi=2me*32(Ef-Ei)|0R2,1(r)r3R1,0dr|2 (19)

2.4. Magnetic Susceptibility

It is fully known that the magnetic susceptibility has a key aspect on quantum mechanics, magnetism, and optics. The magnetic susceptibility indicates the degree of magnetization of a material in response to an external magnetic field. Substances with a negative magnetic susceptibility are called diamagnetic. The diamagnetic susceptibility is given by 38

χ=-NZe26me*c2r2 (20)

In the next section we have presented the results of our calculations.

3. Results and Discussion

In this study we report a detailed theoretical investigation of the hydrogenic impurity in a spherical quantum dot under parabolic confinement. Effective atomic units are used throughout the paper. Length is expressed in terms of effective Bohr radius a*=2ϵ/me*e2. Effective mass of electron me*=0.067m0 where m 0 is mass of free electron and ϵ=12.5. The effective Bohr radius a * = 100A 0 for GaAs. Energies, wave functions, radial matrix elements of ground states and excited states of impurity in spherical QD and optical properties are calculated.

In Fig. 1 the behaviour of radial wave function u nl (r) of ground and excited states has been shown for different values of harmonic potential frequency ω0. It is observed that the wave functions get modified by the presence of harmonic potential as can be seen going from Fig. 1(a) with ω0=0 eV to Fig. 1(c) with ω0=0.5 eV. Stronger is the strength of harmonic potential (Fig. 1(c)) larger is the confinement in the radial wave function.

Figure 1. Radial wave function (u nl (r)) of ground state and excited states with r at different parabolic potential frequencies (ω0), (a) ω0 = 0 eV (b) ω0 = 0.2 eV (c) ω0 = 0.5 eV. 

In Fig. (2) we have shown how energies of ground state and other excited states vary as a function of the frequency ω0 of parabolic potential for different confinements (r 0) and zero impurity strengths (γ=0). It is observed that energies of ground state and other excited state increases as the frequency increases. Figure 2(a) shows this variation for r0 = 0.5 a * and γ=0. The same variation is studied in Fig. 2(b) for larger r0 = 1 a * and still higher in Fig. 2(c) with r0 = 5 a *. The quantum confinement becomes weak for larger r0 and at large dot radius r0 (Fig. 2(c)), the energy eigenvalues approach a free-space hydrogenic atom. As the confinement is decreased the spacing between the energy levels decreases as expected and their parabolic variation with frequency also disappears.

Figure 2. Variation of energies of ground state and excited states as a function of parabolic potential frequency ω0 at different dot radii (r0) and zero impurity strength (a) r0 = 0.5a *, γ=0 (b) r0 = 1a *, γ=0 (c) r0 = 5a *, γ=0

In Fig. (3) we explore the effect of increase in impurity strength (γ) on the energies of ground state and excited states on similar lines. We can observe that when the value of γ is large (Fig. 3(a), γ=80) we are getting states having negative energies and these are bound states. Also states with same ’n’ and different ’l’ have been found to be degenerate i.e. ’2s-2p’, ’3s-3p-3d’ and ’4s-4p-4d’ are seen nearly degenerate. This is due to the fact that the attractive Coulomb potential dominates over the harmonic potential leading to the reduction of the energy eigenvalues and hence degenerate negative energy states. Also the change in frequency of the harmonic potential is not affecting the energy of states significantly in this case and the curves are nearly straight lines. For smaller values of impurity strength (Fig. 3(b), γ=20) it is seen that the effect of change in energy with change in frequency is significant and the curves are more steeper indicating a participation of the harmonic potential along with the Coulombic potential. In this case there is a mixed combination of negative and positive energy states. These results are in coherence with the two-mode model described by Gueorguiev et al. 39 and a similar competition between the confinement potential and impurity potentials can be seen in our results. These results have been further extended to figure out a critical value of γ=γc above which negative energy states emerge and this critical value has been found to be 3.5. In the Fig. 3(c) the energy of different states is plotted for the critical value of γc=3.5 and there are only positive energy states present indicating that the results are dominated by the harmonic potential over the Coulombic potential. Thus for γc3.5 only positive energy states exist.

Figure 3. Variation of energies of ground state and excited states as a function of parabolic potential frequency ω0 at different impurity strength (γ)and constant dot radius. (a) r0 = 0.5a *, γ = 80 (b) r0 = 0.5a *, γ = 20 (c) r0 = 0.5a *, γ = 3.5. 

In Fig. 4 we have shown how energies of ground state and other excited states vary as a function of radius of the dot (r 0) for different values of frequency of parabolic potential (ω0) and zero impurity strength (γ). It is observed that the energy of all the states is decreased as the size of the dot increased for all energy levels due to the fact that the quantum confinement on the electron relaxes with the enlarging size of the dot. Also these states approach each other for large value of dot radius, which is also explained by otherauthors 40,41. As the dot radius is increased, it can be seen that the constancy occurs for all states at different dot radii. This limiting value corresponds to the case where the electron is not confined anymore. Figure 4(a) shows the variation of excited state energies for ω0=0 eV and γ=0 (absence of impurity). The same is studied at a higher ω0=1 eV and γ=0 (Fig. 4(b)). In the strong confinement region, the maxima of the energies are relatively insensitive to the parabolic potential. The effect of higher frequency of parabolic potential can be seen only at higher r 0 as for smaller values of r 0 the Coulombic interaction is more dominating.

Figure 4. Variation of energies of ground state and excited states with radius r0 of the dot at impurity strength γ=0 and different parabolic potential frequencies (a) ω0=0 eV and (b) ω0=1 eV. 

In Fig. (5) we have calculated the binding energies of different states as a function of radius of the dot (r0). The binding energy of a hydrogenic impurity is known as the difference between the energy states without impurity (γ=0) and with impurity (γ=1) for a particular state. Figure 5(a) shows the binding energies with r 0 for ω0=0.5 eV and in Fig. 5(b) the same is studied at a higher frequency ω0=1 eV. As seen the binding energy decreases with r 0 as expected. Also the binding energy for a particular state is also dependent on the frequency of the harmonic potential. As r 0 increases the binding energy approach a constant value and this constant value is higher for higher ω0. Similar results are also reported by Yakar et. al.27.

Figure 5. Variation of binding energies of ground state and excited states with radius r0 of the dot at parabolic potential frequencies (a) ω0=0.5 eV and (b) ω0=1 eV. 

Next, we have calculated the radial matrix elements which are defined as Rnl|r|Rn'l'. These are very important in defining the effect of external fields on the system. In Fig. (6) we have shown how radial matrix elements between ground state and other excited states vary as a function of the parabolic potential frequency for different confinements and different impurity strength. The radial matrix elements decrease as the frequency is increased. Figure 6(a) shows this variation for r 0=0.5 a.u. and γ=0. The same variation is studied in Fig. 6(b) but for weaker confinement i.e. larger r 0=1 a *. The attractive Coulomb potential is dominant at small r 0 (stronger confinement) and this leads to reduction of spatial extension of wave function and thus smaller values of radial matrix elements (Fig. 6(a)). As the confinement is weakened the magnitude of the radial matrix elements increases largely (Fig. 6(b)). In Fig. 6(c) we have explored the effect of increasing the impurity strength and we observed that the magnitude of some of the radial matrix elements increases where as of others decreases due to the mixed role of attractive Coulomb potential and harmonic potential.

Figure 6. Variation of radial matrix elements of ground state and excited states as a function of parabolic potential frequency ω0 for different dot radii (r0) and impurity strength (γ), (a) r0 = 0.5a *, γ = 0,(b) r0 = 1a *, γ =0,(c) r0 = 0.5a *, γ = 50. 

In Fig. 7 we have reported variation of radial matrix elements of ground state and other excited states vary as a function of dot radius at different frequencies and at different impurity strength. Figure 7(a) shows the radial matrix elements as function of dot radius in the absence of impurity γ =0 at a frequency ω0=0 eV. These are constantly increasing functions of dot radii in the absence of harmonic potential and impurity as expected. An increase in the r0 will also mean a radial spread in the probability density of electron. Figure 7(b) to 7(d) shows the radial matrix elements for different frequencies ω0=0.5 eV (Fig. 7(b)), ω0=1 eV (Fig. 7(c)) both in the absence of impurity γ=0, and in the presence of impurity γ=1 and ω0=0.5 eV in Fig. 7(d). It can be seen that as r0 increases the radial matrix elements first increases and achieve a constant value at a particular dot radii and this limiting value is different for different states and is also dependent upon the frequency of the harmonic potential. Also the effect of presence of impurity is apparent only at higher values of r0.

Figure 7. Variation of radial matrix elements of ground state and excited states with radius r0 of the dot at different impurity strength (γ)and different parabolic potential frequencies (ω0), (a) ω0 = 0 eV, γ = 0, (b) ω0 = 0.5 eV, γ = 0,(c) ω0 = 1 eV, γ = 0, (d) ω0 = 0.5 eV, γ = 1. 

The next set of figures is for the study of optical properties.

We have calculated the 2l -pole static polarizability of the system for l = 1 for various harmonic potential frequencies as a function of r 0. The effect of parabolic potential on such polarizabilities has been explored by considering four values of ω0=0, 0.5 ev, 0.8 eV and 1 eV and their variation with dot radius is given in Fig. 8. It is observed that the polarizability increases as dot radius increases and becomes constant at higher r0. However at higher frequencies its value is smaller than at lower frequency. Since static polarizability is one of the very important experimentally measurable properties, the study of such variation is very crucial for predicting the behaviour the behaviour of such confined systems under analogous experimental situations.

Figure 8. Variation of polarizability with the dot radius r0 for different frequencies of parabolic potential (ω0). 

The diamagnetic susceptibility of a hydrogenic impurity as a function of r 0 has been shown in Fig. 9. It is observed from the figure that the diamagnetic susceptibility decreases from a maximum value as the radius increases. For higher frequency of harmonic potential the diamagnetic susceptibility decreases more slowly. This indicates that there is a strong influence of the confining potential and dimensions of the dot on the diamagnetic susceptibility. Similar results using different shapes and potentials have been reported by 42,43.

Figure 9. Variation of susceptibility with the dot radius r0 for different frequencies of parabolic potential (ω0). 

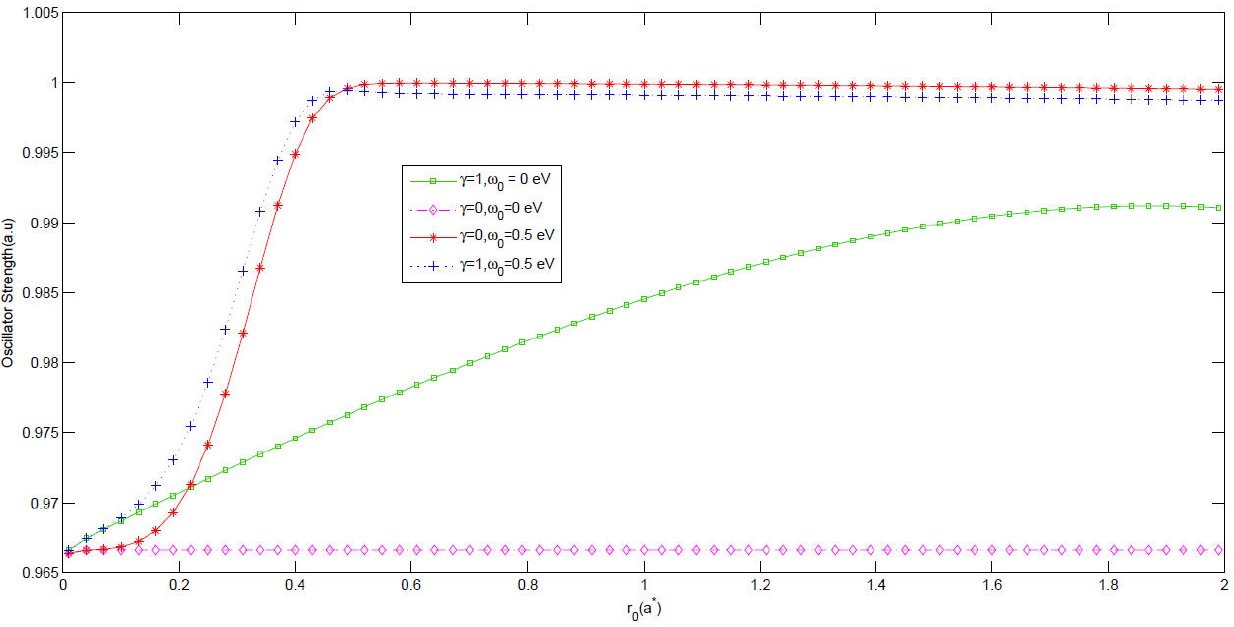
In Fig. 10 we have investigated how the oscillator strengths (1s-2p) varies with the dot radius and study how these get modified with the presence or absence of impurity at different frequencies of harmonic potential. From figure one can easily see that at the given radius (about a = 2a *), P fi displays a maximum and obtains the major portion of 1 (larger than 0.965), so at this given radius the other transition probabilities have a very small portion of 1 and tend toward 0. In addition as the dot radius increases the oscillator strength increases and reaches a constant value at large r 0. While the energy difference decreases with increasing dot radius, the overlapping grows. As a result, the oscillator strength is to be fixed at a constant value in large QDs. In large QD radii, the wave functions of the states, especially that of the 1s state, are localized near the center of the dot because of the attractive Coulomb potential of the impurity. And hence there is some limitation on the overlapping and the dipole matrix element has a constant value. These results are in good agreement with different studies 44.

Figure 10. Variation of oscillator strength with the dot radius r 0 for different frequencies of parabolic potential (ω0) and γ

4. Summary and Conclusion

We investigated the energy spectra, wave functions, binding energies, radial matrix elements of the ground and excited states and optical properties of hydrogenic impurity of the spherical QD with parabolic potential. Energy eigenvalues strongly depend on dot radius and parabolic potential parameters. Removal of degeneracy is observed with the increase of dot radius. Spectra of the system change drastically with the parabolic confinement. In addition, calculated results have shown that the existence of an impurity has a great effect on the energy spectra. The radial matrix elements and optical properties of the system show dependence on dot radius and parabolic confinement. We believe that our study makes an important contribution to the literature. The theoretical investigation of the optical properties in a spherical QD will lead to a better understanding of the properties of QDs. Such theoretical studies may have profound consequences for practical application of the optoelectronic devices and in optical communication.

Acknowledgments

Kriti Batra is thankful to the Hon’ble Vice Chancellor GGS Indraprastha University for the research grant under the Faculty Research Grant scheme for the year 2016-17(F.No. DRC/GGSIPU/FRGS/USBAS/Dr.Kriti Batra/2016-17/13P) wide letter number GGSIPU/DRC/ Ph.D./Adm./2016/1565.

References

1. F.K. Boz, B. Nisanci, S. Aktas and S.E. Okan, Applied Surface Science 387 (2016) 76. [ Links ]

2. Gh. Safarpour, M. Novzari, M.A. Izadi, E. Niknam, and M. Barati, Physica B 436 (2014) 117. [ Links ]

3. B. Vaseghi, G. Rezaei, and T. Sajadi, Physica B 456 (2015) 171. [ Links ]

4. J.H. Yuan, Y. Zhang, X. Guo, J. Zhang and H. Mo, Physica E 68 (2015) 232 [ Links ]

5. R. Khordad, Superlattices and Microstructures 54 (2013) 7 [ Links ]

6. J.J. Sharkey, C.K. Yoo and A.J. Peter, Superlattices and Microstructures 48 (2010) 248 [ Links ]

7. E. Sadeghi, J. Sci. I. A. U (JSIAU) 20 (2010) 122. [ Links ]

8. E. Sadeghi, Physica E 41 (2009) 365. [ Links ]

9. V.A. Kukushkin, JETP Lett. 89 (2009) 437. [ Links ]

10. S. Krishna, Infrared Phys. Technol. 47 (2005) 153. [ Links ]

11. N. Vukmirovic, D. Indjin, Z. Ikonic, and P. Harrison, Acta Phys. Pol. A 116 (2009) 464. [ Links ]

12. A. Majumdar, N. Manquest, A. Faraon, and J. Vukovic, Opt. Express 18 (2010) 3974. [ Links ]

13. K.L. Wang, FellowIEEE, D. Cha, J.L. Liu, and C. Chen, Proceedings of the IEEE 95 (2007) 1866. [ Links ]

14. Z. Xiao, J. Zhu, and F. He, Superlattice Microstruct 19 (1996) 2. [ Links ]

15. G. Bastard, Phys. Rev. B 24 (1981) 4714. [ Links ]

16. A.J. Peter, Physica E 28 (2005) 225. [ Links ]

17. H. Ham and H.N. Spector, J. Appl. Phys. 93 (2003) 3900. [ Links ]

18. C. Bose and C.K. Sarkar, Solid State Electron 42 (1998) 1661. [ Links ]

19. C. Bose and C.K. Sarkar, Physica B 253 (1998) 238. [ Links ]

20. J.L Zhu, J.J. Xiong, and B.L. Gu, Phys. Rev. B 41 (1990) 6001. [ Links ]

21. V. Ranjan and V.A. Singh, J. Appl. Phys. 89 (2001) 6415. [ Links ]

22. C. Bose, Physica E 4 (1999) 180. [ Links ]

23. L. Stevanovi’c, J. Phys. B 43 (2010) 165002. [ Links ]

24. M.J. Karimi, G. Rezaei, and M. Nazari, Journal of Luminescence 145 (2014) 55. [ Links ]

25. M.J.Karimi, G.Rezaei, and H.Pakarzadeh, Physics Letters A 377 (2013) 2164. [ Links ]

26. Gh. Safarpour, M. Barati, A. Zamani, and E. Niknam, Journal of Luminescence 145 (2014) 990. [ Links ]

27. Y. Yakar, B. Cakir, and A. Ozmen, Superlattices and Microstructures 60 (2013) 389. [ Links ]

28. Y. Yakar, B. Cakir, and A. Ozmen, Optics Communications 283 (2010) 1795. [ Links ]

29. C. Bekir, U. Atav, Y. Yakar, and A. Ozmen, Chemical Physics 475 (2016) 61. [ Links ]

30. Z. Avazzadeh, H. Bahramiyan, R. Khordad, and S.A. Mohammadi, Eur. Phys. J. Plus 131 (2016) 1. [ Links ]

31. A.J. Peter, Physics Letters A 355 (2006) 59. [ Links ]

32. Gh. Safarpour, M. Barati, M. Moradi, S. Davatolhagh, and A. Zamani, Su perlattices and Microstructures 52 (2012) 387. [ Links ]

33. C. Bekir, Y. Yakar, A. Ozmen, M.O. Sezer, and M. Sahin, Superlattices and Microstructures 47 (2010) 556. [ Links ]

34. S. Davatolhagh, A.R. Jafari, and M.R.K. Vahdani, Superlattices and Microstructures 51 (2012) 62. [ Links ]

35. A.R. Jafari, Y. Naimi, and S. Davatolhagh, Optical and Quantum Electronics 45 (2013) 517. [ Links ]

36. G.V.B. de Souza and A.B. Alfonso, Physica E 66 (2015) 128. [ Links ]

37. K. Batra and V. Prasad, Physica E 61 (2014) 171. [ Links ]

38. C. Kittel, Introduction to Solid State Physics (Wiley, New York, 1998). [ Links ]

39. V.G. Gueorguiev, A.R.P. Rau, and J.P. Draayer, Am. J. Phys. 74 (2006) 394. [ Links ]

40. D.S. Chuu, C.M. Hsiao, and W.N. Mei, Phys. Rev. B 46 (1992) 3898. [ Links ]

41. A. Ozmen, Y. Yakar, B. Ҫakir, and U. Atav, Optics Communications 282 (2009) 3999. [ Links ]

42. R. Khordad, and N. Fathizadeh, Physica B 407 (2012) 1301. [ Links ]

43. A. Mmadi, K. Rahmani, I. Zorkani and A. Jorio, Superlattices and Microstructures 57 (2013) 27. [ Links ]

44. M. Sahin, Physical Review B 77 (2008) 045317. [ Links ]

Received: July 14, 2017; Accepted: August 21, 2017

Creative Commons License This is an open-access article distributed under the terms of the Creative Commons Attribution License