


 nova página do texto(beta)
 Inglês (pdf)
 Artigo em XML
 Referências do artigo
 Enviar este artigo por email
 Citado por SciELO
  Similares em
SciELO
Similares em
SciELO 
 Permalink
Introduction
The Mexican transition zone is the area in which the Neotropical and Nearctic biotas overlap (Halffter, 1976). In a strict sense, this zone includes the highlands of Mexico and Guatemala, whereas northern Mexico and southern United States are clearly Nearctic, and the lowlands of southern Mexico and Central America are clearly Neotropical (Morrone, 2015). Few assemblages of interactions among insects and their host plants have been documented in this Nearctic-Neotropical transition zone, even though their study offers a unique opportunity to link coevolving interactions with different evolutionary affinities.
The interaction between Trichobaris (Curculionidae) and their host plants (Solanum L. and Datura L.) occurs in this diverse and complex Nearctic-Neotropical transition zone. The weevils of the genus Trichobaris have a Nearctic distribution whereas South America is the ancestral area of origin of the Solanaceae family (Dupin et al., 2016), and the region in central Mexico is the area with the greatest species richness of Datura and is thought to be the diversification center (Luna-Cavazos & Bye, 2011).
From the 12 species of Trichobaris, only Trichobaris compacta (Casey, 1892) uses several Datura species as a food. Weevils oviposit into immature fruit, and then larvae eat developing seeds and associated tissues, whereas adults eat leaf tissue. Adults of Trichobaris compacta mate and rest on the host plant (Barber, 1935 and personal observations). Some studies show that this species is unable to develop in other solanaceous species, such as Nicotiana spp. (Diezel et al., 2011). Thus, this weevil is restricted to the Datura plant species. Trichobaris compacta occurs from southeastern USA to northern and central Mexico (Barber, 1935). The geographic distribution of T. compacta (Barber, 1935) differs from that of Datura species that uses as host plants. Datura wrightii is distributed in the deserts of USA and Mexico (Sonoran Desert), whereas D. discolor inhabits the Mexican Pacific Coast and Balsas basin. Datura inoxia occurs in the highlands in central Mexico and USA (Chihuahuan Desert), whereas D. reburra and D. pruinosa are only present in small areas in Mexico (northwest Mexico: states of Sinaloa and Sonora; southern Mexico: states of Morelos, Guerrero and Oaxaca, respectively) (Luna-Cavazos & Bye, 2011). Barber (1935) noted that T. compacta uses several host plant species distributed across a wide geographic area thus possibly promoting the formation of “races” or genetically distinctive populations associated with a particular plant species. However, we have not found evidence of lineages associated to a particular host plant species of Datura (De la Mora et al., 2018).
Here, we aim to elucidate how the genetic variation of Trichobaris compacta is geographically distributed. To this end, we analyzed a fragment of COI gene in individuals from different populations. This genetic marker has been used to test the presence of major genetic discontinuities causing population structure, most likely due to extrinsic barriers (Avise, 2004). Here, we show the (1) genetic diversity of 29 populations of T. compacta, population differentiation and structure estimates, (2) haplotype network, (3) the phylogeny of T. compacta haplotypes, and (4) historical demography.
Materials and methods
Trichobaris compacta occurs in southwestern USA (Barber, 1935) where it feeds upon Datura species. We collected Trichobaris compacta in populations of Datura plants along the Pacific coast of Mexico. For this study, T. compacta was collected on D. wrightii, D. inoxia, D. pruinosa, D. reburra and D. discolor. We selected localities in order to cover the entire distribution of T. compacta (based on Barber, 1935). Collected adult weevils were preserved in absolute alcohol for posterior analysis. Several fruits per plant were collected. To avoid sampling relatives inside a given fruit, we performed genetic analysis on only 1 weevil from each fruit. A total of 29 locations were sampled along the host plant distribution (Table 1; Fig. 1).
Table 1 Populations sampled of Trichobaris compacta and genetic diversity values estimated from COI gene. S segregating sites, h haplotype diversity, π nucleotide diversity and genetic diversity ϴ.
| Number | State, Country | Locality code, host-plant | Coordinates | # insects | # haplotypes | # mutations | S | # Singletons | h | π | ϴ |
|---|---|---|---|---|---|---|---|---|---|---|---|
| 1 | Arizona, USA | 0Az, D. wrightii | 32°35’32.79” N, 110°50’56.54” W | 11 | 4 | 5 | 5 | 2 | 0.600 | 0.002 | 0.002 |
| 2 | Arizona, USA, | 1Az, D. wrightii | 32°36’50.10” N, 110°49’57.91” W | 12 | 7 | 6 | 6 | 5 | 0.833 | 0.001 | 0.003 |
| 3 | Arizona, USA | 2Az, D. wrightii | 32°58’42.19” N, 110°46’8.08” W | 8 | 6 | 5 | 5 | 4 | 0.893 | 0.002 | 0.002 |
| 4 | Arizona, USA | 3Az, D. wrightii | 33°9’21.73” N, 111°46’36.77” W | 10 | 9 | 14 | 13 | 11 | 0.945 | 0.004 | 0.007 |
| 5 | Arizona, USA | 4Az, D. wrightii | 32°3’48.57” N, 110°17’3.42” W | 15 | 8 | 8 | 8 | 7 | 0.848 | 0.002 | 0.003 |
| 6 | Arizona, USA | 6Az, D. wrightii | 33°21’50.08” N, 112°37’32.06” W | 10 | 5 | 7 | 7 | 5 | 0.822 | 0.002 | 0.003 |
| 7 | Arizona, USA | 7Az, D. wrightii | 33°5’25.83” N, 112°2’1.26” W | 2 | 1 | 0 | 0 | 0 | 0.000 | 0.000 | 0.000 |
| 8 | California, USA | 2SD, D. wrightii | 33°34’26.50” N, 117°10’52.59” W | 10 | 4 | 3 | 3 | 1 | 0.644 | 0.001 | 0.001 |
| 9 | California, USA | 3SD, D. wrightii | 33°45’41.29” N, 117°11’27.19” W | 8 | 1 | 0 | 0 | 0 | 0.000 | 0.000 | 0.000 |
| 10 | California, USA | 5SD, D. wrightii | 33°46’4.14” N, 116°19’28.23” W | 6 | 3 | 3 | 3 | 3 | 0.600 | 0.001 | 0.001 |
| 11 | California, USA | 6SD, D. wrightii | 33°46’19.52” N, 116°19’53.98” W | 1 | 1 | 0 | 0 | 0 | 0.000 | 0.000 | 0.000 |
| 12 | California, USA | 7SD, D. wrightii | 33°35’42.08” N, 116°5’52.62” W | 1 | 1 | 0 | 0 | 0 | 0.000 | 0.000 | 0.000 |
| 13 | California, USA | 8SD, D. wrightii | _____ | 3 | 3 | 5 | 5 | 5 | 1.000 | 0.005 | 0.005 |
| 14 | California, USA | 10SD, D. wrightii | 34°6’52.93” N, 116°27’56.07” W | 7 | 1 | 0 | 0 | 0 | 0.000 | 0.000 | 0.000 |
| 15 | California, USA | 11SD, D. wrightii | 34°8’24.06” N, 116°24’48.14” W | 6 | 1 | 0 | 0 | 0 | 0.000 | 0.000 | 0.000 |
| 16 | California, USA | 12SD, D. wrightii | 33°5’38.23” N, 116°57’47.19” W | 4 | 3 | 2 | 2 | 1 | 0.833 | 0.001 | 0.001 |
| 17 | California, USA | 13SD, D. wrightii | 33°29’28.28” N, 117°3’28.97” W | 4 | 3 | 3 | 3 | 3 | 0.833 | 0.002 | 0.002 |
| 18 | California, USA | 14SD, D. wrightii | 33°29’1.49” N, 116°54’45.23” W | 6 | 3 | 6 | 6 | 6 | 0.600 | 0.003 | 0.003 |
| 19 | California, USA | 15SD, D. wrightii | 34°10’35.93” N, 116°25’36.47” W | 12 | 4 | 6 | 6 | 4 | 0.636 | 0.002 | 0.003 |
| 20 | California, USA | 19SD, D. wrightii | 34°15’18.02” N, 116°26’19.72” W | 4 | 2 | 1 | 1 | 1 | 0.500 | 0.001 | 0.001 |
| 21 | California, USA | 20SD, D. wrightii | 33°59’46.45” N, 116°34’43.69” W | 5 | 2 | 1 | 1 | 1 | 0.400 | 0.001 | 0.001 |
| 22 | California, USA | 21SD, D. wrightii | 33°57’29.11” N, 116°35’30.66” W | 2 | 2 | 2 | 2 | 2 | 1.000 | 0.003 | 0.003 |
| 23 | Oaxaca, Mexico | 314, D. discolor | 16°47’11.61” N, 96 12’42.34” W | 13 | 2 | 4 | 4 | 4 | 0.154 | 0.001 | 0.001 |
| 24 | Oaxaca, Mexico | 415, D. pruinosa | 16°40’2.60” N, 96 22’48.98” W | 18 | 2 | 1 | 1 | 0 | 0.366 | 0.001 | 0.000 |
| 25 | Oaxaca, Mexico | 516, D. inoxia | 16°28’46.10” N, 96 13’3.51” W | 19 | 2 | 1 | 1 | 0 | 0.281 | 0.001 | 0.001 |
| 26 | Sonora, Mexico | 828, D. discolor | 32°11’28.14” N, 114 55’19.63” W | 9 | 1 | 0 | 0 | 0 | 0.000 | 0.000 | 0.000 |
| 27 | B.California, Mexico | 129, D. discolor | 26°0’21.46” N, 111 20’35.34” W | 14 | 7 | 17 | 17 | 14 | 0.758 | 0.004 | 0.008 |
| 28 | Oaxaca, Mexico | Oax, D. discolor | 16°55’11.92” N, 96 23’6.10” W | 3 | 1 | 0 | 0 | 0 | 0.000 | 0.000 | 0.000 |
| 29 | Sinaloa, Mexico | OG, D. reburra | 25°26’25.92” N, 108 3’59.49” W | 9 | 5 | 7 | 7 | 5 | 0.833 | 0.003 | 0.003 |
| Total | 232 | 49 | 57 | 56 | 33 | 0.704 | 0.002 | 0.014 |
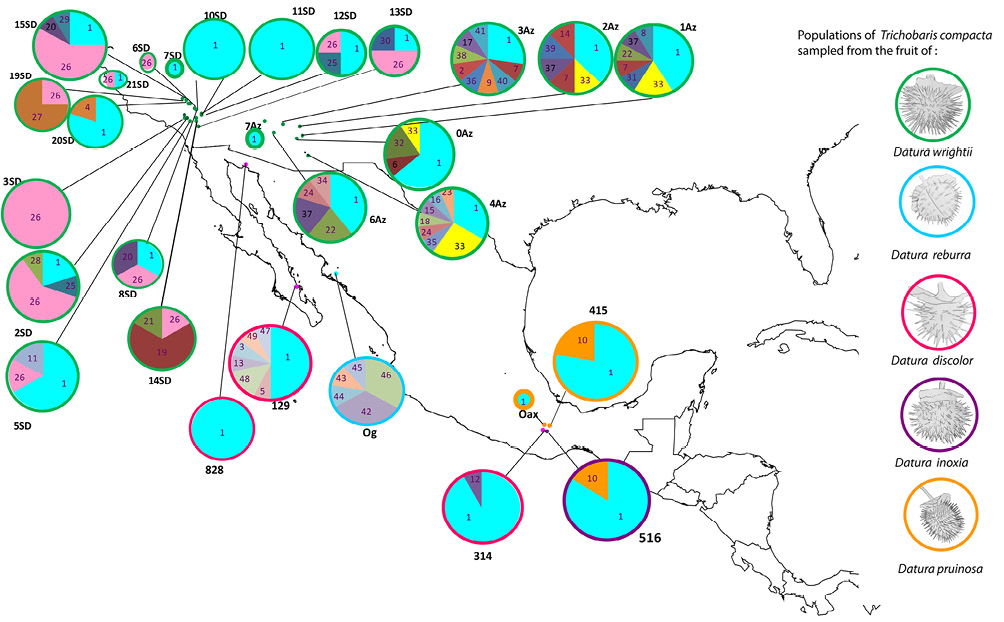
Figure 1 Sampled locations of populations of Trichobaris compacta collected upon several Datura plant species (indicated on the figure), different color dots represent localities, pie charts depict the frequency of each haplotype at given locality, and the size of the circle is proportional to the sample size; each COI haplotype is indicated by a corresponding number (see Table 1 for locality codes and sample size).
Each insect was frozen in liquid nitrogen (-196 °C), then macerated in an eppendorf tube using a micropestle. Genomic DNA was extracted using the DNeasy Tissue Kit (QiagenTM) according to the manufacturer’s protocol for animal tissue. We then amplified a 663-bp nucleotide protein coding region of the mitochondrial gene cytochrome c oxidase I (COI) by polymerase chain reaction (PCR), using the following primers: COA3107 (5´-TCT ATT ARD GGD GAD GCD CTA TCT TG-3´) and COS2183N (5´-CAR CAY YTA TTY TGR TTY TGR TTY TTY GG-3´) (Sota et al., 2004).
Each PCR (total volume of 25.5 ml) contained 1 ml of DNA (20 nM), 1 ml of each primer (10 mM), 0.2 ml of Taq polymerase (1U of Go Taq (Promega), 5 ml of Buffer 5x, 0.5 ml of each nucleotide (10 mM), 3 ml of MgCl2 (25 mM) and 12.3 ml of ddH2O. The thermal cycling conditions were as follows: an initial period of 5 min at 95 ºC, followed by 35 cycles of 60 s at 95 °C, 1.2 min at 55 °C, 60 s at 72 °C, and as a final extension for 7 min at 72 °C. PCR products were sequenced at Washington University using an ABI 3730xl sequencer (Applied BiosystemsTM). All nucleotide sequences obtained were compared, edited manually with SequencherTM 4.7, and aligned with MAFFT (Katoh & Standley, 2013).
To describe the neutral variation of T. compacta, we estimated the total number of haplotypes, mutations, segregating sites (S), nucleotide diversity π, haplotype diversity (h) and the theta index of genetic diversity ϴ using the Nei’s (1987) equations implemented in DNAsp 5.1 (Rozas et al., 2003).
In order to compare the levels of genetic diversity among populations of T. compacta, we estimated the fixation index (F ST ) between populations using Arlequin v. 3.11 (Excoffier et al., 2005). To assess potential genetic clustering due to geographic distribution, we analyzed population structure using 2 methods. First, we used a Bayesian clustering analysis in BAPS for linked loci (Corander & Tang, 2007; Corander et al., 2008); we determined the number of genetic groups with the maximum likelihood value. We performed a mixture analysis with K values from 2 to 12, with 3 iterations each. Then, we used the output file to perform the admixture analysis. The minimum size of populations to be taken into account was set to 1, while 100 iterations were applied to estimate the admixture coefficients of individuals, 10 reference individuals from each population were used, and finally, 100 iterations were performed to estimate the admixture coefficients of the reference individuals. Second, we used a SAMOVA approach (spatial analysis of molecular variance; Dupanloup et al., 2002), which defines populations that are geographically homogeneous and maximally differentiated from each other. We repeated the analyses with 2 (the minimum for SAMOVA) to 20 numbers of groups (K) until the F CT value (the proportion of genetic variation among groups) reached a plateau. Each run consisted of 100 replications.
The method is based on a simulated annealing procedure that aims to maximize the proportion of total genetic variance due to differences among groups of populations (F CT ). The most significant statistical output indicates the number of groups. Simulations have shown that the SAMOVA algorithm does indeed find maximally differentiated groups, especially when data are derived from a single locus.
To visualize the frequency and distribution of haplotypes, we constructed an un-rooted haplotype network using the Median-joining algorithm. This analysis was performed in Network v. 4.6.1.1. (Bandelt et al., 1999). A haplotype phylogeny was estimated with a Bayesian inference analysis in BEAST v.1.4.7 (Drummond & Rambaut, 2007). The parameters of MCMC runs were 30 million generations, sampling every 1,000 generations and discarding the first 10,000 trees as burn-in. We used a GTR+I model of nucleotide substitution and a fixed substitution rate of 2% per million years for COI, as previously reported for coleopterans (Nakamine & Takeda, 2008). To identify ancestral and derived haplotypes in the phylogeny, the trees were rooted using sequences of Trichobaris soror. We analyzed the sets of trees using DensiTree, showing only consensus trees (BEAST v.1.4.7 package software; Drummond & Rambaut, 2007).
To determine whether demographic events have shaped the genetic variation of T. compacta, we estimated Fu and Li’s F (1993)) and Tajima’s D statistics (Tajima, 1989). These estimators assume neutrality to infer population historical demography. The Tajima’s D statistic is expected to be negative when the genetic structure has been influenced by a rapid range expansion, positive when the population has passed through a bottleneck, and zero when there is an equilibrium between mutation and drift (Tajima, 1989). To compare the observed frequencies of pairwise differences with those expected under a model of demographic expansion, mismatch distributions were generated using DNAsp v.4.10 (Rozas et al., 2003). A multimodal distribution is expected when there are no changes affecting population size, but unimodal distributions are expected when sudden demographic expansions have occurred (Rogers & Harpending, 1992).
Results
The southwest Mexico has not previously been reported as a distribution area of T. compacta (Barber, 1935), and most sampling was performed in the northern part of its distribution on D. wrightii and D. discolor (Table 1, from localities 1-22). However, in this study, we report new data for T. compacta distribution and host plant species: D. pruinosa, D. reburra and D. inoxia (Table 1, from localities 23-29). These populations were sampled in southwest Mexico (Fig. 1).
We found 49 haplotypes, 33 segregation sites (S), and 56 singletons (Table 1). Sequences without missing bases were submitted to GenBank (KX359683 to KX359723; Table 2). Trichobaris compacta possess high genetic diversity (h = 0.704, π = 0.002, ϴ = 0.014) (Table 1). The most common haplotype, Co1, is present in the entire distribution range of this weevil (Fig. 1).
Table 2 Genbank accession numbers of haplotypes of Trichobaris compacta.
| Genbank accession number | Haplotype number in this study |
|---|---|
| KX359683 | Co33 |
| KX359684 | Co1 |
| KX359685 | Co37 |
| KX359686 | Co26 |
| KX359687 | Co6 |
| KX359688 | Co27 |
| KX359689 | Co35 |
| KX359690 | Co36 |
| KX359691 | Co8 |
| KX359692 | Co39 |
| KX359693 | Co23 |
| KX359694 | Co7 |
| KX359695 | Co22 |
| KX359696 | Co19 |
| KX359697 | Co5 |
| KX359698 | Co20 |
| KX359699 | Co48 |
| KX359700 | Co28 |
| KX359701 | Co32 |
| KX359702 | Co47 |
| KX359703 | Co49 |
| KX359704 | Co24 |
| KX359705 | Co38 |
| KX359706 | Co25 |
| KX359707 | Co2 |
| KX359708 | Co10 |
| KX359709 | Co14 |
| KX359710 | Co18 |
| KX359711 | Co15 |
| KX359712 | Co17 |
| KX359713 | Co16 |
| KX359714 | Co29 |
| KX359715 | Co9 |
| KX359716 | Co40 |
| KX359717 | Co30 |
| KX359718 | Co13 |
| KX359719 | Co31 |
| KX359720 | Co11 |
| KX359721 | Co41 |
| KX359722 | Co12 |
| KX359723 | Co34 |
A significant genetic differentiation among populations was detected. F ST values range from 0.076 to 1.0 among populations. The most differentiated populations were 14SD, 19SD and 3SD (Table 3, Fig. 1), indicating that the haplotypes of this region are more exclusive along the distribution of T. compacta. The Bayesian clustering analysis performed with BAPS showed that the maximum likelihood value is reached at K = 3 (Fig. 2): cluster 1 in green, cluster 2 in yellow and cluster 3 in blue. Much of the genetic variation is specific to each group 1 (97%), group 2 (100%), and group 3 (87%) with very little gene flow between groups (for example, between group 3 and group 1 is only 1.1%). With SAMOVA, the highest value of F CT was found at K = 3, p-value = 0.05083 ± 0.00800, the criterion for choosing this number of groups was the peak of F CT before the plateau phase (after K = 9 and up to K = 20 values F CT for which the analysis was run) (Table 4).
Table 3 Population differentiation values Fst among sampling sites (at least n = 3) of Trichobaris compacta estimated from COI gene. The statistically significant values are indicated in bold type.
| Fst | 0Az | 10SD | 11SD | 12SD | 13SD | 14SD | 15SD | 19SD | 1Az | 20SD | 2Az | 2SD |
|---|---|---|---|---|---|---|---|---|---|---|---|---|
| 0Az | 0.000 | |||||||||||
| 10SD | -0.024 | 0.000 | ||||||||||
| 11SD | -0.043 | 0.000 | 0.000 | |||||||||
| 12SD | -0.073 | 0.378 | 0.336 | 0.000 | ||||||||
| 13SD | 0.021 | 0.685 | 0.656 | 0.030 | 0.000 | |||||||
| 14SD | 0.147 | 0.599 | 0.571 | 0.418 | 0.500 | 0.000 | ||||||
| 15SD | 0.114 | 0.429 | 0.408 | -0.018 | -0.113 | 0.457 | 0.000 | |||||
| 19SD | 0.176 | 0.938 | 0.931 | 0.583 | 0.333 | 0.683 | 0.294 | 0.000 | ||||
| 1Az | -0.056 | -0.050 | -0.675 | -0.100 | -0.026 | 0.073 | 0.076 | 0.089 | 0.000 | |||
| 20SD | -0.061 | 0.073 | 0.040 | 0.206 | 0.542 | 0.490 | 0.371 | 0.850 | -0.087 | 0.000 | ||
| 2Az | -0.013 | 0.028 | 0.004 | 0.120 | 0.418 | 0.453 | 0.361 | 0.682 | -0.041 | -0.006 | 0.000 | |
| 2SD | 0.135 | 0.635 | 0.616 | 0.100 | -0.120 | 0.588 | -0.053 | 0.380 | 0.085 | 0.560 | 0.485 | 0.000 |
| 314 | 0.035 | -0.055 | -0.072 | 0.231 | 0.577 | 0.578 | 0.436 | 0.808 | 0.005 | -0.026 | 0.058 | 0.581 |
| 3Az | 0.020 | 0.011 | -0.001 | 0.046 | 0.276 | 0.350 | 0.299 | 0.506 | -0.008 | -0.021 | -0.065 | 0.370 |
| 3SD | 0.221 | 1.000 | 1.000 | 0.681 | 0.186 | 0.765 | 0.127 | 0.781 | 0.142 | 0.933 | 0.740 | 0.116 |
| 415 | 0.076 | 0.077 | 0.060 | 0.372 | 0.661 | 0.666 | 0.512 | 0.869 | 0.037 | 0.101 | 0.144 | 0.655 |
| 4Az | 0.027 | 0.038 | 0.020 | 0.148 | 0.436 | 0.483 | 0.385 | 0.667 | 0.012 | 0.020 | 0.033 | 0.483 |
| 516 | 0.078 | 0.020 | 0.004 | 0.404 | 0.701 | 0.689 | 0.528 | 0.891 | 0.038 | 0.081 | 0.138 | 0.681 |
| 5SD | -0.047 | 0.028 | 0.000 | -0.077 | 0.306 | 0.449 | 0.207 | 0.690 | -0.066 | -0.015 | 0.020 | 0.367 |
| 6Az | 0.009 | 0.005 | -0.015 | 0.096 | 0.383 | 0.433 | 0.349 | 0.635 | -0.021 | -0.020 | -0.032 | 0.453 |
| 8SD | -0.108 | 0.300 | 0.250 | -0.124 | 0.039 | 0.051 | 0.011 | 0.445 | -0.140 | 0.142 | 0.122 | 0.210 |
| 854 | 0.003 | 0.000 | 0.000 | 0.445 | 0.731 | 0.644 | 0.465 | 0.949 | -0.026 | 0.126 | 0.065 | 0.667 |
| OG | 0.464 | 0.811 | 0.799 | 0.740 | 0.756 | 0.760 | 0.765 | 0.814 | 0.358 | 0.770 | 0.742 | 0.801 |
| 129 | 0.034 | -0.003 | -0.020 | 0.034 | 0.257 | 0.330 | 0.283 | 0.478 | 0.010 | -0.043 | 0.038 | 0.335 |
| Fst | 314 | 3Az | 3SD | 415 | 4Az | 516 | 5SD | 6Az | 8SD | 854 | OG | 129 |
| 314 | 0.000 | |||||||||||
| 3Az | 0.066 | 0.000 | ||||||||||
| 3SD | 0.836 | 0.546 | 0.000 | |||||||||
| 415 | 0.082 | 0.125 | 0.887 | 0.000 | ||||||||
| 4Az | 0.080 | 0.065 | 0.686 | 0.144 | 0.000 | |||||||
| 516 | 0.050 | 0.122 | 0.909 | -0.043 | 0.135 | 0.000 | ||||||
| 5SD | 0.024 | 0.010 | 0.765 | 0.130 | 0.054 | 0.121 | 0.000 | |||||
| 6Az | 0.050 | -0.003 | 0.677 | 0.121 | 0.024 | 0.114 | 0.013 | 0.000 | ||||
| 8SD | 0.271 | 0.051 | 0.587 | 0.411 | 0.182 | 0.444 | 0.000 | 0.111 | 0.000 | |||
| 854 | -0.031 | 0.041 | 1.000 | 0.103 | 0.065 | 0.044 | 0.072 | 0.037 | 0.379 | 0.000 | ||
| OG | 0.813 | 0.667 | 0.860 | 0.853 | 0.751 | 0.863 | 0.755 | 0.733 | 0.693 | 0.832 | 0.000 | |
| 129 | 0.052 | 0.061 | 0.504 | 0.100 | 0.087 | 0.096 | 0.002 | 0.051 | 0.045 | 0.024 | 0.666 | 0.000 |
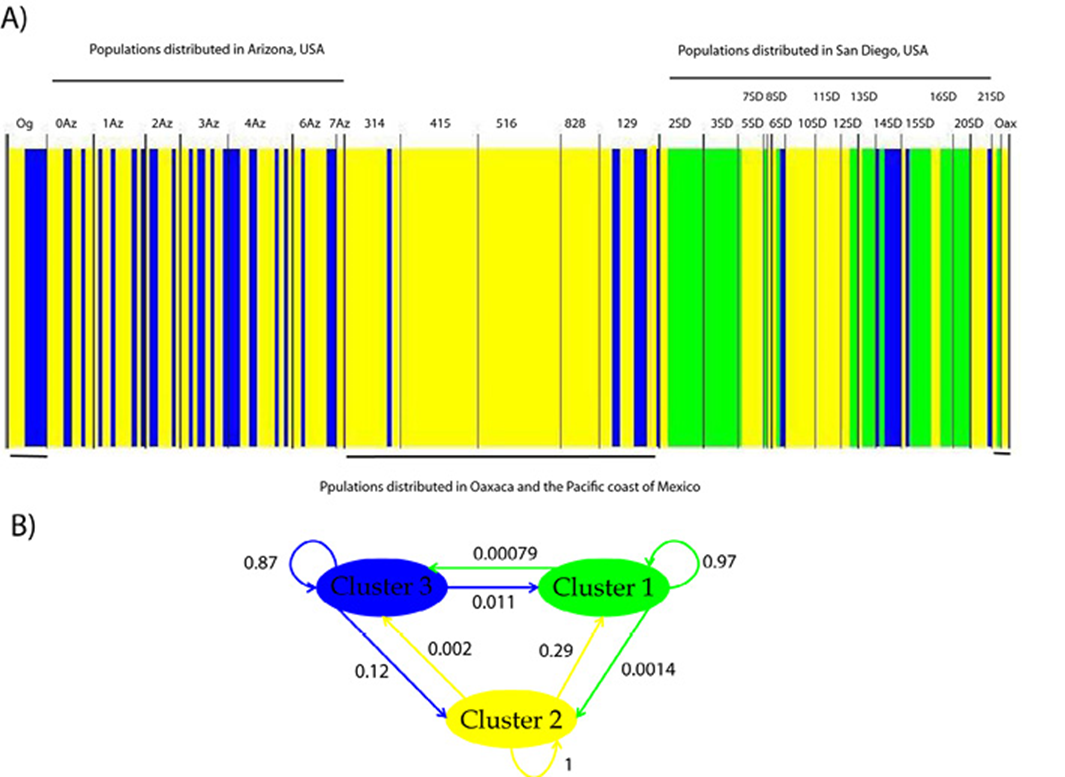
Figure 2 A) Population structure of Trichobaris compacta and B) genetic flow among clusters. Each color represents a genetic group determined by Bayesian clustering from COI gene (663 bp). The localities are described in Table 1. Gene flow is indicated as weighted arrows, such that the weights equal relative average among of ancestry in the source cluster, among the individuals assigned to the target cluster. The localities are described in Table 1.
Table 4 Results from SAMOVA analysis of Trichobaris compacta populations, using COI gene (663bp). K = arbitrary partition of the n populations into K groups, FCT = index of genetic variance due to differences among populations, p-value = probability values to accept the new structure.
| K | 1 | 2 | 3 | 4 | 5 |
|---|---|---|---|---|---|
| FCT | . | 0.21845 | 0.29099 | 0.25082 | 0.24094 |
| p-value | . | 0.02639+-0.00439 | 0.05083+-0.00800 | 0.01466+-0.00394 | 0.02151+-0.00491 |
| K | 6 | 7 | 8 | 9 | 10 |
| FCT | 0.22482 | 0.23485 | 0.21917 | 0.38133 | 0.37744 |
| p-value | 0.03128+-0.00620 | 0.04594+-0.00610 | 0.07820+-0.00897 | 0.00098+-0.00098 | 0.00000+-0.00000 |
| K | 11 | 12 | 13 | 14 | 15 |
| FCT | 0.3733 | 0.38933 | 0.34445 | 0.34587 | 0.36122 |
| p-value | 0.00000+-0.00000 | 0.00000+-0.00000 | 0.00000+-0.00000 | 0.00000+-0.00000 | 0.00000+-0.00000 |
| K | 16 | 17 | 18 | 19 | 20 |
| FCT | 0.35109 | 0.35171 | 0.36861 | 0.38472 | 0.36474 |
| p-value | 0.00000+-0.00000 | 0.00000+-0.00000 | 0.00000+-0.00000 | 0.00000+-0.00000 | 0.00000+-0.00000 |
The most frequent and shared haplotypes among populations were Co1 (52% of total sampling), Co26 (13%), Co33 (3%), and Co10 (3%) (Figs. 1, 3). From these, Co1 and Co10 were sampled in more than 1 host-plant species (D. wrightii, D. discolor, D. inoxia and D. pruinosa), while 7 haplotypes were found exclusively in D. discolor, 5 in D. reburra and 35 in D. wrightii.
Phylogenetic analysis of COI haplotypes did not support the formation of main clades into T. compacta (Fig. 4). Posterior probability values lower than 0.50 are not show in the phylogeny, only 3 clades with 2 or 3 haplotypes have support higher to 0.90.

Figure 3 Haplotype network of Trichobaris compacta calculated from COI gene (663 bp) by the “median joining” algorithm. Black dots represent vectors, and red numbers represent the number of mutational changes.
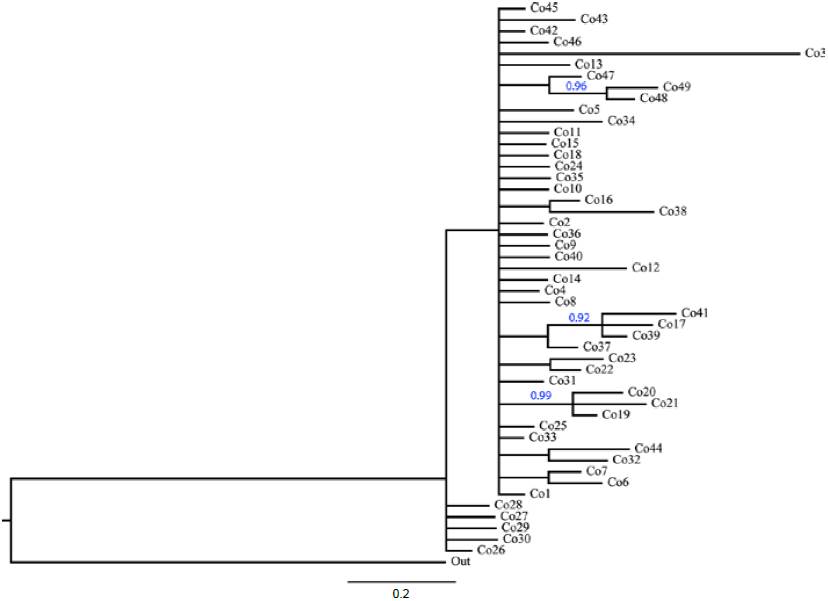
Figure 4 Phylogeny of COI haplotypes (663 bp) of Trichobaris compacta inferred by Bayesian inference analysis. Blue numbers show the posterior probability for clades (only values above 0.90 pp are showed). The length of the branches represents the divergence among haplotypes.
The haplotype network showed a star-like pattern indicative of a recent population expansion and congruent with both the mismatch distribution that displayed a unimodal pattern (Fig. 5) and with the negative values of Tajima’s D = -2.69330 (p < 0.001) and Fu and Li’s F = -5.10607 (p < 0.02).

Discussion
In general, the COI sequence of weevils shows high levels of genetic variation (from 0.973 to 0.75) allowing to discern different evolutionary lineages and population structure of this species (Anducho-Reyes et al., 2008; Aoki et al., 2008, 2009; Kuester et al., 2012; Ruiz et al., 2010). Here, we show that T. compacta have also higher level of genetic variation (h = 0.704) distributed mainly in the northern part of its distribution, USA, than in the south (Table 1; Fig. 1). Trichobaris soror, a weevil of the same genus but species-specific to a host plant and distributed on the highlands of Mexico, showed a similar level of genetic variation, h = 0.731 (De la Mora et al., 2015). Trichobaris compacta diverged from T. soror ca. 1.75 (± 1) million years ago, with a recent diversification ca. 0.5 (± 0.25) million years ago (De la Mora et al., 2018).
Neutral theory postulates that genetic diversity will increase with larger effective population sizes due to a decreasing effect of genetic drift (Kimura, 1983). According to the specialist-generalist variation hypothesis (SGVH), specialists are expected to have lower effective population sizes than generalists and consequently lower levels of genetic diversity due to the effect of drift (Li et al., 2014). This pattern may result from their specialization in resource use; for instance, the habitat of specialist species may be more heterogeneous and patchier than that of generalists and, as a consequence, populations of specialist species may be less connected and more subdivided into smaller populations than those of generalist species. Therefore, we expected that the generalist T. compacta, which uses several host-plant species to feed and reproduce, would have higher levels of genetic variation than a specialist weevil. However, although Trichobaris soror feeds only on D. stramonium, our estimate of genetic diversity does not differ between species of Trichobaris. Therefore, no support for this hypothesis was found. It is likely that since the host plant of T. soror (D. stramonium) is highly abundant but with a patchy distribution along the Trans-Mexican Volcanic Belt, this has promoted high genetic variation of similar magnitude to that of T. compacta. However, the role of trophic host specialization and the distribution pattern of both species of Trichobaris on their genetic variation remains to be tested.
Phylogenetic structure. The population genetic structure of T. compacta investigated with COI does not reflect a significant genetic clustering, since the same haplotype can be found from Arizona in the USA, to Oaxaca in central Mexico. As mentioned below, a slight influence of the Colorado River basin may be disrupting the genetic flow in T. compacta. It is a bit difficult to compare the compact phylogeographic pattern of T. compacta with other insects since phylogeographic studies are scarce, in spite that other insect species distribute in the same geographical range (Anderson & O’Brien, 1996). Unlike T. compacta, T. soror is distributed only along the Trans-Mexican Volcanic Belt and in the Sierra Madre del Sur (Barber, 1935). The phylogeographical pattern of T. soror follows a partition due to the mountain systems, similar to other beetles distributed on the same region (i.e., Dendroctonus mexicanus; Anducho-Reyes et al., 2008).
Other taxa distributed in North American warm deserts have revealed vicariant events among their populations distributed in this area (Bryson et al., 2012; Leache & Mulcahy, 2007; Mantooth et al., 2013), and the barriers to gene flow for this biota have been identified as the Central Valley, the Colorado River and floristic provinces. At the equatorial climate, along the western coast of Mexico, Neotropical biota have been greatly influenced by past events that have produced strong genetic differentiation within species (García-Trejo et al., 2004; Zarza et al., 2008). We expected that at least the genetic variation of T. compacta would reflect these discontinuities. However, the genetic groups do not correspond to either the desert typical barriers or to a disjunction between the desert and equatorial climates. The Colorado River system seems to have slightly influenced the population structure of T. compacta because of the different haplotypic compositions found at each side (Fig. 2). However, the results of BAPS and SAMOVA do not support this barrier and estimations of gene flow are needed to corroborate this. Both analyzes suggest the formation of 3 groups but these groups are not equivalent. In BAPS there is a widely distributed group (cluster2-yellow) that includes several populations from the north and mainly from the south of the distribution (Fig. 2). While the other 2 form some geographical structure to the north of the T. compact distribution, SD populations in San Diego (cluster 1-green) and AZ populations in Arizona (cluster 3-blue). In SAMOVA, the K = 3 populations were grouped as: group 1 (0Az, 10SD, 11SD, 12SD, 13SD, 15SD, 1Az, 20SD, 2Az, 2SD, 314, 3Az, 405, 4Az, 516, 5SD, 6Az, 8SD, AP, OG, 129) group 2 (19SD, 3SD) and group 3 (14SD). Although the SAMOVA results, in general, were not statistically significant (Table 4), K = 3 was the peak of F CT and was marginally significant. It is likely that T. compacta is broadly distributed over the Datura species that we report in Mexico and gene flow is maintained along their distribution; yet extensive sampling to delimit the distribution of T. compacta in all 5 Datura species is badly needed.
The distribution of haplotypes is not uniform in all Datura species (Fig. 1). The most frequent haplotype of T. compacta (Co1) was found on 4 species of Datura distributed in USA and Mexico. All other haplotypes were found in D. wrightii and D. discolor, but some low-frequency haplotypes were restricted to D. reburra, D. pruinosa and D. inoxia. The haplotype network shows few mutational steps among haplotypes, which suggests a recent divergence of the haplotypes, but none of these as previously reported is associated to particular Datura species (De la Mora et al., 2018; Fig. 3).
Because plant-herbivore interactions have largely been maintained since the last glacial period, variation in mtDNA results useful to infer clades association to particular host plants (Aoki et al., 2011). Like results reported in other weevil species with larval development inside the host plant tissues (Aoki et al., 2009; Barr et al., 2013), we expected to find the COI gene haplotypes of T. compacta linked to different Datura species and clustered together with high support by a phylogeny, but we did not find such a pattern (Figs. 4, 5). The neutral nature of COI variation, in relation to host plant use made by weevils, does not mean that T. compacta is not adapted to Datura species. We are unable to assess adaptation to the host plant directly (Barr et al., 2013; Morse & Farrell, 2005). If weevils were adapted to host plants, analysis of other loci that code for adaptive traits to host plants and behavioral experiments of oviposition would be necessary. Rather, we determined that the relationship between T. compacta and Datura species is not reflected by clustering of mtDNA lineages linked to particular host plant species. It is possible that T. compacta had recently dispersed to Datura host species until attaining its current distribution range, as suggested by both the star-like pattern of the haplotype network and the historical-demographic analysis.
In the insect-plant interaction study, the phylogenetic study of variation in the COI gene revealed that interacting species share patterns of neutral genetic variation because they have been exposed to the same environmental and geological conditions (Aoki et al., 2009, 2011). In this sense, this study constitutes one of the first steps to understand the coevolution of Trichobaris with Datura species.
Phylogeographic and phylogenetic analyses showed that T. compacta populations are slightly structured over a wide geographic distribution range. This genetic population structure is the result of the admixture of tree genetic groups, forming a single one genealogical lineage.

