


 nueva página del texto (beta)
 Inglés (pdf)
 Artículo en XML
 Referencias del artículo
 Enviar artículo por email
 Citado por SciELO
  Similares en
SciELO
Similares en
SciELO 
 Permalink
Introduction
The Chihuahuan Desert Region (CDR) encompasses the southwestern United States, the Central Mexican Highlands, and extends south to geographically and climatically disjunct fragments in the states of Querétaro and Hidalgo (Hernández & Gómez-Hinostrosa, 2005). This region has the highest diversity of Cactaceae both at the national and continental levels, with many species strictly endemic to this region, making it a hot spot of cactus diversity (Hernández & Bárcenas, 1995). The genus Thelocactus (K. Schum.) Britton & Rose, a small genus of globular cacti, is distributed from the southern disjunct fragments of the CDR in Querétaro and Hidalgo to Texas, with only 2 species occurring outside the CDR borders, T. bicolor ssp. schwarzii (Backeb.) N.P. Taylor in the Tamaulipan thorn shrub, and the newly described T. tepelmemensis T.J. Davis, H.M. Hern., G.D. Starr & Gómez-Hin. in open xerophytic scrub in northern Oaxaca. Thelocactus is made up of 12 or 14 species (Davis et al., 2018; Guzmán et al., 2007; Hunt et al., 2006; Mosco & Zanovello, 2000), the number depends on the inclusion or not of Hamatocactus setispinus (Engelm.) Britton & Rose in Thelocactus, and on the recognition of some taxa at species or subspecies rank. The distribution ranges are wide as is the case for T. bicolor, which is found from Texas to San Luis Potosí, small as for T. hastifer (Werderm. & Boed.) F.M. Knuth, or punctiform as for T. lausseri Říha & Busek, which is known only from the type locality. Small geographic range sizes are characteristic of rare, endemic cactus species, which are restricted to areas smaller than 10 km2, and represent nearly one-third of the Cactaceae from the Chihuahuan Desert Region (Hernández et al., 2010). The conservation status of some Thelocactus species is unsatisfactory, indeed T. hastifer, T. macdowellii (Rebut ex Quehl) W.T. Marshall, T. tulensis (Poselg.) Britton & Rose, plus some local populations recognized as subspecies, are listed as threatened in the NOM-059-Semarnat-2010, while in the IUCN Red List T. hastifer is listed as endangered. The main threats derive from land conversion, illegal collection, and residential development (Goettsch et al., 2015). While the impact of climate change is controversial, affecting negatively or positively the species distribution, the direction of the effect is species-specific (Carrillo-Ángeles et al., 2016; Martorell et al., 2015; Téllez-Valdés & Dávila-Aranda, 2003).
In recent years, species distribution studies have relied on modelling approaches based on powerful statistical techniques and GIS tools and have become popular to predict species distribution, forecast the impact of global climatic change, study species delimitation and niche changes in space or time (Guisan & Zimmermann, 2000; Pearman et al., 2008; Raxworthy et al., 2007). Niche modeling techniques, of which MaxEnt is the most popular presence-only method, use scenopoietic variables combined to occurrence data to predict the potential geographic distribution and estimate the fundamental niche in the ecological space of the focal species (Elith et al., 2010; Soberón & Peterson, 2005).
Cacti characterize the landscape of Mexican arid lands and are a significative component of Mexican flora with 68 genera and 689 species (Guzmán et al., 2007). Cacti are an important resource, the fruits are consumed fresh or dried, and the stems are a common food for humans or used as fodder for animals (Casas & Barbera, 2002). Although Mexican Cactaceae have a relevant economic and ornamental value, and several studies have analyzed their geographical distribution patterns and endemicity (Godínez-Alvarez & Ortega-Báes, 2007; Gómez-Hinostrosa & Hernández, 2000; Hernández & Bárcenas, 1995, 1996; Hernández et al., 2007, 2010), the knowledge of the environmental factors constraining their distribution and characterizing their fundamental niche is still rather limited, being available only few studies (Carrillo-Ángeles et al., 2016; Godínez-Alvarez & Ortega-Báes, 2007; Ibarra- Díaz Velarde et al., 2016). Cactus richness and endemism in each Mexican state are significantly related to the degree of aridity (Godínez-Alvarez & Ortega-Baes, 2007), a long-term climatic phenomenon, which depends on precipitation, potential evapotranspiration rate, temperature and precipitation seasonality (Maliva & Missimer, 2012), which are the main climatic factors limiting cactus distribution in the Chihuahuan Desert (Hernández & Bárcenas, 1995). Niche modeling has shown that temperature has the greater influence on the distribution of 4 cactus species in Chihuahua (Cortés et al., 2014), while temperature and precipitation are the main environmental variables constraining distribution of species in the genus Astrophytum Lem. (Carrillo-Ángeles et al., 2016). Temperature influence on cactus distribution can be explained by the low degree of tolerance to freezing temperatures and to the detrimental effect of high temperatures on photosynthetic performance (Aragón-Gastélum et al., 2014; Flores & Yeaton, 2003).
This study was aimed at defining the ecological niche of Thelocactus species and at quantifying the similarities between them using environmental niche models (ENM) and ordination techniques. Climatic and environmental variables constraining the range of each species were identified and used to generate potential distribution maps. The constructed ENMs were compared to assess the similarities of the ecological niche of the Thelocactus species and to know if they share the same ecological niche space.
Materials and methods
The nomenclature used is that of Mosco and Zanovello (2000), and 9 Thelocactus species were included in this study (Table 1). Thelocactus macdowellii and T. lausseri were excluded because very few populations were available for the analysis, indeed T. lausseri is known only from the type locality, while the locality data for T. macdowellii were too scanty. Occurrence data were obtained from the large dataset build up for the project of mapping Mexican Cactaceae (Hernández & Gómez-Hinostrosa, 2011b), from referenced records by Sánchez at the Jardín Botánico Regional de Cadereyta (http://www.concyteq.edu.mx/JB/inicio.html), from field observations by Jauernig and the author, from the book Thelocactus by Matuszewski and Hinz (2011), and from publicly available datasets (http://www.cl-cactus.com). The database used for this study is available upon request.
Since the small number of records available for T. hastifer and T. multicephalus Halda & Panar. ex Halda, the number of predictors was set to 10 to avoid over-parameterisation (Harrell et al., 1984). To avoid multicollinearity, a Pearson correlation test was made using the 19 climatic variables from WorldClim (Hijmans et al., 2005). Retained variables were those with a pairwise Pearson’s correlation coefficient ≤ 0.7 (Dormann et al., 2013), precisely precipitation seasonality, precipitation of driest quarter, precipitation of wettest quarter, isothermality, temperature annual range, temperature max warmest month, temperature min coldest month, mean diurnal range. To increase proximity we included precipitation of driest quarter, precipitation of wettest quarter, and the minimum temperature of coldest month. This choice was based on the fact that most cacti occupy frost-free areas of low rainfall precipitation (Hernández & Bárcenas, 1995).
The STRM (Shuttle Radar Topography Mission) elevation database aggregated to 30 arc-seconds was the source of digital elevation model (DEM) data (Hijmans et al., 2005). Topographic variables, aspect and terrain ruggedness index, were derived from the DEM model using QGIS 2.8.2 software (https://www.qgis.org). Aspect shows the compass bearing of the physical slopes, while the terrain ruggedness index is a quantitative measurement of terrain heterogeneity and was calculated from the DEM according to Riley et al. (1999).
The study area was confined between 30° N, 107° W and 19° N, 97° W, which represents roughly the distribution limits of the genus. To predict the geographical distribution of Thelocactus taxa, models for each species were constructed by means of the program Maxent (Phillips & Dudík, 2008) using the retained 8 climatic factors plus topographic variables. Maxent is a machine learning method, which performs well when dealing with presence-only data (Elith et al., 2006), even with small datasets (Hernández et al., 2006; Wisz et al., 2008). Maxent was run using its default settings with the number of replicates set to 20. Model performance was evaluated testing the area under curve (AUC) value of the species distribution model (SDM) against a null distribution of 100 repetitions generated by randomly selecting the sample localities from the same geographical space of the studied species (Raes & ter Steege, 2007).
Niche breadth was estimated using ENMTools 1.4.4 (Warren et al., 2010) applying the inverse concentration metrics from Levine to the predictions generated by Maxent for each species (Nakazato et al., 2010). Niche overlap in ecological space was quantified using an ordination technique that applies kernel smoothers to species densities which ensure that the measured overlap is independent of space resolution (Broennimann et al., 2011). The metric D was used to calculate niche overlap that can vary from 0, indicating no overlap, to 1, indicating complete overlap (Warren et al., 2008).
Niche similarity and equivalency tests were conducted in ecological space using the framework by Broennimann et al. (2011), following the methodology described in Warren et al. (2008). The niche equivalency test was performed to assess whether the ecological niches of Thelocactus species are identical. For each species pair, the observed D was compared to a null distribution generated by 100 pseudoreplicate datasets. The hypothesis of niche equivalency was rejected when observed values of D were significantly (p < 0.05) lower than the simulated values. To address whether 2 environmental niches are more similar than expected by chance, a niche similarity test, based on 100 repetitions, was used. Niche similarity was considered significant when D values fell outside the 95% confidence limit of the simulated values.
Results
Environmental variables contributed to the final Maxent models of predicted suitability with varying percentages, that were derived from the permutation importance analysis from Maxent. The potential distribution of Thelocactus species depended mostly on the combination of 2 climatic factors: isothermality and precipitation of wettest quarter. But also, other climatic variables such as precipitation of driest quarter, the temperature of warmest month, and the minimum temperature of the coldest month, contributed to a high degree to define the habitat suitability of specific taxa (Figs. 1, 2; Table 1).
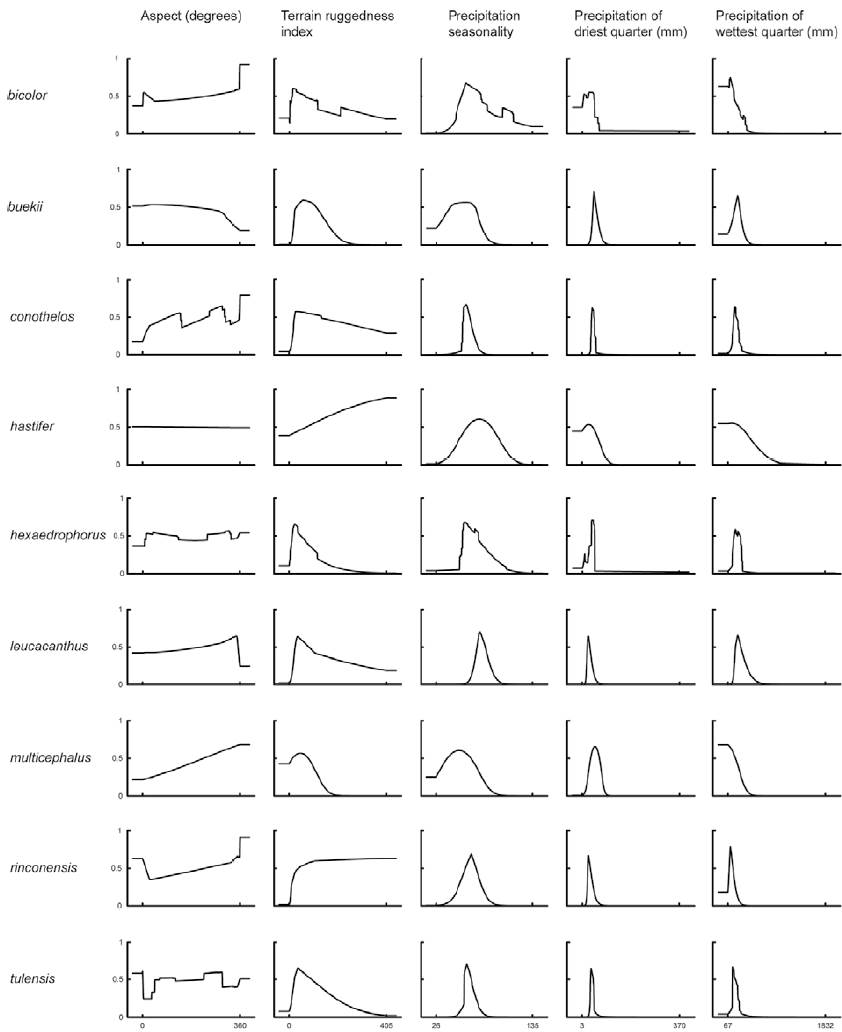
Figure 1. Response curves of Maxent models obtained from topographic variables and precipitation factors for Thelocactus species. Models were generated using only one variable at a time. The curves show the mean response of the cross-validated models with 20 replicate runs. The value shown on the y-axis is predicted probability of presence.

Figure 2. Response curves of Maxent models obtained from temperature factors for Thelocactus species. Models were generated using only one variable at a time. The curves show the mean response of the cross-validated models with 20 replicate runs. The value shown on the y-axis is predicted probability of presence.
Table 1 Permutation importance of environmental variables to the final Maxent model for Thelocactus species.
| Variable | bicolor | buekii | conothelos | hastifer | hexaedrophorus | leucacanthus | multicephalus | rinconensis | tulensis |
| Mean diurnal range |
2.4 | 1.8 | 2.5 | 0 | 0.1 | 0.5 | 1.7 | 0.4 | 5.6 |
| Isothermality | 39 | 0.8 | 1.6 | 77.8 | 66 | 66 | 33 | 9.8 | 54.4 |
| Max temperature of warmest month |
1.9 | 18.8 | 1.7 | 0 | 0.8 | 0.4 | 0 | 0.2 | 1.7 |
| Min temperature of coldest month |
12.9 | 7.6 | 0.9 | 6.1 | 5.4 | 5.9 | 24 | 5.4 | 3.6 |
| Temperature annual range |
1.5 | 0 | 3.2 | 0.3 | 3.1 | 0 | 1.2 | 15.9 | 0.4 |
| Precipitation seasonality |
5.3 | 0 | 8.4 | 0.3 | 1.9 | 17.9 | 8.6 | 0.8 | 1 |
| Precipitation of wettest quarter |
33.1 | 36.6 | 18.8 | 6.1 | 17 | 3.8 | 17.2 | 58.4 | 22.6 |
| Precipitation of driest quarter | 1 | 31.4 | 61.2 | 1.1 | 3.3 | 4 | 6 | 5.6 | 9.6 |
| Aspect | 0.4 | 0.3 | 0 | 0.2 | 0.2 | 0.1 | 1 | 0.6 | 0.2 |
| Terrain ruggedness index |
2.5 | 2.7 | 1.7 | 3.1 | 2.2 | 1.4 | 7.4 | 3 | 0.9 |
The permutation importance represents the drop in training AUC, after the values of the focal variable on training presence and background data are randomly permuted and the model is reevaluated on the permuted data. Permutation values are normalised to percentages.
For every taxon, species distribution models were computed running Maxent. All SDMs, even those generated from few presence records as was the case for Thelocactus hastifer and T. multicephalus, performed significantly better than expected by chance (p < 0.001) (Table 2).
Table 2 Evaluation of Thelocactus species distribution models by their AUC values, null model results, and niche breadth values.
| Species | Occurrences | Auc | Null model auc | Niche breadth |
| bicolor | 213 | 0.908 | 0.719 | 0.282 |
| buekii | 50 | 0.992 | 0.797 | 0.030 |
| conothelos | 119 | 0.988 | 0.786 | 0.025 |
| hastifer | 11 | 0.969 | 0.847 | 0.178 |
| hexaedrophorus | 195 | 0.965 | 0.738 | 0.099 |
| leucacanthus | 73 | 0.982 | 0.751 | 0.050 |
| multicephalus | 13 | 0.989 | 0.823 | 0.100 |
| rinconensis | 47 | 0.978 | 0.792 | 0.062 |
| tulensis | 117 | 0.991 | 0.791 | 0.020 |
SDMs were tested against a null-model, performing significantly better than expected by chance as their AUC values are higher than the highest value of the null model AUC. Niche breadth was estimated applying the inverse concentration metrics from Levine to the predictions generated by Maxent.
Most Thelocactus species are distributed and have the highest environmental suitability west of the Sierra Madre Oriental (Fig. 3). The predicted suitable areas match well the known distribution of almost all Thelocactus species, with the exception of T. hastifer, which has a very small geographic distribution, but a much broader suitable area (Fig. 4).
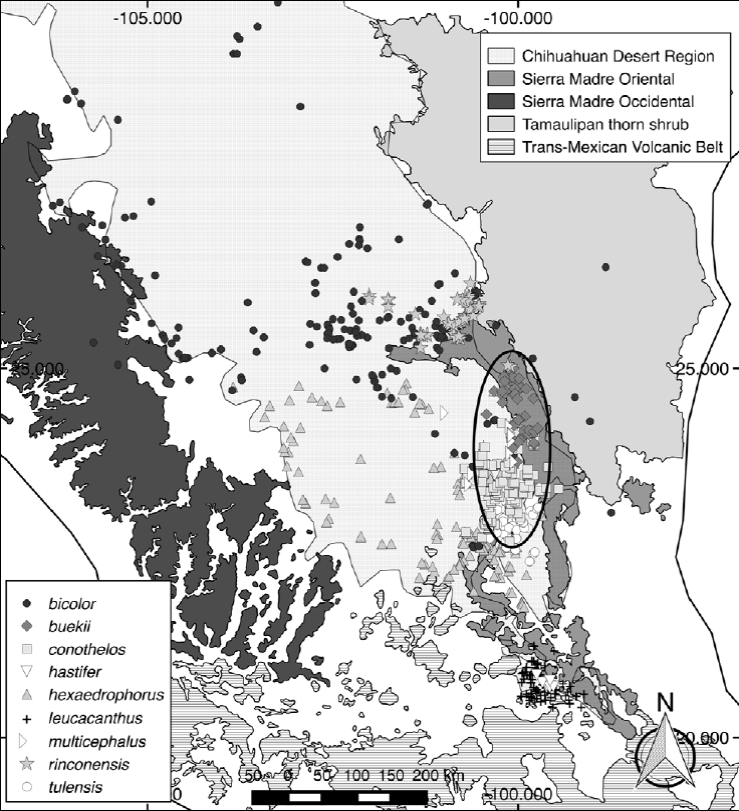
Figure 3. Distribution map of the 9 Thelocactus species considered in this study. Symbols represent species occurrences. The ellipse circumscribes the Galeana, Mier y Noriega and Huizache subregions of the Chihuahuan Desert Region, which host the largest number of Thelocactus species. The delimitation of the Chihuahuan Desert Region is based on Hernández et al. (2004). The boundaries of the Sierra Madre Oriental, Sierra Madre Occidental, Trans-Mexican volcanic belt, and Tamaulipan thorn shrub were obtained from The Nature Conservancy spatial data of terrestrial ecoregions (http://maps.tnc.org/gis_data.html).
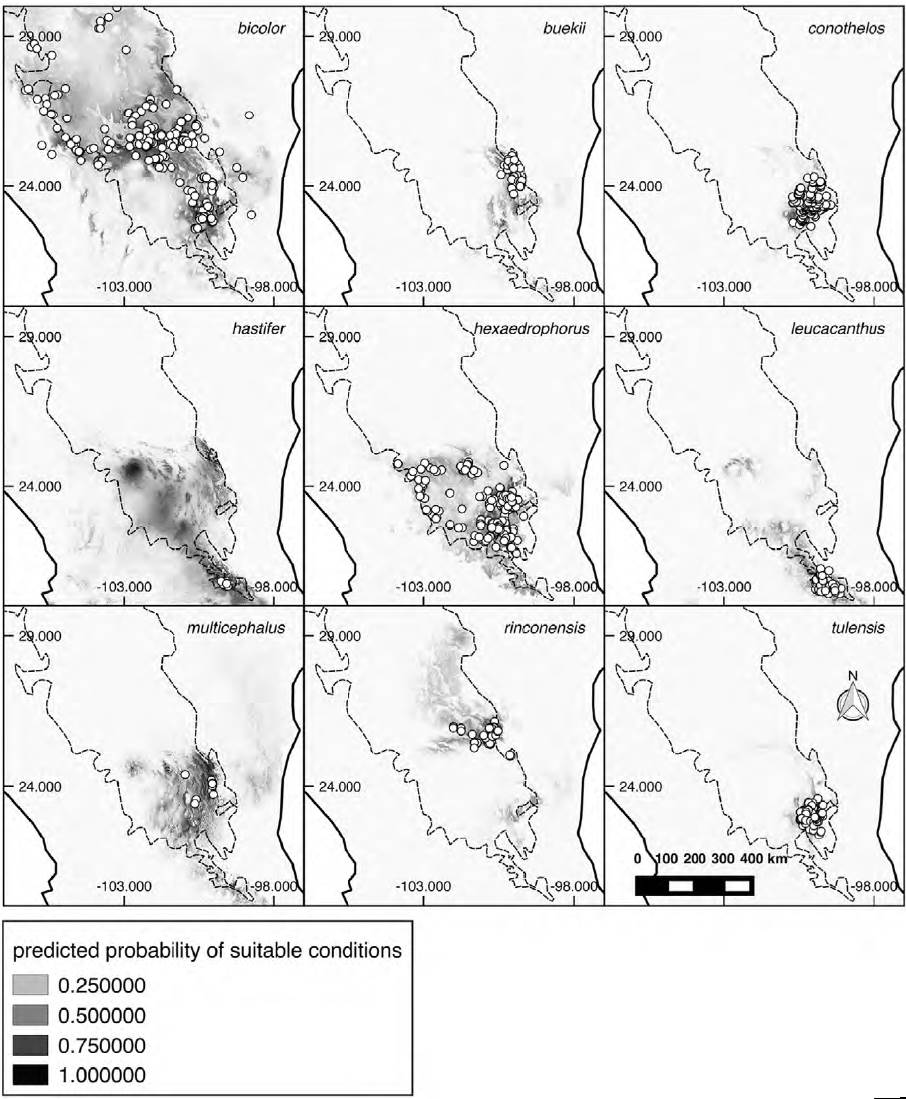
Figure 4. Potential distribution maps of the 9 Thelocactus species considered in this study. White dots represent species occurrences. Maps show the point-wise mean of twenty output grids. Darker shades indicate areas with higher habitat suitability. Dashed line delimits the Chihuahuan Desert Region based on Hernández et al. (2004).
Principal component analysis of environmental niches showed that the first axis explained 34.5% of the total variation, and was mainly loaded by isothermality, the maximum temperature of warmest month, and precipitation seasonality. The second axis explained 27.47% of the variation and was loaded by mean diurnal temperature range and the minimum temperature of coldest month (Fig. 5).

Figure 5. Ecological niche of Thelocactus species in environmental space. Niche was displayed in the 2 main axes of principal component analysis. Grey-to-black shading represents grid cell density of species’ occurrences (black being the highest density). The first dashed line represents the 50% of the available environment and the solid line represents the 100%. The last panel presents the contribution of variables for loading the main PCA-env axes and the percentage of inertia explained by axes 1 and 2.
Niche breadth values varied quite a lot, reflecting the diverse environmental requirements of the studied species (Table 2). Thelocactus bicolor presented the broadest niche breadth, 10 times greater than the niche breadth estimated for T. buekii (Klein) Britton & Rose, T. conothelos (Regel & Klein) F.M. Knuth, T. tulensis, which agrees with its extensive geographic distribution. Thelocactus hexaedrophorus (Lem.) Britton & Rose, which has a broad range, also exhibited a wide niche breadth, although smaller than T. bicolor. Another species with a wide niche breadth is T. multicephalus, which is proportional to the suitability range and contrasting with the limited known geographic distribution. A case apart is T. hastifer, a species known from a very restricted area of about 75-100 km2, but with a broad niche breadth, which agrees with the large predicted area of suitability. Niche overlap values are quite variable, ranging from very low values as for T. leucacanthus (Zucc. ex Pfeiff.) Britton & Rose and T. hastifer when compared to the other species, indicating that their environmental niches are very different, to higher scores resulting in a partial niche overlap (Table 3).
Table 3 Niche overlap values (D) and number of localities where 2 Thelocactus species coexist.
| n | bicolor | buekii | conothelos | hastifer | hexaedrophorus | leucacanthus | multicephalus | rinconensis | tulensis | |
| bicolor | 213 | X | 1 | 5 | 0 | 4 | 0 | 1 | 0 | 9 |
| buekii | 50 | 0.223 | X | 3 | 0 | 0 | 0 | 2 | 0 | 0 |
| conothelos | 119 | 0.203 | 0.539 | X | 0 | 25 | 0 | 2 | 0 | 20 |
| hastifer | 11 | 0.056 | 0.158 | 0.193 | X | 0 | 5 | 0 | 0 | 0 |
| hexaedrophorus | 195 | 0.347 | 0.508 | 0.637 | 0.192 | X | 0 | 0 | 0 | 15 |
| leucacanthus | 73 | 0.068 | 0.177 | 0.254 | 0.626 | 0.257 | X | 0 | 0 | 0 |
| multicephalus | 13 | 0.168 | 0.335 | 0.654 | 0.115 | 0.516 | 0.158 | X | 0 | 0 |
| rinconensis | 47 | 0.412 | 0.367 | 0.192 | 0.048 | 0.334 | 0.050 | 0.090 | X | 0 |
| tulensis | 117 | 0.231 | 0.479 | 0.546 | 0.108 | 0.580 | 0.116 | 0.447 | 0.301 | X |
n represents the number of occurrences. In the upper part are displayed the number of localities where 2 species are sympatric. In the lower part are displayed the niche overlap values (D), that can vary from 0, indicating no overlap, to 1, indicating complete overlap.
The null hypothesis of the niche equivalency test was rejected for all paired comparisons between all Thelocactus species except between the pair T. leucacanthus-T. hastifer. Instead, the results of the niche similarity test were varied. The null hypothesis of niche similarity was rejected for the comparisons between T. leucacanthus, T. hastifer and all the other species, as well as for the pairs T. bicolor-T. multicephalus, T. multicephalus-T. rinconensis (Poselg.) Britton & Rose, T. rinconensis-T. conothelos, and T. rinconensis-T. tulensis. Niche similarity was higher than expected by chance for all other Thelocactus species, but for some species pairs niche spaces were more similar than expected only in one direction (Table 4).
Table 4 Comparisons of niche similarity tests. Rows identify the first Thelocactus species of the pairing, columns the second.
| bicolor | buekii | conothelos | hastifer | hexaedrophorus | leucacanthus | multicephalus | rinconensis | tulensis | |
| bicolor | X | similar | similar | not significative | similar | not significative | not significative | similar | similar |
| buekii | not significative | X | similar | not significative | similar | not significative | similar | similar | similar |
| conothelos | not significative | similar | X | not significative | similar | not significative | similar | not significative | similar |
| hastifer | not significative | not significative | not significative | X | not significative | not significative | not significative | not significative | not significative |
| hexaedrophorus | not significative | similar | similar | not significative | X | not significative | similar | similar | similar |
| leucacanthus | not significative | not significative | not significative | similar | not significative | X | not significative | not significative | not significative |
| multicephalus | not significative | similar | similar | not significative | similar | not significative | X | not significative | similar |
| rinconensis | similar | similar | not significative | not significative | not significative | not significative | not significative | X | not significative |
| tulensis | similar | similar | similar | not significative | similar | not significative | similar | not significative | X |
Niche spaces were similar or similar only in one direction for some species pairs, while for others the hypothesis of niche similarity was rejected. The significance level for the similarity test was 0.05.
Discussion
Thelocactus species are endemic to the CDR, and are found from the eastern borders of the Sierra Madre Occidental to the west to the intermontane valleys of the Sierra Madre Oriental eastward, where typical floristic elements of the CDR are present. Their range extends also southward into disjunct fragments of the CDR, T. bicolor and T. tepelmemensis can be found out of the CDR borders. On a larger scale cactus species richness and endemism in Mexico are mainly related to aridity, while temperature and precipitation alone explain a lower proportion of variance in endemic species (Godínez-Álvarez & Ortega-Báes, 2007). The more detailed analysis of this study shows that the climatic constraints determining the distribution of Thelocactus species are more varied.
The variable constraining almost all species is the amount of precipitation in the wettest quarter (Table 1). Most cacti occupy areas with dry, semi-hot or semi-dry climates with mean annual precipitations of 300-600 mm, and to a lesser extent drier areas with less than 300 mm per year (Hernández & Bárcenas, 1995). Thelocactus species are no exception, occupying areas of low rainfall with a precipitation range that corresponds to that of the response curve of highest probability of suitable conditions generated by Maxent for the precipitation of the wettest quarter. For 2 species, T. buekii and T. conothelos, the precipitation of the driest quarter is also important to determine their suitability area, both being more likely to be found in areas with higher rainfall in the driest quarter. The results of my study corroborate the findings of Godínez-Alvarez and Ortega-Baes (2007), who proposed that aridity is the main factor explaining cactus richness and endemism, but other climatic factors contribute to shape niches leading to the niche differences found between Thelocactus species. African succulents, milkweeds (Apocynaceae), spurges (Euphorbiaceae) and ice-plants (Aizoaceae), are also restricted to arid regions, and have a globular morphology similar to globose Mexican cacti, that has been illustrated as convergent evolution for years with a hypothesised convergence in environmental requirements (Alvarado-Cárdenas et al., 2013). In a comparison of environmental spaces between analogous succulent plants of North America and Africa the equivalency test showed significant differences between niches, suggesting that the areas occupied by Mexican cacti and African succulents have different climates. Nevertheless, these areas are similar, as proven by the similarity test, because they are drylands, but they substantially differ in precipitation and temperature regimes, which suggests that aridity alone is not sufficient to delimit a species niche (Alvarado-Cárdenas et al., 2013).
The second factor shared by 7 out of 9 species is isothermality, which quantifies how large the daily temperature fluctuations are relative to annual oscillations (Table 1). A value of 100 indicates that diurnal temperature range is the same as the annual temperature range, while lower values indicate that day to night temperature oscillations are smaller than annual temperature fluctuations. The importance of isothermality for shaping Thelocactus distribution is in line with the results obtained by Yu et al. (2017) for Rhododendron L. and with those of endemic species of the Colorado Plateau for which isothermality and precipitation of driest month are the main controlling factors (Krause & Pennington, 2012). Cacti are constitutive CAM plants, the stomata remaining closed during the day to reduce evapotranspiration. While moderate day/night temperatures favour highest rates of CO2 uptake, extremes in day/night temperatures reduce CO2 uptake (Nobel, 1986). This could explain the importance of temperature fluctuations for shaping the distribution of Thelocactus species.
The prediction importance of the minimum temperature of the coldest month for the Maxent model is marginal for most Thelocactus species, with the exception of T. bicolor and T. multicephalus (Table 1). The response curve of the minimum temperature of the coldest month for T. bicolor shows that there is a predicted probability of suitable conditions, though very low, at sub-zero temperatures (Fig. 2). Indeed, T. bicolor ssp. flavidispinus (Backeb.) N.P. Taylor is found in Marathon Basin (Brewster Co., Texas) where winter temperatures can drop below 0 °C (https://www.usclimatedata.com/climate/marathon/texas/united-states/ustx0828). This is the only species that has a geographic distribution extending northward where freezing temperatures are common, which broadens its range to areas unsuitable to most Thelocactus species. Though not growing in areas exposed to frost, the minimum temperature of coldest month is an important variable for modelling the distribution of T. multicephalus, which suggests that this climatic variable is relevant for its optimal growing conditions.
Temperature is a limiting factor also for T. buekii, but for this species it is important the maximum temperature of the warmest month (Table 1) with predicted suitable areas having maximum temperatures mostly under 30 °C. This reflects the findings for many populations in areas with an arid or semiarid temperate climate with the mean of the maximum temperature of the hottest month not exceeding 22 °C (http://www.inegi.org.mx/geo/contenidos/recnat/clima/default.aspx).
The potential distribution for Thelocactus species obtained from ENMs coincides with the known distribution of most species, suggesting that their distribution is mainly influenced by climatic factors. On the contrary, the potential distribution for T. hastifer is much wider than its known distribution. This species is found in a very restricted area of about 75-100 km2 at 1,800-2,000 m with a preference for sedimentary substrates (Sánchez et al., 2006), and its expansion is limited to the south by igneous soils and to the north by the high elevations of the Sierra del Doctor in Querétaro (Sánchez et al., 2006). Although it has not been reported from areas north of the Sierra del Doctor, suitable areas are predicted by ENMs to the north and south of the actual distribution. It may well be that more investigation in the most suitable areas could lead to the discovery of other populations. Indeed, another species growing in the same area of T. hastifer, Echinocactus grusonii Hildm., was nearly extinct in the wild after a dam construction led to the loss of its habitat, and only recently a population was found further north in Zacatecas (Martínez et al., 2013).
The suite of environmental conditions or resources that a species can inhabit, or use describes its niche breadth (Gaston et al., 1997), the larger the niche breadth the wider the environment spectrum a species utilizes. Thelocactus bicolor has the broadest niche breadth as well as the largest distribution range and therefore is tolerant of a wider spectrum of climatic conditions that promoted a large morphological variation among local populations, some of them being recognized at subspecific level. At the northern border of the Chihuahuan Desert, we find T. bicolor ssp. flavidispinus, which is endemic to Caballos Novaculite outcrops in Brewster Co., Texas. In Coahuila, T. bicolor ssp. bolaensis (Runge) Doweld, an ecotype with white spines, colonizes the limestone slopes of the Sierra Bola. To the west, in Zacatecas and Durango T. bicolor ssp. heterochromus (F.A.C. Weber) Mosco & Zanovello is found, while at the eastern range of the species distribution we find T. bicolor ssp. schwarzii, in Tamaulipas, on rocky outcrops in the Tamaulipan thorn shrub. The second widest niche breadth is that of T. hastifer, which agrees with its large potential distribution range, but contrasts with its very restricted geographical range. This discrepancy can be explained by the tendency of Maxent to over-estimate the probability occurrence in unsampled areas beyond the coverage of the data (Fitzpatrick et al., 2013), although was shown that Maxent performs well also with small sample sizes (Hernández et al., 2006; Wisz et al., 2008), or be caused by factors different from climatic predictors and as such missing from the model like soil type, or local geographic features (Nakazato et al., 2010). A wide distribution area, a large niche breadth, and the occurrence in habitats characterized by different environmental variables suggest that T. bicolor could be considered a generalist at species level (Dennis et al., 2011; Kassen, 2002), but the local populations that have been formally recognized at subspecific level are restricted geographycally and/or ecologically, and therefore can be regarded as specialists. Compared to T. bicolor, the other Thelocactus species have smaller niche breadths and, with the exception of T. hexaedrophorus, also smaller geographical ranges, the occupancy areas varying between 4,300 km2 for T. tulensis and 3.1 km2 for T. hastifer (Hernández et al., 2010). Smaller niche breadths indicate that they are less tolerant toward a wide spectrum of climatic variation, preferring narrower climatic conditions, therefore are more specialized compared to T. bicolor.
Niche overlap values between Thelocactus species are mostly low, reflecting the difference in the environmental suits each species is adapted to. Except for the pair hastifer-leucacanthus, the niche equivalency test was rejected for all other species, showing that environmental spaces of Thelocactus species are significantly different from each other (Warren et al., 2010).
The results of the niche similarity tests were quite varied, for some species pairs the niche similarities were higher than expected by chance, for others the null hypothesis was rejected, while in other species the significant results of the similarity test in only one direction, and not significant in the counter-direction, probably depend on the differences in the environmental background for the species pairs (Table 4) (Nakazato et al., 2010).
The niches of the pair T. hastifer and T. leucacanthus were more similar than expected by chance, which was expected as their niches are equivalent, while when compared to the other species the similarity was not significative. Considering that these 2 species have also an overlapping geographical distribution, the obtained results support the hypothesis of niche conservatism.
Niche similarity higher than expected by chance was also found in most of the other pair-wise comparisons, suggesting that habitat conservatism is common among Thelocactus species. Thelocactus bicolor has the widest niche breadth, therefore being capable to exploit a larger set of environmental conditions, which is in agreement with its large geographic distribution that overlaps with the range of most species, with the exclusion of the 2 southernmost, which is probably the explanation for the similarity test being significantly more similar when compared to the other species (Table 4). The reverse was not always true. For T. buekii, T. conothelos, and T. hexaedrophorus the results were not significantly similar, suggesting that these species are not suited to the habitat conditions in which T. bicolor can grow. For what concerns T. rinconensis, the similarity test was rejected when paired to T. hexaedrophorus, but the reverse comparison showed that the similarity test was accepted. These results suggest that T. rinconensis has rather different environmental requirements of T. hexaedrophorus, which exploits a more heterogeneous habitat and therefore its niche overlaps that of T. rinconensis. Five species, T. buekii, T. conothelos, T. hexaedrophorus, T. multicephalus, and T. tulensis, showed a similarity greater than expected by chance. All of them are geographically distributed in part or only in the Galeana, Mier y Noriega, and Huizache subregions of the CDR (Hernández & Bárcenas, 1996), areas rich in species number and endemicity of cacti, whose diversification is related to increased aridity in response to the uplift of the Sierra Madre Oriental and the development of the Trans-Mexican Volcanic Belt (Vázquez-Sánchez et al., 2013) in the late Miocene (Arakaki et al., 2011; Hernández-Hernández et al., 2014). Pleistocene glacial maximum (Wisconsin, 11,000 years ago) brought a cooler and wetter climate affecting the areas occupied by desert communities. Climate fluctuations driven by advances and retreats of the Laurentide Continental Glacier promoted contractions, retractions and displacements of the geographic range of the species involved (Cartron et al., 2005).
It has been shown that niche conservatism can be traced back to Late Pliocene Maximum, for example when the distribution range of Schiffornis turdina Wied-Neuwied fragmented in many areas that correspond to possible Pleistocene refugia (Martínez-Meyer & Peterson, 2006; Peterson & Nyári, 2008). Significant ecological niche conservatism is also found for most Thelocactus species pairs, although the observed geographic ranges of Thelocactus species rarely overlap, and then mostly partially, and that species distribution is mainly allopatric. This result indicates that many Thelocactus species have conserved their ecological niche traits over time (Wiens et al., 2010), corroborating the hypothesis that the richest areas in cactus taxa in the CDR acted as glacial refugia, leading to isolation and species diversification as well as shaping actual cactus distribution (Gómez-Hinostrosa & Hernández, 2000; Hernández & Bárcenas, 1995).
Cacti are the fifth most threatened major taxonomic group with 31% of species threatened (Goettsch et al., 2015). Land conversion to agriculture affects large parts of cactus species in Northern Mexico, while the unscrupulous collection of plants and seeds is the main risk factor for threatened cacti (Goettsch et al., 2015). Nevertheless, future climate change may play an important role in redesigning distribution ranges of current populations, in the worst case leading to extinction (Martorell et al., 2015; Téllez-Valdés & Dávila-Aranda, 2003). Projected climates for the following years show an increase of the mean annual temperature by 1.5 °C in the decade around 2030 and a decrease in precipitation, with an expansion of the arid zones of north-central Mexico toward both coasts and south-east (Sáenz-Romero et al., 2010). Although in general cacti should benefit from an increase in CO2 concentration and temperature rise, extending their poleward and elevation ranges, the impact of climate change should be determined at the specific level (Nobel, 1996). Indeed, niche projections for future climate show that species would respond in specific ways, the predicted distribution areas varying from remaining stable to undergoing a severe contraction (Aragón-Gastélum et al., 2014; Carrillo-Ángeles et al., 2016; Cortés et al., 2014). However, the potential distribution areas may not match potentially colonizable areas, the process being limited by several factors as seed dispersal efficiency, spatial barriers and unconnected distribution areas as observed for Thelocactus hastifer. The fruits in Thelocactus species are small, not juicy, dehiscing by a basal pore through which seeds are released, falling on the ground (personal observation, Hunt et al., 2006). The seed-dispersal mechanism for Thelocactus species is unknown, but it can be hypothesized the involvement of more than one dispersal mode, e.g. ants, wind, or water, with the exclusion of mammals and birds due to the lack of a fleshy fruit. Fallen seeds could be harvested by ants that are efficient post-dispersal seed removals (Luna & Dáttilo, 2018), but this dispersion mode does not allow for great dispersal distances as ants disperse seeds < 1 m (Cain et al., 1998). Many plant species have limited seed-dispersal capabilities, and the dispersion rate is so slow that no documented mechanism can explain their present geographical range since Pleistocene Glacial Maximum, suggesting the involvement of occasional long-distance dispersal events like tornados, hurricanes, or mud clinging to the feet of vertebrates (Cain et al., 1998). This hypothesis could explain how T. bicolor and T. hexaedrophorus have reached their actual geographical range that span north-south for about 800 km and 300 km, respectively.
The Chihuahuan Desert hosts several protected areas, both at federal and state level, and most Thelocactus species can be found in some of them, although the percentage of localities occurring in protected areas is generally low (Hernández & Gómez-Hinostrosa, 2011a). The situation is worse for microendemic taxa that occur in very small areas, e.g. some T. bicolor and T. conothelos subspecies and T. hastifer, which do not occur in any protected area and for which the creation of small reserve areas was already proposed in view of its efficacy and as a complement to largest protected areas (Fos et al., 2017; Hernández & Gómez-Hinostrosa, 2011a). SDMs are the main tool to predict species distributions based on environmental suitability, and are very effective to render spatial models from sparse observations available from biological surveys and natural history collections (Franklin, 2010). They have the potential to support conservation actions and contribute to the decision-making process. SDMs may be used to identify and protect critical habitats that are necessary for the persistence of threatened species; to select areas for the establishment of reserves; to identify suitable sites for reintroduction or translocation as an aid to lessen the threat of climate changes or the impact of change of land use (Guisan et al., 2013).
Most Thelocactus species can be considered vulnerable to global warming as a result of many factors like a low seed dispersal efficiency, a limited plant recruitment caused by seedling sensitivity to high temperatures (Aragón-Gastélum et al., 2016), a direct effect on their physiology (Nobel, 1996), or a change in the biotic interactions, as climate change could affect also the presence of pollinators and the animals required for seed dispersal or have an effect on the vegetation community and the nurse plants belonging to it (Ibisch & Mutke, 2015). The necessity of increasing protected areas in the CDR has been already underlined and the results presented in this study could be relevant for improving preservation actions and guiding reintroduction programs for a better conservation of Thelocactus species, taking into account the ecological requirements of focal species.

