


 nova página do texto(beta)
 Inglês (pdf)
 Artigo em XML
 Referências do artigo
 Enviar este artigo por email
 Citado por SciELO
  Similares em
SciELO
Similares em
SciELO 
 Permalink
Introduction
Roads are an increasingly ubiquitous sign of landscape anthropization across the globe even in regions supporting very fragile ecosystems. There is no question that roads are an important element within territory integration, but plenty of evidence exists showing that their construction and operation bring about a myriad of impacts over natural ecosystems and biodiversity (Laurence et al., 2014; Van der Ree et al., 2015). Road construction can produce abrupt changes in landscape topography, vegetation cover, microclimate, pollution inflow, hydrological dynamics, soil erosion, sediment deposition and traffic noise (Coffin, 2007; Forman & Alexander, 1998; Spellerberg, 1998). Moreover, road networks reduce vertebrate abundance (Fahrig & Rytwinski, 2009) alter population gene flow (Epps et al., 2005), affect animal´s behavior (Parris & Schneider, 2009; Parris et al., 2009), increase individual´s mortality (Hels & Buchwald, 2001; Taylor & Goldingay, 2004) and favor the spread of alien species.
Roedenbeck et al. (2007) put forward a research agenda aimed at furthering our understanding about the negative impacts that roads have on wildlife. This agenda focused on the following 5 questions: 1) Under what circumstances do roads affect population persistence? 2) What is the relative importance of road effects vs. other impacts on population persistence? 3) Under what circumstances can road effects be mitigated? 4) What is the relative importance of the different mechanisms by which roads affect population persistence? and 5) Under what circumstances do road networks affect population persistence at the landscape level? Over the last years several efforts have been made to try to answer these questions, however, we are still in need to obtain a more geographically balanced view of the magnitude and characteristics of the impact of road networks on wildlife. Most of the studies currently available have been conducted in the USA, Europe and Oceania, whereas studies from tropical regions are still scant. This lack of balance is exemplified by the fact that 2 special issues, published in 2000 and 2010, which focused on reviewing the ecological impacts of roads, included no studies from tropical latitudes (Trombulak & Frissell, 2000; Van der Ree et al., 2011). A deeper understanding of the characteristics and magnitude of road impact on tropical wildlife is particularly urgent due to the high vertebrate biodiversity and anthropogenic threat occurring therein (Laurance et al., 2009).
The general goals of this study were threefold. Firstly, to contribute with a more geographically balanced view of the magnitude and characteristics of wildlife mortality caused by roads. Secondly, to evaluate to what extent road mortality contrasts among different vertebrate groups. And finally, to evaluate how different landscape and road traits affect wildlife mortality.
Materials and methods
This study was conducted on the road running along the Pacific coastal plain in the state of Michoacán, western Mexico (Fig. 1). This two-lane road crosses the municipalities of Lázaro Cárdenas, Aquila and Coahuayana, which are located within the physiographic province of the Sierra Madre del Sur (Correa, 1974). The specific section of the road we studied was the 210 km located between the towns of Acalpican and Coahuayana (Fig. 1). This section of the road is surrounded by a modified landscape consisting of mostly small human settlements (50-200 inhabitants) with the exception of La Placita de Morelos (1,500 inhabitants), tracts of well-conserved forest, secondary vegetation and lands destined to cattle pasture and to a variety of crops. Monthly average temperature in this region is 26 °C and annual precipitation ranges from 600 to 800 mm. Main vegetation types found in the coastal region of Michoacán include: a) tropical dry forest, b) tropical sub-deciduous forest, c) riparian forest, d) savanna, and e) wetlands.
Figure 1 Location of the road along the western coast of the state of Michoacán, Mexico, in which animal kills were recorded.
We conducted 10 surveys to search for animals killed (amphibians, reptiles, birds and mammals). All surveys were conducted between July 2010 and January 2011 early in the morning to avoid repetitive damage of animals by passing vehicles. The road was travelled in a vehicle moving at a constant speed of 60 km/hour, slow enough to reduce the probability of missing killed animals the size of a rodent, but still fast enough to reduce interference with other vehicles. Every time a killed animal was detected on the road the vehicle was pulled over in the nearest safe place and members of our team approached the animal by foot wearing orange safety vests and gloves. Whenever it was possible animals were identified on site using field guides. When this was not possible, animal carcasses were collected and taken to the lab for a more careful inspection. All the animals were removed from the road to avoid recording the same animal more than once. The location of each animal kill was recorded with a GPS.
We compiled information about the following landscape variables for our study area: 1) percentage of tree cover from the 2010 MODIS vegetation continuous field product with a pixel resolution of 250 × 250 m (DiMiceli et al., 2011); 2) altitude, derived from a digital elevation model with a pixel resolution of 30 × 30 m (Inegi, 2011a); river and road location from maps scale 1: 50,000 (Inegi, 2011b) and human population density, derived from the interpolation of the 2010 National Census data using Arc Map tools (ESRI, 2011).
To analyze the relative contribution by different species of killed individuals within each vertebrate group, we constructed rank-abundance graphs (Mueller-Dombois & Ellenberg, 1974). We applied analysis of covariance to compare slopes of fitted logarithmic regression models, among species, as a way to contrast species evenness (Izsák, 2006).
Moreover, we assessed the completeness of the inventory of each vertebrate group by calculating the percentage that the total number of species recorded represented the species richness estimated for each group using 3 non-parametric estimators: incidence-based coverage estimator (ICE), Chao 2 and bootstrap. We used software EstimateS ver. 9.1 to calculate these richness estimators (Colwell, 2013).
We followed 2 approaches to analyze the relationship between landscape features and occurrence of animal kills. First, using ArcMap (ESRI, 2011) we divided the road in segments of 10 km. Then, we created a buffer area using a distance of 500 m around each of these segments which we used to extract information on the following variables: forest cover, altitude and human population density. We averaged individual pixel values to get a single value for each segment. Moreover, we calculated the average minimum distance of each segment to the closest river using ArcMap tools (ESRI, 2011). Finally, we divided the length of each segment (10 km) by the linear distance between the beginning and end to get an index of the road sinuosity. A value of this index near to 1 would indicate that the shape of the road is almost a straight line, whereas values greater than 1 would indicate a higher sinuosity. For each road segment we extracted the corresponding number of road kill records for each animal group.
We used classification and regression trees (CART) to assess the relationships between landscape features and frequency of road kills. CART analyses are nonparametric models, which use binary recursive partitioning for the dataset. The data are successively split along coordinate axes of the explanatory variables so that, at any node, the split, which maximally distinguishes the response variable is selected. Splitting continues until nodes are pure or the data are too sparse. Weight of each explanatory variable is assessed, and those explaining the greatest amount of deviance are selected. Deviance is calculated based on a threshold in the explanatory variable; this threshold produces 2 mean values for the response one above and the other below the threshold. For continuous variables CART estimates model fit by calculating r2 which is a percentage of the variance explained by each split (De’ath & Fabricius, 2000). We conducted CART analyses using the Tree package version 1.0-28 (Ripley, 2010) for R version 3.02 (R Development Core Team, 2013). Cross validation was conducted to select the classification tree size and estimate error rates for trees of a given size.
We complemented the previous analyses by characterizing the same landscape variables at this time for each individual road kill record. We used ArcMap tools (ESRI, 2011) to mark all the road locations in which at least 1 road kill was recorded, within the rest of the road length we generated a number of random points equivalent to the number of road kills recorded for each group. To analyze the resulting data, we applied GLM´s, this approach is more appropriate when variance in the response variable is not constant and when errors are not normally distributed (Crawley, 2012), as was the case of our response variables (probability of an animal being killed and the number of killed animals per 10 km-section). We tested the effects of 5 fixed factors and their interactions: 1 categorical (groups of vertebrates “G” with 4 levels: amphibians, birds, mammals and reptiles) and 4 continuous variables (sinuosity index ”SI”, forest cover “FC”, distance to rivers “DR” and population density “PD”). The analyses were conducted using generalized linear models with binomial error distribution for probability and Poisson for the abundances (Crawley, 2012). Saturated models were first fit and included all possible interactions. Models were then simplified based on sequential removal of non-significant fixed effects and detecting significant changes in residual deviance at each step. Predictions were obtained with the minimal model which includes only significant terms (Crawley, 2012; Faraway, 2005). All analyses were conducted in the statistical package R 3.02 (R Development Core Team, 2013).
Results
We recorded a total of 314 animals killed by collisions with vehicles. Among these animals we were able to identify 15 species of reptiles, 13 species of mammals, 9 species of birds and 1 species of amphibian (Table 1, Fig. 2). Analyses indicated that sampling completeness varied between 43% to 81% in birds, 87% to 98% in reptiles and 85% to 95% in mammals (Fig. 3, Table 2). Mammals accounted for 65% of the total number of animals killed followed by reptiles which accounted for an additional 25% and birds 7%. Amphibians represented only 3% of the total of animals killed.
Table 1 List of species recorded among animals found killed in the coastal road of Michoacán their degree of threat according to the IUCN Red list and Mexico´s wildlife legislation (NOM-059). T = Threatened, E = Endangered, Pr = Protected.
| Species | Family | Order | Conservation status | |
| IUCN | NOM-059 | |||
| Birds | ||||
| Cathartes aura | Cathartidae | Accipitriformes | Least concern | -- |
| Buteo nitidus | Accipitridae | Accipitriformes | Least concern | -- |
| Nyctidromus albicollis | Caprimulgidae | Caprimulgiformes | Least concern | -- |
| Geococcyx velox | Cuculidae | Cuculiformes | Least concern | -- |
| Crotophaga sulcirostris | Cuculidae | Cuculiformes | Least concern | -- |
| Caracara cheriway | Falconidae | Falconiformes | Least concern | -- |
| Falco sp. | Falconidae | Falconiformes | -- | -- |
| Cacicus melanicterus | Icteridae | Passeriformes | Least concern | -- |
| Nyctanassa violacea | Ardeidae | Pelecanifomes | Least concern | -- |
| Mammals | ||||
| Urocyon cinereoargenteus | Caniade | Carnivora | Least concern | -- |
| Procyon lotor | Procyonidae | Carnivora | Least concern | -- |
| Nasua nasua | Porcyonidae | Carnivora | Least concern | -- |
| Spilogale pygmaea | Mephitidae | Carnivora | Vulnerable | T (En) |
| Mephitis macroura | Mephitidae | Carnivora | Least concern | -- |
| Conepatus leoconotus | Mephitidae | Carnivora | Least concern | Pr (En) |
| Didelphis virginiana | Didelphidae | Marsupalia | Least concern | -- |
| Spermophilus variegatus | Sciuridae | Rodentia | Least concern | -- |
| Spermophilus adocetus | Sciuridae | Rodentia | Least concern | -- |
| Peromyscus sp. | Muridae | Rodentia | -- | -- |
| Oryzomis sp. | Muridae | Rodentia | -- | -- |
| Dasypus novemcinctus | Dasypodidae | Xenarthra | Least concern | -- |
| Tamandua mexicana | Myrmecophagiadae | Xenarthra | Least concern | E(En) |
| Amphibians | ||||
| Rhinella marina | Bufonidae | Anura | Least concern | -- |
| Reptiles | ||||
| Ctenosaura pectinata | Iguanidae | Squamata | Not assesssed | T(nE) |
| Iguana iguana | Iguanidae | Squamata | Not assessed | Pr |
| Heloderma horridum | Helodermatidae | Squamata | Least concern | T |
| Boa constrictor | Boidae | Squamata | Not assessed | T |
| Drymarchon melanurus | Colubridae | Squamata | Least concern | -- |
| Masticophis mentovarius | Colubridae | Squamata | Not assessed | -- |
| Salvadora mexicana | Colubridae | Squamata | Least concern | Pr(En) |
| Symphimus leucostomus | Colubridae | Squamata | Least concern | Pr(En) |
| Trimorphodon biscutatus | Colubridae | Squamata | Not assessed | -- |
| Micrurus laticollaris | Elapidae | Squamata | Least concern | Pr(En) |
| Loxocemus bicolor | Loxocemidae | Squamata | Not assessed | Pr |
| Crotalus simus | Viperidae | Squamata | Not assessed | -- |
| Rhinoclemmys rubida | Geomydidae | Testudines | Near threatened | Pr(En) |
| Kinosternon integrum | Kinosternidae | Testudines | Least concern | Pr(En) |

Figure 2 Examples of fauna recorded: A) Procyon lotor (racoon), B) Didelphis virginiana (possum), C) Heloderma horridum (gila monster), D) Cathartes aura (turkey vulture), E) Rhinoclemmys rubida (Mexican spotted terrapin), and F) Rhinella marina (cane toad).
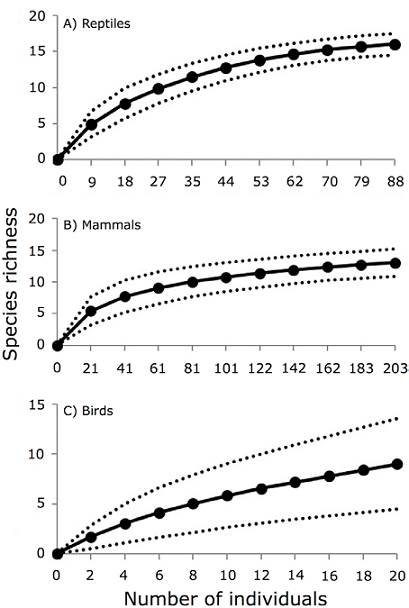
Figure 3 Rarefaction curves depicting species accumulation over the course of the study for 3 most commonly recorded animal groups.
Table 2 Number of species observed, estimated number of species and sampling completeness by birds, reptiles and mammals assemblages’ killed as a consequence of impacts with vehicles in the western coast of Mexico.
| Assemblage | Number of observed species | ICE | Chao 2 | Bootstrap | Completeness |
| Birds | 9 | 20.96 | 22.5 | 11.5 | 43-81 |
| Reptiles | 16 | 18.38 | 16.34 | 17.86 | 87-98 |
| Mammals | 13 | 15.22 | 13.68 | 14.4 | 85-95 |
The slope of the rank-abundance curves was stepper in mammals (m = -0.29, F 1,17 = 7.2, p = 0.001) than in reptiles or birds (m = -0.16, common slope) (Fig. 4). This result reflects a high concentration of road kills in 2 species of mammals: the common opossum Didelphis virginianus and the hog-nosed skunk Conepatus mesoleucus. These species accounted for 52% and 11% of the total of mammals killed, respectively. In contrast, the most frequently killed species among reptiles was the spiny-tailed iguana (Ctenosaura pectinata) which accounted for 25.3% of the total of recorded animals within this group. The second most killed species among reptiles was the green iguana (Iguana iguana) which accounted for an additional 22.8% (Fig. 4). Among birds, the species with the greatest representation of individuals killed was the turkey vulture (Cathartes aurea) (30%) followed by the common pauraque (Nyctidromus albicollis) (25%) (Fig. 4). Finally, the only species of amphibian recorded was the cane toad (Rhinella marina).

Figure 4 Rank-abundance curves for killed animals from 3 groups of vertebrates in the Michoacán coast highway, Mexico. The y-axis is scaled logarithmically. The 5 most important species in terms of number of killed individuals are presented. Abbreviations for birds: Cataur: Cathartes aurea, Nycalb: Nyctidromus albicollis, Nycvio: Nyctanasa violacea, Butnit: Buteo nitidus. For mammals: Didvir: Didelphis virginiana, Conmes: Conepatus mesoleucus, Dasnov: Dasypus novemcinctus, Mepmac: Mephitis macroura, Spipyg: Spilogale pygmaea. For reptiles Ctepec: Ctenosaura pectinata, Iguigu: Iguana iguana, Boacon: Boa constrictor, Repsp: Unindentified reptile and Loxbic: Loxocemus bicolor.
Killed reptiles included the greatest proportion of species of conservation concern (Table 1). Ten out of the 14 reptile species recorded were listed as threatened globally or in need of special protection at the national level (IUCN, 2010; Semarnat, 2010). Moreover, 6 of these species are endemic to the country (Table 1). Mammals were in second place in terms of including species of conservation concern among those killed on the road. There were 3 species of mammals endemic to Mexico and of conservation concern at the national level (Semarnat, 2010). One of these, the Pygmy Spotted Skunk, was also listed as vulnerable in the IUCN Red list (Table 1). There were no species of birds or amphibians endemic or threatened among those recorded.
The probability of an animal being killed on the road was similar for all the animal groups (Fig. 5, Table 2). However, we detected a significant negative relationship between road sinuosity and road kill probability. Moreover, we found a significant interaction between percentage of forest canopy cover and road sinuosity (Table 3). Therefore, our model indicated that the highest probability of a road kill was in sections of the road which combined a low sinuosity and greater forest coverage. In contrast, the frequency of animal road kills was lower in the sections of the road having a reduced forest cover and high sinuosity (Fig. 5).

Figure 5 Probability of vertebrates being killed in the Michoacán coast highway, Mexico. Closed circles indicate predicted values from the GLM. No differences were found between groups of vertebrates.
Table 3 Results of generalized linear models (GLM) used to assess the effect of 4 different factors and their interaction (G, PD, SI, and FC) on probability of animals being killed and abundance of killed animals. The statistics are provided (c2 values; degrees of freedom; and significance level, ns indicate non-significant effects). The table presents only significant terms and non-significant, were removed from the final model.
| Probability | Abundance | |||||
| Factor | χ2 | df | p | χ2 | df | p |
| Group (G) | - | - | ns | 26.9 | 3 | < 0.001 |
| Population Density (PD) | - | - | ns | 16.87 | 1 | < 0.001 |
| Sinuosity Index (SI) | 12.3 | 1 | < 0.001 | 7.1 | 1 | 0.04 |
| Forest Cover (FC) | 1.6 | 1 | ns | - | - | ns |
| FC:SI | 3.7 | 1 | 0.05 | - | - | ns |
When we used the number of road kills (CART analysis) as response variable, we found important differences among animal groups (Fig. 6, Tables 2, 3). First, we identified a major division between mammals and the remaining 3 groups (reptiles, birds and amphibians) in terms of the magnitude of road kills (r2 = 22%). A secondary division occurred between reptiles and amphibians and birds. The main factor underlying these divisions of the tree was variation in road sinuosity. Therefore, those 10-km sections of the road with a sinuosity index > 1.15 had a lower abundance of killed animals, whereas road sections with sinuosity index < 1.15 had a greater abundance of killed animals. The CART analysis also indicated that human population density played a role in the division of road sections: those with a lower density (< 11.3 inhabitants/km2) showed a higher abundance of killed individuals (Fig. 6). While in contrast, road sections with a higher density (> 11.3 inhabitants/km2) had a lower number of killed individuals. The GLM supported the CART findings and indicated differences among groups of vertebrates. This analysis also indicated that population density and the sinuosity index were significant, but not their interaction (Fig. 7, Table 3). We found a negative relationship of the abundance with sinuosity and with population density. Specifically, the model predicted that those 10-km sections with higher sinuosity and low population density resulted in low abundances of killed animals. The higher abundances were predicted at low sinuosity (straight road sections) and low human population density (Fig. 7, Table 3).

Figure 6 Classification tree for 4 groups of vertebrates killed at the Michoacán coast Highway. The labels at each split indicate the explanatory variables used in the model, the mean number killed animal (bold numbers), and the proportion of variance explained by the split (r). The tree explained (r2) 54% of the total variance. Group refer to Amp: amphibians, Bir: birds, Rep: reptiles and Mam: mammals. Sin Ind: sinuosity index and Hum den: human density (ind./km2).
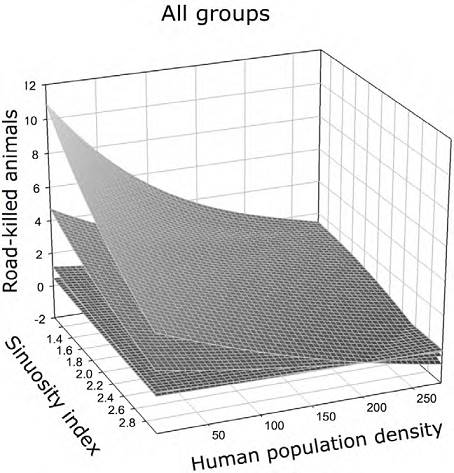
Figura 7 Surface of the predicted number of killed road individuals for 4 groups of vertebrates based in a GLM considering population density (hab/km2 * 100) and sinuosity index in the Michoacán coast highway. Differences among groups are represented by the different surfaces: mammals, reptiles, birds and amphibians are represented in order from the top to the low surface.
Discussion
We recorded a total of 314 animals killed as the result of collisions with vehicles during 10 one-day surveys. This represents an approximate of 31.4 deaths per day, which if multiplied by 365 gives a rough estimation of 11,461 animal kills per year. Our figures may represent an overestimation or underestimation depending on the relative impact of 2 non-exclusive factors: 1) one-day surveys were not consecutive always, the possibility exists that in some instances, daily records reflected the mortality accumulated over the course of several days, and 2) it has been shown that carcass removal by scavengers can be extremely fast and effective, causing disappearance of a large proportion (60-97%) of killed animals within 36 hours (Antworth et al., 2005; Teixeira et al., 2013).
Almost 24% of the species recorded were endemic to Mexico and 45% were identified as threatened or in need of special protection according to the country´s wildlife legal regulation (Semarnat, 2010). Among such fauna, mammals and reptiles were the most affected by road impact, exceeding up to 10 times the number of records for birds and amphibians. The observed contribution of mammals to the total number of road kills (65%), falls close to the upper extreme of the variation (8.14% to 67%) reported in other studies (Clevenger et al., 2003; Coelho et al., 2008; Grosselet et al., 2007; Ramp et al., 2006; Taylor & Goldingay, 2004). On coastal roads in Oaxaca, another tropical area in Mexico, amphibians and reptiles were also the most affected vertebrates (Grosselet et al., 2007). Likewise, amphibians were the most impacted fauna by road kills in Florida (USA) and Santa Fe (Argentina) (Barichivich & Dood, 2002). In contrast, mammals were the most affected group in roads of Australia (Taylor & Goldingay, 2004). Among mammals, marsupials usually account for the highest number of road kills (Attademo et al., 2011; Delgado, 2007; Grosselet et al., 2007; and the present study), while toads and iguanas are the most affected among amphibians and reptiles, respectively (Grosselet et al., 2007). In the case of birds, we found that scavengers were the most affected. Specifically, the turkey vulture, C. aurea, whose attraction to dead animals on the road may explain why it is more prone to be impacted by vehicles.
It has been shown that landscape features of roads have a clear influence on the species composition of animal kills (Bencke & Bencke, 1999). For example, proximity to wetlands seems to increase frequency of road impact on amphibians (Attademo et al., 2011; Smith & Dood, 2003). On the other hand, the proximity of roads to suburban and urban areas seems to increase mortality of mammals such as marsupials and bats (Bencke & Bencke 1999). In this study, road kills of opossums and the pygmy spotted skunks were especially frequent near suburban areas, were the landscape was modified by human activities such as agriculture and cattle ranching which seem to offer some resources for these species. All the species of reptiles and birds were vulnerable to vehicle collisions where coverage of dry forest was relatively high. Dry forest areas constitute important habitat for the species in these groups.
Road features are important to assess animal vulnerability to vehicle impact. We found road shape was associated to the frequency of animal kills with straight sections having a higher frequency of collisions than sections of the road where sinuosity was high. This effect was evident in cases involving mammals, reptiles and birds (there were not enough data on amphibians to conduct this analysis). This finding is likely related to the possibility of vehicles to reach higher speeds in straight sections of the highway (ca. 120 km/h). In comparison, vehicle speed is reduced to 50-60 km/h in sections of the road where curves are more frequent. On the other hand, despite that it was not possible to determine the exact time of the day in which each animal kill occurred the fact that several of the species had nocturnal habits suggest visibility might play an important role to increase risk of animals to be killed.
It stands out that road impact concentrates on a reduced group of species which likely share a common set of features that makes them more prone to be affected. This finding opens the possibility to design very specific conservation strategies which consider the ecology of these species.
Despite their reduced number, species affected by road kills included several of conservation concern. This suggests that increased implementation of roads in the region might have a very significant impact in terms of the local vertebrate diversity. On the other hand, our results allow us to suggest some specific actions for our study area which also might be useful for other regions: conservation efforts (e.g., signs, fences and overpasses) should be concentrated in straight sections of the road and in forested areas, as well as suburban areas (Ascensão et al., 2013; Crosby, 2014; Goosem, 2012; Oškinis et al., 2013). This protection should be focused on small mammals and reptiles, being the most sensitive groups. These strategies are urgent to reduce the great impact roads have on animal diversity.

