


 nova página do texto(beta)
 Inglês (pdf)
 Artigo em XML
 Referências do artigo
 Enviar este artigo por email
 Citado por SciELO
  Similares em
SciELO
Similares em
SciELO 
 Permalink
More than 30 years ago, Lande and Arnold (1983) developed a framework to explicitly quantify the shape and strength of natural selection on quantitative traits in nature. This novel approach allowed researchers to estimate natural selection on the mean (directional selection), variance (stabilizing/disruptive selection) and covariance (correlational selection) on correlated phenotypic traits in a traditional multiple regression model. Since its appearance, a breakthrough on the understanding of the evolution of multivariate phenotypes of an individual has been achieved (Blows & Brooks, 2003; Endler, 1986; Mitchell-Olds & Shaw, 1987; Morrissey & Sakrejda, 2013).
As any classical regression model, Lande and Arnold’s approach estimates the degree of uncertainty in selection coefficients (“selection gradients”) by calculating standard errors. This immediately leads to the computing of p-values to decide whether natural selection operates or not on a given population. In turn, this raises several issues on the treating of p-values when quantifying natural selection. First, it is known that p-values are poorly relevant by themselves, as they hide 2 parameters of statistical inference: the effect size and the statistical power, which is a function of sample size (Johnson, 1999; Sullivan & Feinn, 2012). This is a more general issue in biological sciences (Nakagawa & Cuthill, 2007; Yoccoz, 1991), not a specific problem of this approach (Lande & Arnold, 1983). Moreover, natural selection has been shown to be of low intensity in nature (Conner, 2001; Hoekstra et al., 2001; Kingsolver et al., 2001, 2012), which may cast doubt on their use in natural selection studies. In this sense, and after identifying a covariation between phenotypic traits and fitness, the process of natural selection may be still occurring regardless the ability of p-values to detect it. Second, the estimation of several gradients on the same population over time or space should be followed by some correction of p-values to avoid the vicious trap of multiple testing (Rice, 1989). Nevertheless, multiple testing corrections have several drawbacks that argue for rejecting their use in ecology, the most important being that they ignore the number of significant statistical tests performed (Moran, 2003). Besides, given the large sample sizes required to accurately estimate selection gradients when multiple traits are considered simultaneously (Kingsolver et al., 2001), I pose the following question: how should we handle p-values to determine whether natural selection operates? I argue that p-values derived from selection gradients are necessary but not sufficient condition to infer natural selection.
To show my point, I propose a hypothetical study in which 2 quantitative traits (z1 and z2), and their respective fitness (w) were measured in 100 individuals of a population in 3 selection episodes (Table 1, Fig. 1). The common approach following Lande and Arnold (1983) would be computing selection gradients in each episode. As an example, consider the first trait z1. p-values in Table 1 show that none of the linear gradients are significant. However, the 3 estimates are consistently positive, which makes us suspect of a rather weak but positive directional selection on this trait. So, how can we measure this effect? A first approach would be using a generalized linear mixed model (GLMM) with selection episode as a random effect, in addition to a general linear model for each episode. Thus, the idea is drawing inferences from a general pattern of selection, besides quantifying individual selection gradients. Using a GLMM, we conclude that there is a significant linear selection pattern on z1 over the 3 episodes (mean z1 linear gradient = 0.012, SE = 0.005, t295 = 2.260, p = 0.024). A second possible approach would be taking advantage from meta-analysis techniques (Calsbeek & McPeek, 2016; Morrissey, 2016). In this simple case and for illustrative purposes, I used weighted least squares to synthetize regression slopes as the weighted mean of the linear gradients, where the weights are computed as the inverse of their variances (Becker & Wu, 2007). Again, an overall significant positive linear gradient is detected (mean z1 linear gradient = 0.008, SE = 0.002, t2 = 4.910, p = 0.040). Even this simple example highlights the importance of considering several pieces of information into a broader scenario of natural selection, instead of assessing each individual piece separately.
Table 1 Hypothetical example of an analysis of natural selection on a population of 100 individuals following the approach of Lande and Arnold (1983). Two standardized phenotypic traits (z1 and z2) related to a fitness measure (w), coefficients estimating different shapes of selection (linear and non-linear), and standard errors (SE) are shown.
| Selection episode |
Trait | Linear gradient |
SE | t | p | Non-linear gradient |
SE | t | p | |
|---|---|---|---|---|---|---|---|---|---|---|
| 1 | z1 | 0.008 | 0.009 | 0.917 | 0.361 | 0.026 | 0.012 | 2.200 | 0.030 | |
| z2 | × z2 | 0.014 | 0.009 | 1.459 | 0.148 | 0.008 | 0.015 | 0.561 | 0.576 | |
| z1 | 0.012 | 0.008 | 1.394 | 0.167 | ||||||
| 2 | z1 | 0.018 | 0.010 | 1.695 | 0.093 | -0.024 | 0.013 | -1.817 | 0.072 | |
| z2 | × z2 | 0.005 | 0.011 | 0.470 | 0.640 | 0.015 | 0.017 | 0.880 | 0.381 | |
| z1 | 0.0003 | 0.010 | 0.027 | 0.979 | ||||||
| 3 | z1 | 0.011 | 0.009 | 1.237 | 0.219 | 0.001 | 0.012 | 0.079 | 0.937 | |
| z2 | -0.008 | 0.009 | -0.875 | 0.384 | 0.004 | 0.015 | 0.284 | 0.777 | ||
| z 1 | × z2 | 0.003 | 0.009 | 0.375 | 0.708 | |||||
*The following models were built: w = 0.1×z1 + 0.2×z2 (episode 1); w = 0.2×z1 + 0.02×(z2)2 + 0.2×z1×z2 (episode 2); w = 0.2×z1 + 0.1×(z2)2 (episode 3); z1 and z2 were simulated using standard normal distributions. In all models, an error term following a standard normal distribution was included.
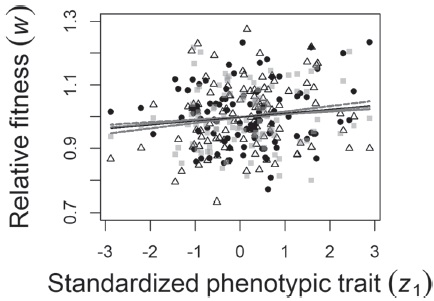
Figure 1 Natural selection on a hypothetical population (N = 100) in 3 selection episodes (gray squares: episode 1, black circles: episode 2, white triangles: episode 3). Dashed lines depict the relationship of a phenotypic trait (z 1) and fitness (w) conditional on the mean of z 2, derived from Lande and Arnold’s model. The black line, in contrast, shows the overall relationship between z 1 and w over the 3 episodes, resulting from the fit of a generalized linear mixed model. None of the individual regression lines are significant, but when taking the 3 individual models into account, an overall significant linear pattern of natural selection is detected.
As stated before, quantifying natural selection in natural populations is essential in evolutionary biology, as it represents a first step to understand the evolution of phenotypic traits (Endler, 1986). Nevertheless, the analysis of selection through space and time should be also accompanied by the biological importance of the effect (Nakagawa & Cuthill, 2007), that is, a relevant interpretation of an estimated magnitude of an effect from selection coefficients. Assessing the significance of individual selection gradients through p-values may be of little importance, as it mostly relies on sampling size, which in turn would be impaired by some correction on multiple testing. As Calsbeek and McPeek (2016) point out, selection regimes, temporal variability, types of characters, population sizes and environmental effects are the interesting elements about measuring natural selection in the wild, rather than its intensity. In practice, natural selection studies should not only report selection gradients and their associated standard errors, but also an overall effect size measure for each selection gradient (if applicable), and p-values of these effect sizes. Overall, the main message here is that considering several selection gradients to obtain a single p-value would be more relevant than computing a p-value for each selection gradient, as it is expected to provide a clearer picture of the general pattern of selection in nature.

