


![M. Kéry y J. A. Royle. 2016. Applied hierarchical modeling in ecology: analysis of distribution, abundance and species richness in R and BUGS. Vol. 1 Prelude and static models. Academic Press, London, UK. 783 Pp. [ISBN: 978-0-12-801378-6]](/img/es/next.gif)


 nueva página del texto (beta)
 Inglés (pdf)
 Artículo en XML
 Referencias del artículo
 Enviar artículo por email
 Citado por SciELO
  Similares en
SciELO
Similares en
SciELO 
 Permalink
The Baird’s tapir (Tapirus bairdii) is the largest terrestrial vertebrate (> 250 kg) living in the Neotropics and the only native representative of the Perissodactyla (one of the most threatened orders of mammals) in the Americas (Baillie, Griffiths, Turvey, Loh, & Collen, 2010). This species is classified as endangered due to the extreme reduction of its population and habitat (Schank et al., 2015). Southeast Mexico is one of the most important strongholds for T. bairdii but is subjected to an increased pressure due to human activities (Mendoza et al., 2013). The level of endangerment of the species makes strategies for its recovery, such as ex situ management, greatly needed; however, its implementation requires data on tapir’s genetic variability which is mostly missing (Ruiz-García et al., 2012).
We requested biological samples from 8 zoos in Mexico keeping tapirs (15 individuals) in captivity. We obtained 11 samples (hair, feces and in 1 case blood) from the following zoos: ZooMAT, ZooGuadalajara, ZooLeón and Africam Safari. Four of the samples were from tapirs born in the wild in southern Mexico, 3 samples were from tapirs born within the breeding program of the ZooMAT, and the remaining samples were from tapirs born in USA zoos and donated to Mexico. Tapir hair was collected, wearing gloves, and using a pet brush to later be stored in plastic bags. Feces samples (3–20 ml in volume) were taken following the manual of the genetics committee of the IUCN/SSC Tapir Specialist Group (TSG, 2005). The blood sample (≈100 μl) was collected from the tapir’s back leg using a syringe and stored in an EDTA blood Vacutainer. Twenty-eight feces samples (1–10 ml in volume) were collected in different localities within the range of distribution of Baird’s tapir in Chiapas, Mexico. These samples were preserved in 95% ethanol and stored at −20 °C. Total DNA from hair and blood samples was extracted using the salting-out protocol (Miller, Dykes, & Polesky, 1988). Total DNA from feces was extracted using a variation of the Orsini and Romano-Spica (2001) and Hoshino’s and Matsumoto (2004) protocols. Samples (20–40 g) were dried and pulverized to later be incubated in 1.5 ml microtubes containing lysis buffer (200 mM, pH 8.0, Tris HCl, 2% SDS, 4% PVP, 100 mM NaCl, 50 mM EDTA) and 5–10 mg of powdered skim milk at 60 °C using a thermomixer for 15 min. Pulses of 3–5 s at 600 W were applied to the mixture every 5 min in a microwave leaving the container’s lid open. Protein, carbohydrates and other residues were separated using a phenol-chloroform protocol (Sambrook & Russell, 2001) 1–2 times up to the solution had a clear coloration. To remove residual salts, the DNA samples were dialyzed in Petri dishes, using 0.025 mm micropore membranes and sterile distilled deionized water. The resulting solution was concentrated using an Eppendorff Vacufugue.
Ten different microsatellites loci previously developed using Tapirus terrestris and T. bairdii sequences were tested using DNA feces samples of T. bairdii requested to the Los Angeles Zoo. Six of the 10 microsatellites (Table 1) occurred in all the tested individuals thus, were selected for the analyses. For detection analysis primers were marked with 5-FAM fluorochrome (Invitrogen). Each reaction was prepared following the instructions of the platinum Taq DNA polimerase kit (Invitrogen). After preparation, the samples were run in a GeneAmp PCR System 2700 (Applied Biosystems) using the conditions reported for their authors (Table 1).

Allelic richness (Rs) was estimated with the softwares GeneAlEx version 6.3 (Peakall & Smouse, 2006) and FSTAT 2.9.3 (Goudet, 2001). We estimated the allelic richness of all the captive tapirs in Mexico (samples from tapirs donated by USA zoos and originated from wild populations pooled). Afterwards, we separated these samples to contrast their allelic richness against the corresponding allelic richness of individuals from Costa Rica and Panama (Norton & Ashley, 2004b) applying Wilcoxon tests. We used the software GeneAlEx and Genetic Data Analysis GDA (Lewis & Zaykin, 2001) to estimate observed heterozygocity (Ho), expected heterozygocity (He) and to run Hardy–Weinberg (H–G) equilibrium tests. We applied an analysis of molecular variance (Amova) using the software GeneAlEx. We calculated the genetic diversification values of FIS, FIT and FST with the software FSTAT ver. 2.9.3 (Goudet, 2001) and applying a Bonferroni correction (α = 0.05). The allelic richness found in Mexican tapirs was compared against the values of 6 microsatellites loci reported by Norton and Ashley (2004b) using Anova.
The primers used to amplify DNA sequences of the D-loop region of Baird’s tapir were developed at the Center for Tropical Research of the University of California, Los Angeles. These primers developed for the amplification of the D-loop hypervariable region in horse (Bowling, Del Valle, & Bowling, 2000) were aligned with the horse (Equus caballus, Genbank NC_001640) and Brazilian tapir (T. terrestris, Genbank: AJ428947) mitochondrial sequences to identify the hypervariable region of interest for Baird’s tapir. Two sets of primers were designed from conserved sequences shared by horse and the Brazilian tapir. The effectiveness of the primers was validated by PCR amplification and sequencing of the target D-loop region in 3 Baird’s tapir samples obtained from the Los Angeles zoo.
The D-loop hypervariable region of 13 samples was amplified by PCR using a platinum Taq DNA polimerase kit (Invitrogen) in a GeneAmp PCR System 2700 (Applied Biosystems) with the forward TapDLN-F (5’-ATT ACC CTG GTC TTG TAA ACC AG-3’) and reverse TapDLN-R (5’-GCC CTG AAG TAA GAA CCA GAT G-3’) primers with the following conditions: an initial denaturation at 95 °C for 5 min in a thermocycler, followed by 30 cycles of 1 min at 95 °C, 1 min at 47 °C, 1 min at 72 °C, and a final extension at 72 °C for 8 min. The sequences of both DNA strands were obtained using a commercial provider (Macro-gen USA). The nucleotide sequences were edited and aligned using BioEdit 7.0 (Hall, 1999) and compared using BLAST (NCBI/Basic local alignment search tool BLAST).
The phylogenetic analysis was conducted using a maximum likelihood (ML) and a Bayesian criteria using softwares MEGA v6 (Tamura et al., 2013) and MrBayes v3.1.2 (Ronquist & Huelsenbeck, 2003). For the ML criterion we used the model T9+G, and a discrete gamma distribution, 5 categories and 10,000 bootstrap replicates following the Find Best Model algorithm. For the Bayesian analysis we generated 1,000 trees using the following settings: ngen = 100,000 and sample freq = 100 criteria. The first 250 trees were burn-in and discarded, and the 50% majority rule consensus tree was generated using the remaining trees, T. terrestris (Taxid: 9801) was used as out-group. We calculated haplotype and nucleotide diversity and the number of polymorphic sites using DnaSP v5 (Librado & Rozas, 2009). We built a median joining network using the software NETWORK 4.6.0 (Fluxus Technology Ltd., 2013).
We obtained PCR products of the microsatellites in 9 of the 11 samples. A total of 24 alleles were detected for the 6 loci ranging from 3 to 6 alleles/locus with a mean allelic richness Rs = 3.94 (standard deviation, s = 0.97) for all tapir samples pooled together and Rs = 3.29 (s = 1.01) when including only samples of tapirs from Mexican populations. These Rs values were not different of homologue data of tapirs from Panama and Costa Rica (F < F-crit, p = 0.38). The observed heterozygocity (Ho) for each locus was larger than the expected (He) and the mean FST = 0.021 was no different between Mexican and USA individuals. The mean value of FIS = −0.295 across the loci suggested an excess of heterozygocity inside the whole group (Table 2). The examination of the H–W equilibrium across the loci for the whole group showed a deviation in the case of Tter09. Nevertheless, the Fisher’s exact test applied to each locus showed no deviations from the H–W equilibrium (p > 0.05). Likewise, Fisher’s exact test applied to samples from captive individuals in Mexico (from USA zoos and local wild populations) showed no significant deviation from the H–W equilibrium. There were no significant differences among the FST, FIS and Fit values in the Amova analysis P (random ≥ data). We found 6 private alleles, 4 of them within samples of Mexican tapirs and 2 more within samples of tapirs donated by USA zoos. We isolated DNA from 21 of the 28 samples of feces from the field and obtained amplicons in 13 out of these 21 samples; 7 of them were within the expected range of weight for the D-loop fragment. Only 3 of these sequences were clear enough to be analyzed (MP3324, MP3335 and MP3338). Therefore, there were only 10 sequences of the control region from individuals in captivity and 3 from samples collected in the field. No sequences of the control region of T. bairdii were found in the data bank of the National Center for Biotechnology Information (NCBI). However, the analysis of the 10 T. bairdii sequences using BLASTn indicated a similarity of up to 87% with the mtDNA of T. terrestris (GeneBank: AJ428947.1) and up to 81% with the mtDNA of T. indicus (GeneBank: KJ417810). Moreover, this analysis showed the existence of 7 haplotypes with 15 polymorphic sites, Hd = 0.846 and Pi = 0.0128. All the nucleotide changes were transitions. The dendrograms generated using maximum likelihood and Bayesian inference showed that samples of tapirs donated by USA zoos were arranged in a monophyletic sub-group whereas samples of tapirs from wild populations in Mexico constituted a paraphyletic group. The divergence in the control region sequences within tapirs from Chiapas was up to 0.021% whereas within tapirs from USA zoos, was 0.005% (Fig. 1).
Table 2 Polymorphism of six microsatellite loci across captive individuals of Tapirus bairdii.

Ar, number of alleles previously reported; Ao, observed alleles; Ae, effective alleles; Ho, observed heterozygocity; He, expected heterozygocity; FIS, differentiation inside the population; FST, differentiation between populations.

Figure 1. Consensus tree based on the D-loop sequences. The support values correspond to maximum likelihood/Bayesian trees.
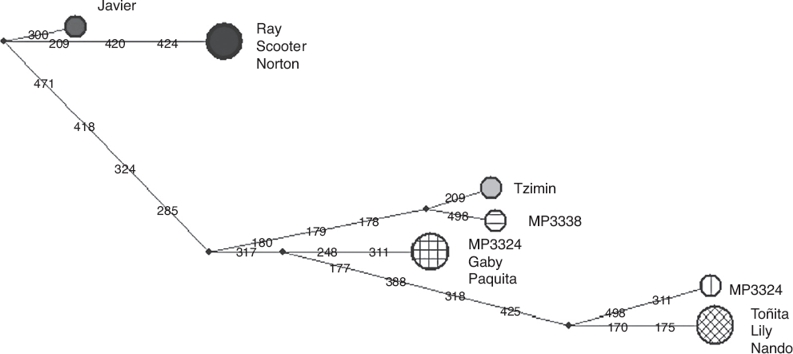
The haplotype network (Fig. 2) showed in tapirs from Mexico a separation of up to 15 nucleotide changes between mother lines. In comparison, the USA group showed only 5 nucleotide changes between sequences. Therefore, with a lower number of individuals, it was possible to see more diversification among tapirs from Chiapas than the reported by Ruiz-García et al. (2012) analyzing 23 individuals of T. bairdii from Panama and Costa Rica. We included only one of the locus reported by Norton and Ashley (2004b) in our study, yet, microsatellite analysis showed a similar value of allelic richness compared to the obtained for Panama and Costa Rica individuals. We did not find significant differences in allelic richness when comparing Mexico/USA and Mexico/total individuals (p = 0.05). In agreement with Norton and Ashley (2004a, 2004b), we found that our estimated levels of allelic richness were relatively low. However, our sample size was smaller than the used by these authors, a situation that likely affected the possibility to detect any genetic structure by reducing statistical power of Amova and Anova. The combination of the negative values of FIS and the Ho > He relationship might be related to the occurrence of a relatively high proportion of private alleles in a small number of individuals. Since these alleles occurred at low frequencies their effect over the FST value seemed to be minimal. There might be high variability among individuals but not enough individuals as to generate detectable genetic fixation within the population. The analysis of the D-loop region showed more polymorphisms between mother lines from Chiapas than between the 2 mother lines of individuals donated by USA zoos. The ancestors of the USA tapirs came from Panama, Honduras, Nicaragua and Costa Rica. We do not know with certainty the origin of the mother lines of tapirs donated by USA zoos but Ruiz-García et al. (2012) found 2 different main lineages when analyzing mitochondrial (Cyt-b) sequences: Mexico-Guatemala and Costa Rica-Panama, which were estimated to have diverged about 2.4 million years ago. Likewise, the haplotypes network obtained in the same study showed only 1–2 nucleotide changes between Costa Rica-Panama groups and the nearest hypothetical ancestor, similarly to what we found in this study for tapirs donated by USA zoos.
It stands out that we found a relatively high number of private alleles and polymorphisms between mother lines in samples of captive tapirs originated from wild populations in Mexico. This result opens the possibility to find more genetic variation in a more comprehensive survey of tapir populations occurring in our country. The level of endangerment of Baird’s tapir, locally and globally, makes studies to analyze the genetics’ spatial variation of their populations urgent to identify conservation hot spots and to set the basis for a sound management plan for the species.

