


 text new page (beta)
 English (pdf)
 Article in xml format
 Article references
 Send this article by e-mail
 Cited by SciELO
  Similars in
SciELO
Similars in
SciELO 
 Permalink
Introduction
Conifers are the largest gymnosperm lineage, making up approximately 64% of the group’s species richness (Eckenwalder, 2009). Pinaceae is the largest conifer family, comprising approximately 232 species classified in 11 genera (Farjon & Filer, 2013). The family is distributed exclusively in the Northern Hemisphere except for 1 equatorial species of Pinus in Sumatra. Most species occur in montane habitats, particularly in conifer forests in temperate to cold regions; less commonly they occur in semi-arid regions and in tropical and subtropical latitudes (Farjon & Filer, 2013).
In Mexico, Pinaceae is represented by 4 genera (Abies, Picea, Pinus, and Pseudotsuga) and 61 species, 30 of which are endemic (Gernandt & Pérez-de la Rosa, 2014). Pinaceae genera are the defining components of Pinus forest, Pinus shrubland, Abies forest, and Pseudotsuga and Picea forest; they also occur in other vegetation types such as montane cloud forest, mixed forest (most notably, Pinus-Quercus forest), and xeric shrub-lands (Rzedowski, 1978). Pinus is the most species rich genus in the family, and Mexico has a greater richness and diversity of pines than any other country in the world (Farjon & Styles, 1997).
The state of Puebla is located in central Mexico between 20°50’ N and 17°52’ N, 96°43’ W and 99°04’ W. It has an area of 34,290 km2, which represents 1.7% of the total area of the country (Inegi, 2004). In the state 7 biogeographical regions converge, of which, the 4 most extensive are the Sierra Madre Oriental, the Northern Gulf Coastal Plain, the Trans-Mexican Volcanic Belt, and the Balsas River Basin (Inegi, 2004). The state possesses a great diversity of climates and vegetation types, due fundamentally to striking altitudinal changes and its relief. Temperate climates predominate, with forests having the greatest extension, and conifer forests being exceptionally widespread (Inegi, 2000). For Puebla, 15 species of Pinaceae are reported, corresponding to 24.6% species diversity of Pinaceae for Mexico (Ramos-Dorantes, 2015; Table 1). These belong to 3 genera: Abies (2 species), Pinus (the most diverse with 12 species and 4 varieties), and Pseudotsuga (1 species). Their distributions are known from herbarium specimens and databases. However, it is uncertain in quantitative terms how adequately the state has been explored. With the help of computational tools and geographic information systems (GIS) it has been possible to evaluate different aspects of conifers, for example to estimate the distribution of species individually (García-Aranda, Cantú-Ayala, Estrada-Castillón, Pando-Moreno, & Moreno-Talamantes, 2012; Leal-Nares et al., 2012) or collectively (Evans & Cushman, 2009). They have also served to evaluate the distribution of species in the past (Gugger, González-Rodríguez, Rodríguez-Correa, Sugita, & Cavender-Bares, 2011) and under climate change scenarios (Gómez-Mendoza & Arriaga, 2007), to estimate niche divergence between species (Aguirre-Gutiérrez, Serna-Chávez, Villalobos-Arámbula, Pérez-de la Rosa, & Raes, 2015; López-Reyes, Pérez-de la Rosa, Ortiz, & Gernandt, 2015), to assess conservation strategies either in the present or in the future (Aguirre-Gutiérrez & Duivenvoorden, 2010; Ogawa-Onishi, Berry, & Tanaka, 2010), and even to model the distribution of their parasites (Evangelista, Kumar, Stohlgren, & Young, 2011). Similar strategies have been applied in other groups of plants (Cruz-Cárdenas, Villaseñor, López-Mata, & Ortiz, 2013; Cruz-Cárdenas, López-Mata, Ortiz-Solorio, et al., 2014; Cruz-Cárdenas, López-Mata, Villaseñor, & Ortiz, 2014; Delgadillo, Villaseñor, Cárdenas, & Ortiz, 2014; Villaseñor, Ortiz, Cadena, & Estrada, 2013). The objective of the present study is to evaluate the distribution, species richness, and conservation status of Pinaceae in the state of Puebla by analyzing data from natural history collections, through field exploration, and by generating potential distribution models.

Materials and methods
We used 572 georeferenced specimen records of 15 species reported by Ramos-Dorantes (2015) as occurring naturally in Puebla (Table 1). P. pseudostrobus was separated into 2 varieties (vars. pseudostrobus and apulcensis), but the same distinction was not made for 3 other infraspecific taxa recorded for the state. Records were obtained from field collections and from 6 herbaria (MEXU, INIF, ENCB, CHAP, CHAPA, and HUAP). We also consulted online collections (The New York Botanical Garden, 2014; The United States National Herbarium, 2014) and databases (SEInet, 2014), and the Global Biodiversity Information Facility (GBIF, 2014).
Most studies of distribution patterns have focused on measuring the number of species in equivalent areas within the study area. For that reason, they have used a constant cell size and counted the number of species whose distribution intersects a given cell (Arita-Watanabe, 2001). This strategy initially identifies cells with high species richness. To estimate the appropriate cell size for the present study, information from the records was used to calculate the area of occupation (AOO) of each species. To define this area, we followed the recommendation by the International Union for the Conservation of Nature (IUCN, 2001) to set the cell size to 10% of the distance separating the 2 most distant collection points (Suárez-Mota & Villaseñor, 2011). This was done with the “Conservation Assessment Tools” extension for ArcView (Moat, 2007). The optimal width of the cell was the mean of the values of the cell of each species, and the result was a cell of 14.8 km per side. These were transformed to arcminutes, giving a measurement of 10 min. This measurement was used to form a quadrant over the state of Puebla. The geo-referenced Pinaceae collection records were placed over this quadrant to obtain the number of species in each geographic unit (cell) and a map of known richness was generated with this information.
We used the geographic coordinates of the collection records to construct a species–accumulation curve (Gotelli & Colwell, 2001). The sampling units were 70 cells of 10 min per side. The asymptote of the accumulation curve theoretically predicts the number of species that should be found in the study area (Jiménez-Valverde & Hortal, 2003). The number of cells in which a taxon appeared was used as a measurement of the collection effort. Its order was randomized 100 times using EstimateS version 9.1.0 (Colwell, 2009), with the aim of constructing a smoothed curve. The asymptote of the curve was estimated by adjusting the Clench equation to the accumulation curve (Colwell & Coddington, 1994; Soberón & Llorente, 1993) using the Simplex and Quasi-Newton method in STATISTICA (StatSoft, 2011).
We used 58 environmental variables for Puebla with a resolution of 30 arcseconds (López-Mata, Villaseñor, Cruz-Cárdenas, Ortiz, & Ortiz-Solorio, 2012). At this resolution, we performed a principal component analysis (PCA) to select variables for use in modeling (Cruz-Cárdenas, López-Mata, Villaseñor, et al., 2014; Janžekovič & Novak, 2012). PCA is one of the most commonly used methods for removing correlation from a set of variables and reducing collinearity (Dormann et al., 2013). We chose the components that accumulated 85% of the variance, and for each component the 5 variables with the greatest absolute load value. The analysis was performed with R (R Development Core Team, 2015).
The potential distribution map was generated with Maxent v. 3.3.3k (Phillips, Anderson, & Schapire, 2006) using the default settings. For training the model 75% of the records were used and the remaining 25% for testing. The full state’s surface was considered as the mobility area (M of the BAM schedule of Soberón & Peterson, 2005) for all the species analyzed. The contribution of the variables was estimated using the jackknife. To implement the jackknife, variables were excluded 1 at a time and the model was re-run to compare its performance in describing the species distribution in the absence of the variable (Baldwin, 2009; Phillips et al., 2006). The minimum number of records used to perform the modeling was 5 per species; for those with fewer records, models were generated using georeferenced records from the adjacent states of Hidalgo and Veracruz. Each distribution model was transformed to a Boolean (presence–absence) layer (Peterson et al., 2011) using ArcMap 10 with a different threshold for each species with the aim of minimizing the error or omission rate (Table 2). The potential distribution map obtained for each species indicated the areas in the state where the model predicted its presence (Graham & Hijmans, 2006). Subsequently, the Boolean models were overlayed to generate a potential distribution map for Pinaceae in Puebla.
Table 2 Taxon distribution data.

* Maximum training sensitivity plus specificity.
° 10 percentile training presence.
~ Equal training sensitivity and specificity.
^ Maximum test sensitivity plus specificity.
” Equal test sensitivity and specificity.
To estimate the conservation status of each species we followed the categories and criteria of the IUCN Red List (IUCN, 2001). We again used the “Conservation Assessment Tools” extension for Arcview (Moat, 2007) to calculate the area of occupancy (AOO) of each taxon and its risk category within the state of Puebla.
Results
The distribution of Pinaceae is heterogeneous in the state of Puebla. The majority of the cells with records had more than 3 taxa. The cells with the greatest number of species (7 or 8) had 12, and 30 cells had only 1 or 2 (Fig. 1). The most widely distributed species in the state was P. teocote (35 cells), followed by P. pseudostrobus and P. pseudostrobus var. apulcensis, both occurring in 30 cells. Abies hickelii, P. douglasiana, P. greggii, and P. oocarpa are the rarest species in the state, occurring in only 1 or 2 cells (Table 2).

Figure 1 Known richness of Pinaceae in Puebla (N = 16 taxa). The tones indicate the number of species registered in each cell (10 arcminutes per side).
The species–accumulation curve had an asymptote of 16 (Fig. 2). This estimate coincides with the number of Pinaceae taxa included in the present study.

Figure 2 Accumulation curve. The circles represent the sampling units (cells of 10 arcminutes per side). The asymptote reaches 16 species. The parameters of the curve are indicated in the equation in the upper part of the figure.
The PCA of the 58 variables recovered 7 components that accumulated 85% of the variance. The 5 variables with the greatest absolute load values were identified from each of these components, resulting in the selection of 28 variables (Table 3). These variables were used for modeling.

Based on the jackknife test, the variables with the greatest contribution to modeling the distribution in the majority of species were Bio1 (mean = 13.39, standard deviation = 2.95; 10 species), CE (mean = 0.16, standard deviation = 0.10; 8 species), and MO (mean = 2.48, standard deviation = 0.86; 7 species). The remaining variables differed among the species. In some cases, only 1 variable contributed (Table 4). More-over, Bio9 and Bio18 had almost a null contribution to the modeling.
Table 4 Environmental variables that were informative in the modeling of potential distributions based on jackknife results.

The shaded cells indicate the variables that together contributed 85% of the importance per taxon.
* Variable with the greatest contribution in each taxon.
The species with the smallest potential distribution was A. hickelii, whereas that with the largest was P. teocote (Table 1; Fig. 3). The potential distribution models of the 16 taxa allowed us to generate a map (Fig. 5). The maximum potential number of taxa predicted for a cell was 10.
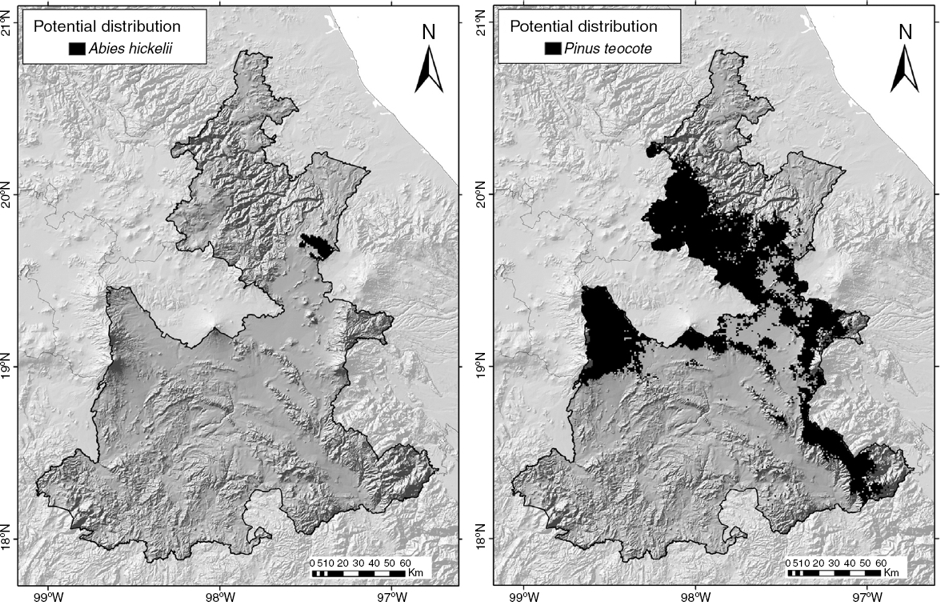
Figure 3 Species of Pinaceae with smallest (Abies hickelii; left) and largest (Pinus teocote; right) potential distributions in Puebla.
The categories of conservation according to the area of occupation ranged from Least Concern to Seriously Threatened (Table 2).
Discussion
The cells with the greatest concentration of known species of Pinaceae in the state of Puebla are concentrated in the principal elevations of the Trans-Mexican Volcanic Belt, specifically Popocatépetl, Iztaccíhuatl, Malinche, and Pico de Orizaba (Fig. 1). This is where temperate climatic conditions favor the distribution of the family (Inegi, 2004). Cells in the Sierra Norte de Puebla also stand out. Generally, species richness of Pinaceae is concentrated along the mountain chains of the Trans-Mexican Volcanic Belt and the Sierra Madre Oriental. These 2 large biogeographic regions harbor the greatest number of gymnosperms, particularly conifers (Contreras-Medina, Castañeda-Aguado, & González-Zamora, 2007; Contreras-Medina & Luna-Vega, 2007). Pinaceae is the best represented in both regions, as the family accounts for more than half of the gymnosperm species distributed there. This agrees with the principal types of vegetation in the state. The greatest percentage of species is found in pine–oak forest, pine forest, and cloud forest. The latter forest type is better represented in the Sierra Madre Oriental (Contreras-Medina & Luna-Vega, 2007; Contreras-Medina et al., 2007). These forests are considered important areas of diversity for gymnosperms, particularly the genus Pinus (Contreras-Medina & Luna-Vega, 2007; Contreras-Medina et al., 2007; Farjon & Styles, 1997; Sánchez, 2008).
The cells with the lowest species richness occur adjacent to the coastal region of the Gulf of Mexico, and in the central and southern parts of the state belonging to the Balsas Basin. The Gulf of Mexico is dominated by perennial rainforests or low-land deciduous rainforests, and the Balsas Basin by shrublands (Inegi, 2000). Some cells lacked recorded species, even when nearby cells did have records. This could be explained by the lack of sampling in these areas, by the cells lacking favorable environments for the growth of Pinaceae, or by anthropogenic factors such as change in soil use or deforestation.
The species with the most widespread distribution in the state were P. teocote and P. pseudostrobus. These were recorded in the greatest number of cells, and had the AOO of greatest extension (between 10,000 and 14,000 km2). P. teocote is widespread not only in Puebla, but throughout the country, occurring in 23 states (Contreras-Medina & Luna-Vega, 2007). In contrast, A. hickelii had an AOO of 108 km2, and P. greggii and P. oocarpa less than 20 km2, which makes these species rare in the state. Consequently, their records are very scarce, with only 2 localities recorded for these latter 2 pine species (Ramos-Dorantes, 2015). A. hickelii and P. greggii are endemic to Mexico (Farjon, 2010). The latter is restricted to the Sierra Madre Oriental (Contreras-Medina, 2004).
The species–accumulation curve predicts 16 Pinaceae taxa in the state of Puebla, which corresponds to the total number used to perform the analysis. Thus, the analysis indicates that there has been a satisfactory botanical exploration of the family in the state. Farjon (2010) reported other species as distributed in Puebla, namely P. devoniana, and P. maximinoi, and possibly P. pringlei. Each of these is reported from 1 or more of the adjacent states of Mexico, Hidalgo, or Veracruz (Farjon, 2010; Martínez, 1992). Except for 1 cultivated specimen of P. devoniana, we have not located collections of these species from Puebla (Ramos-Dorantes, 2015).
The jackknife analysis did not identify any of the 28 variables used in modeling as making a particularly strong contribution for all the species of Pinaceae. Instead, each model used a particular combination of variables. Average annual temperature (Bio01) was the most important variable for many species. For 7 it accounted for the greatest contribution (Table 4). The combination of variables that contributed to each model was so specific that we decided to treat P. pseudostrobus and P. pseudostrobus var. apulcenis independently because in addition to morphological differences, the 2 taxa occur in different environments, with P. pseudostrobus var. apulcensis tending to occur in more semi-arid areas. The jackknife analysis showed that the informative variables differed between the 2 taxa. In P. pseudostrobus var. pseudostrobus, mean temperature of the dry months (TS) contributed most to modeling its distribution, whereas in P. pseudostrobus var. apulcensis the most important variable was mean temperature of coldest quarter (Bio11). Because the environmental conditions that influence the distribution of these taxa are different, their potential ranges are different, with P. pseudostrobus var. apulcensis more widespread in central areas of the state, and P. pseudostrobus var. pseudostrobus more widespread in the north and southeast (Fig. 4).

Figure 4 Potential distribution of Pinus pseudostrobus (left) and P. pseudostrobus var. apulcensis (right) in Puebla.

Figure 5 Potential distribution of Pinaceae in Puebla (N = 16 taxa). The tones indicate the number of potential species.
The results have a pattern generally similar to the known richness, except that in some sites more species are predicted than are currently recorded. The regions with the greatest richness are predicted to potentially contain 7–10 species, and areas with fewer species coincide with those of lesser known richness. The models predict suitable areas for Pinaceae where no records were found, such as the border with the state of Veracruz, northeast of Pico de Orizaba, and the mountainous region west of Tehuacán. Botanical exploration in these areas is needed to improve our understanding of the patterns of distribution of the family in the state. The potential distribution area for species with fewer than 7 records, such as A. hickelii, for which the models included records from neighboring states, had small ranges (204 km2) within the state (Fig. 3). By contrast, taxa such as P. pseudostrobus var. apulcensis, with 46 records exclusive to Puebla, had a wide potential distributional area (9,897 km2) (Table 2).
The AOO of each species was only estimated for the state of Puebla. This regional focus offers relevant information for the conservation of these species that could be taken into account by local conservationists and authorities. Of all taxa, 4 had an AOO greater than 10,000 km2 (P. patula, P. pseudostrobus, P. pseudostrobus var. apulcensis, and P. teocote), placing them in the category of Least Concern, whereas the remaining species were placed in a risk category. Six species are Near Threatened (A. religiosa, P. ayacahuite, P. cembroides, P. hartwegii, P. leiophylla, and P. montezumae), 2 species are in the category of Vulnerable (P. chiapensis and Pseudotsuga menziesii var. glauca), 2 species are Endangered (A. hickelii and P. douglasiana), and 2 species are Critically Endangered (P. greggii and P. oocarpa). Records for P. greggii and P. oocarpa in the state are scarce (Ramos-Dorantes, 2015) and their current AOO is very restricted (<5 km2). These regional categories agree in some cases with the IUCN Red List (IUCN, 2014) at the global level, as is the case of P. greggii and A. hickelli, because within the country their distribution is restricted to only a few states (Farjon & Filer, 2013). By contrast, the evaluation of the regional level of risk for species in Puebla differs from the global evaluation in the cases of P. oocarpa and P. douglasiana, categorized as Least Concern because they have wide distributions at the national level (Farjon & Filer, 2013). One reason why P. greggii and P. oocarpa are categorized as Critically Endangered for Puebla is that in this study the only collections recorded were from montane cloud forest (Farjon, 2010; Ramos-Dorantes, 2015). This vegetation type is restricted in the state, making up approximately 2.1% of its area (Inegi, 2000). Fortunately, the models predict a larger potential AOO for these species with few records. For most of them the AOO is double, although more botanical exploration is needed to confirm their presence in these areas. Unfortunately, a substantial loss of natural vegetation is apparent in the soil use and vegetation maps (Inegi, 2000), which indicate that 78% of the state’s area has been converted to crops, pastures, and urban areas.
Climate change and population growth are also expected to bring as a consequence the destruction of natural habitats and thus the potential distribution could diminish for all these species, not only for those with a restricted distribution. Conservative climate change scenarios predict a temperature increase of up to 1.7 °C, whereas the most severe scenarios predict up to 4.8 °C (IPCC, 2014). This, coupled with an increase in the human population, which could reach between 9 and 13.2 billion people by 2100 (Gerland et al., 2014), could bring losses in biodiversity. The various possible effects of climate change may operate at different scales, from biomes, ecosystems, communities, species, populations or individuals, affecting their current distribution (Bellard, Bertelsmeier, Leadley, Thuiller, & Courchamp, 2012). An estimated 60–70% of temperate forests and other vegetation types in Mexico are predicted to be affected by climate change, with the tendency of species with temperate climate affinities to reduce their distribution (Villers-Ruíz & Trejo-Vázquez, 1998, 2004). As such, distribution models under climate change scenarios would be useful for predicting how the distribution of the family in the state would change. Conabio has recognized several terrestrial regions of priority (RTP’s) for conservation within Puebla, such as the montane cloud forests of the Sierra Madre Oriental, Malinche, Cuetzalan, and Pico de Orizaba (Arriaga et al., 2000). These regions coincide with the areas of highest known species richness (Fig. 1) and potential richness (Fig. 5) of Pinaceae. Thus, conserving these regions would protect the species richness of the family in Puebla. However, it is also important to create individual conservation programs for the species with restricted distributions in the state.
Forests are the natural vegetation type of greatest coverage in Puebla (17.5%), and of these, conifer forests have the greatest extension, with 9.7% (Inegi, 2000). Although the status of other conifer families is unknown for the state, the present study suggests that botanical exploration of Pinaceae has been relatively satisfactory. It is possible that our knowledge of the taxa present in Puebla is nearly complete.

