


 nueva página del texto (beta)
 Inglés (pdf)
 Artículo en XML
 Referencias del artículo
 Enviar artículo por email
 Citado por SciELO
  Similares en
SciELO
Similares en
SciELO 
 Permalink
Introduction
Nectar constitutes the most important energy source that plants offer to pollinators (Simpson & Neff, 1983). The 3 most common and abundant sugars in nectar are by far the hexose monosaccharides glucose and fructose, and the disaccharide sucrose (Baker & Baker, 1983). The sugar composition and other characteristics of nectar vary with biochemical, ecological and evolutionary factors (Baker, Baker, & Hodges, 1998; Nicolson, 1998; Ornelas, Ordano, De-Nova, Quintero, & Garland, 2007).
Biochemically, sugar composition of nectar may vary due to changes in the activity of nectary enzymes and to osmoregulation processes caused by the osmotic pressure generated by the different sugars (Nicolson, 1998; Nicolson & Flemin, 2003). Nectar sugars are derived from sucrose translocated in phloem sap. Sucrose is either secreted into nectar, or it is hydrolyzed in the nectary walls by the activity of invertase enzymes into glucose and fructose (De la Barrera & Nobel, 2004; Nicolson, 2002). As a result, the final sugar composition of nectar is determined by both the activity and amount of invertase enzyme in the nectary (Sturm & Guo-Qing, 1999; Woodson & Wang, 1987). Sucrose hydrolysis into hexoses may increase nectar osmolality, causing water to move from the nectary walls into nectar and thus resulting in more dilute nectars (Nicolson, 1998, 2002). As consequence, nectar sugar composition could affect other nectar traits such as volume and concentration. For example, a dichotomy among volume and concentration with sugar composition has been observed in bird-pollinated flowers in which dilute and copious nectar is generally hexose-rich, while concentrated and less copious nectar is usually sucrose-rich (Baker & Baker, 1983; Lotz & Schondube, 2006; Martínez-del Río, Baker, & Baker, 1992; Nicolson, 1998; Nicolson & Flemin, 2003). Nevertheless, this pattern has not been evaluated for chiropterophilic plants.
The variation in sugar composition, nectar volume and nectar sugar concentration also are affected at ecological and evolutionary levels by plant mechanisms that are selected based on nectar production costs and by their pollinators’ physiology. Several authors have stated that nectar production is costly for plants in terms of the amount of energy invested (Ashman & Shoen, 1997; Pleasants & Chaplin, 1983; Southwick, 1984). However, it has also been suggested that nectar production could have small energetic costs (Golubov, Mandujano, Montaña, López-Portillo, & Eguiarte, 2004; Pyke, 1992). Differences in nectar volume on the basis of a cost-benefit balance, has been also explained in which plants are “fitter” when they produce the smallest possible nectar volume to attract their pollinators (Lanza, Smith, Sack, & Cash, 1995).
Additionally, preferences of nectar-feeding foragers, based both on their morphology and physiology, also could have selective effects on the evolution of nectar characteristics (Baker & Baker, 1983; Baker et al., 1998; Erhardt, 1991; Faegri & van der Pijl, 1979; Heinrich & Raven, 1972; Martínez-del Río, Stevens, Daneke, & Andreadis, 1988; Martínez-del Río et al., 1992; Martínez-del Río, Schondube, & McWhorter, 2001; Ornelas et al., 2007). However, in the case of Neotropical nectarivorous bats, no evidence has been found of bats preferring the dominant sugars (glucose and fructose) present in the nectar they commonly ingest in nature (Herrera, 1999; Rodríguez-Peña et al., 2007). These findings cast a shadow of doubt on the validity of the hypothesis that bats’ preferences could act as a selective pressure on the nectar composition of the plants they visit. The prevalence of hexose-dominated nectars among bat-pollinated plants in the Neotropics is an ecological pattern that remains to be explained.
The goal of our study was to analyze nectar traits (i.e. nectar sugar composition and concentration) of chiropterophilic plants, and use this information to understand how these traits could be influenced by biochemical and ecological factors. We analyzed data on the nectar traits of 49 Neotropical plant species that present chiropterophilic flowers. We used the data to evaluate: (1) the relationship between nectar traits (nectar concentration and sugar composition), and (2) the relationship between nectar traits and flowering strategies. First, we hypothesized that because chiropterophilic plant species produce dilute nectars with a greater proportion of hexoses than sucrose (Baker et al., 1998), the nectar concentration will be positively related with sucrose and negatively related with glucose and fructose (Nicolson, 1998). Second, because the hydrolysis of sucrose produces 1 molecule of glucose and 1 molecule of fructose (Nicolson, 2002), chiropterophilic nectars will show equal amounts of glucose and fructose, and the content of hexoses will show a negative relationship with the content of sucrose. Third, because flowering strategies and nectar traits are related to reproductive costs (Southwick, 1984), we predicted that plant species with high flower production should produce dilute nectar with low sucrose proportions, whereas plant species with low flower production will produce more concentrated nectar with greater sucrose proportions.
Materials and methods
Nectar samples were collected from flowers of the 12 plant species that conform most of the annual diet of nectarivorous bats at the Chamela-Cuixmala Biosphere Reserve in the central Pacific coast of Mexico (ca. 19°22′-19°35′ N, 104°56′-105°03′ W; Stoner, Salazar, Fernández, & Quesada, 2003). The predominant vegetation in the reserve is tropical dry forest, which consists mainly of tropical lowland deciduous forest with patches of riparian forest (Lott, 1993). At our study area we collected a total of 703 flowers from 12 plant species belonging to 5 families (Table 1). The number of flowers sampled per plant was variable because of differences in the flowering strategies among species, and the differences in the number of open flowers per night among individuals. The minimum number of flowers collected was 7 for Acanthocereus occidentalis and Stenocereus chrysocarpus (Cactaceae), while the maximum number of flowers collected was 240 for Ceiba pentandra (Malvaceae). For details on flowering strategies of plant species see Stoner et al. (2003).
Table 1 Nectar traits of 12 chiropterophilic plant species in the Tropical Dry Forest at the Chamela-Cuixmala Biosphere Reserve. Nectar volume was measured 1h after anthesis with glass capillary tubes (µl); (mean±SD) (range) (number of flowers). Concentration: mean±SD (values range) (number of flowers). Energy contained in nectar was obtained by multiplying the total concentration values by each sugar type values and then, multiplied by their molar enthalpy value (2,813.1 and 5,647; for hexoses and sucrose, respectively; Domalsky, 1972). Energy values where referred to are 100ml of nectar (kJ), and/or to mean energy per flower (in relation to the original volume found in each flower in kJ). Sugar ratios and nectar type: sucrose-dominant (SD)=sucrose/(glucose+fructose) ratio is greater than 0.999; sucrose-rich (SR)=ratios between 0.5 and 0.999; hexose-rich (HR)=ratios between 0.1 and 0.499; and hexose-dominant (HD)=ratios less than 0.1).
| Family and species | Nectar volume (µl)Mean ± SD | Nectar concentration (°Brix)Mean ± SD | Fructose (%)Mean ± SD | Glucose (%)Mean ± SD | Sucrose (%)Mean ± SD | Energy contained in 100 ml of nectar (kJ)Mean ± SD | Energy/flower (kJ)Mean ± SD | Sugar ratio (n) | Flowering duration/no. of flowers (months/n) |
|---|---|---|---|---|---|---|---|---|---|
| Bignoniaceae | |||||||||
| Crescentia alata | 115.47 ± 11.38 (15-580/n = 104) |
20.05 ± 0.39 (12-27/n = 81) |
41.03 ± 0.70 | 29.25 ± 1.09 | 29.72 ± 1.58 | 310.55 ± 56.27 (n = 80) |
4.96 ± 3.22 (n = 80) |
3/743 | 1/50 |
| Malvaceae | |||||||||
| Ceiba grandiflora | 120.26 ± 19.51 (24.3-584.2/n = 240) |
18.03 ± 0.93 (5-25/n = 28) |
46.82 ± 0.86 | 39.43 ± 1.60 | 13.75 ± 1.91 | 295.76 ± 75.69 (n = 28) |
4.12 ± 2.93 (n = 28) |
4/875 | 9/10 |
| Ceiba pentandra | 127.44 ± 3.26 (19-300/n = 240) |
16.66 ± 0.17 (3-25/n = 229) |
48.51 ± 0.42 | 23.37 ± 0.53 | 28.13 ± 0.67 | 264.65 ± 46.83 (n = 220) |
3.36 ± 1.42 (n = 220) |
1/595 | 1/500 |
| Ceiba aesculifolia | 579.22 ± 19.05 (220-1040/n = 83) |
16.85 ± 0.09 (14-18.8/n = 83) |
49.82 ± 0.63 | 47.18 ± 0.90 | 2.99 ± 0.96 | 265.68 ± 14.16 (n = 81) |
15.21 ± 4.67 (n = 81) |
0 | 2/25 |
| Pseudobombax ellipticum | 214.07 ± 24.41 (20-660/n = 41) |
15.44 ± 0.35 (8-19/n = 38) |
38.33 ± 1.80 | 26.41 ± 1.81 | 35.26 ± 2.63 | 246.24 ± 34.60 (n = 38) |
5.55 ± 3.82 (n = 38) |
13/987 | 2/25 |
| Helicteres baruensis | 35.21 ± 9.09 (10-120/n = 16) |
14.43 ± 0.37 (13-16.5/n = 12) |
39.74 ± 0.74 | 27.80 ± 1.44 | 32.46 ± 1.74 | 229.88 ± 19.98 (n = 12) |
1.38 ± 0.75 (n = 12) |
3/100 | 4/5 |
| Cactaceae | |||||||||
| Acanthocereus occidentalis | 22.05 ± 8.33 (10.8-68.7/n = 8) |
27.13 ± 1.44 (24-33/n = 6) |
28.97 ± 3.36 | 17.06 ± 3.14 | 53.98 ± 6.33 | 451.60 ± 50.28 (n = 6) |
1.88 ± 0.82 (n = 6) |
13/100 | 3/10 |
| Pachycereus pecten | 57.06 ± 13.09 (24.4-204.2/n = 20) |
25.86 ± 1.15 (18-31/n = 11) |
49.08 ± 1.77 | 36.80 ± 3.14 | 14.12 ± 4.26 | 418.71 ± 57.84 (n = 11) |
3.66 ± 2.29 (n = 11) |
4/475 | 1/6 |
| Stenocereus chrysocarpus | 26.47 ± 10.80 (53-114.3/n = 7) |
22.32 ± 0.69 (21-24/n = 5) |
39.90 ± 1.21 | 41.85 ± 4.02 | 18.26 ± 4.05 | 352.02 ± 21.52 (n = 5) |
2.81 ± 1.09 (n = 5) |
11/350 | 3/5 |
| Stenocereus standleyi | 48.86 ± 8.34 (10.6-196.6/n = 25) |
24.88 ± 0.39 (22-29/n = 18) |
38.42 ± 1.02 | 32.66 ± 1.42 | 28.93 ± 1.69 | 395.89 ± 27.37 (n = 18) |
2.50 ± 1.70 (n = 18) |
13/761 | 1/10 |
| Fabaceae | |||||||||
| Bauhinia pauletia | 141.82 ± 8.94 (30-340/n = 82) |
18.12 ± 0.14 (14.8-20.5/n = 82) |
36.05 ± 0.75 | 25.83 ± 1.05 | 38.11 ± 1.16 | 236.43 ± 21.13 (n = 81) |
4.13 ± 2.32 (n = 81) |
7/900 | 1/50 |
| Bauhinia ungulata | 165.5 ± 24.9 (n = 10) |
32.00 ± 1.57 | 23.89 ± 2.01 | 44.10 ± 1.26 | 21/913 | ND | |||
| Convolvulaceae | |||||||||
| Ipomoea ampullaceae | 126.38 ± 10.51 (65-240/n = 18) |
24.42 ± 1.03 (11-30.8/n = 18) |
46.58 ± 1.68 | 40.93 ± 2.63 | 12.49 ± 2.50 | 421.42 ± 68.95 (n = 18) |
4.82 ± 1.94 (n = 18) |
7/900 | 4/5 |
To collect the nectar samples we covered mature flower buds using mesh bags 1 h before sunset. One hour after anthesis nectar was extracted, and its volume was measured with glass capillary tubes (µl). Nectar was then placed on Whatman No. 1 filter paper to dry and then maintained in a dry place until sugar composition analysis was performed. Nectar concentration and sugar composition were measured for each flower collected. One drop of nectar was placed on a Leica® hand refractometer and nectar concentration was measured in sucrose equivalents (% sugar = [sugar mass/total mass] × 100). Nectar samples were rehydrated with water and their sugar composition was analyzed using the Medium Infrared Reflectance Method (MIR). Samples were processed in a Spectrum 2000 FT spectrophotometer (Perkin Elmer, Boston, MA, USA; following Flores, Peñalosa, Hernández, Dávila, & Arizmendi, 2003). Multidimensional statistical analysis was performed with Quant software (Nicolet, Madison, WI, USA) using the Partial Least Squares (PLS) algorithm to determine sugar composition. The spectra modifications employed were normalized with a baseline correction using the second derivative, and suppression of the signals of water and carbon dioxide (Flores et al., 2003). Sugar ratios were obtained (sucrose to glucose plus fructose: S/G + F) to compare nectar sugar ratios between plant species. We recognized 4 classes of nectar: (1) sucrose-dominant nectars, when the sucrose/(glucose + fructose) ratio was greater than 0.999; (2) sucrose-rich nectar, when the ratio was between 0.5 and 0.999; (3) hexose-rich nectar, when the ratio was between 0.1 and 0.499, and (4) hexose-dominant nectar, when the ratio was less than 0.1. We used the terminology of Baker and Baker (1983) to facilitate the comparison of our results with previous studies. However, we also included the individual sugar percentages for all plant species as suggested by Nicolson and Thornburg (2007).
We calculated the energy contained in nectar by multiplying the total concentration values by each sugar values obtained by medium infrared (Flores et al., 2003); then, multiplied by their molar enthalpy value (−2,813.1 and −5,647; for hexoses and sucrose, respectively; Domalsky, 1972). Energy values where referred to 100 ml of nectar (kJ), and/or to mean energy per flower (in relation to the original volume found in each flower in kJ). Additionally, we obtained data of the nectar traits and flowering strategies of 37 chiropterophilic plant species (belonging to 13 families). We obtained this information from a broad review of the available literature using ‘bat pollinated’, ‘chiropterophilic plant’, ‘nectar trait’, ‘nectar concentration’, ‘nectar volume’ and ‘nectar sugar composition’ as key words in Academic Google searcher and the ISI Web of Science online databases (Appendix).
To identify interspecific relationships between nectar concentration and sugar composition, we used phylogenetically independent contrasts (PICs; Felsestein, 1985; Garland, Harvey, & Ives, 1992). This phylogenetic comparative method allowed us to control for phylogenetic inertia (Harvey & Pagel, 1991). We first built a preliminary phylogeny of the plant species included in our analysis using the on-line phylogenetic tool “phylomatic” (http://www.phylodiversity.net;Webb & Donoghue, 2004), based in the angiosperms super tree, constructed with the chloroplast rbcL gene (Davis et al., 2004). We applied the maximum resolution for the seed plant phylogenetic tree. In order to obtain a fully dichotomous phylogeny, we improved the preliminary phylogeny by randomly solving polytomies (Grafen, 1992). Since some of the plant species we analyzed in this study have not been considered previously in phylogenetic studies, the branch lengths of our phylogeny were unknown. We therefore assigned a length of 1 to all branches, as suggested by Garland et al. (1992). We used the percentage of glucose, fructose and sucrose as response variables, and nectar concentration as the independent explanatory variable, including data from all 49 chiropterophilic plant species. Nectar volume was not considered in the analysis because data was available from only 8 out of 37 plant species in the literature and due to differences in sampling methodologies between the different studies (Table 1; Appendix).
To determine whether nectar concentration and sugar composition were associated with the flowering strategies of the chiropterophilic plant species, we performed a multivariate analysis of variance (Manova), where nectar traits were the response variables and flowering strategy was the explanatory factor. We characterized the flowering strategies of the 12 species analyzed in this study, either as steady state or low flower producers (lesser than 30/night per individual on average) and Big bang or high flower producers (greater than 50/night per individual; Stoner et al., 2003), and included the information we gathered from the literature for the 37 plant species previously reported in the literature (Appendix). All analyses were performed using R (R Development Core Team, 2006).
Results
Nectar traits from the chiropterophilic plants at the Chamela-Cuixmala Biosphere Reserve in the central Pacific coast of Mexico. Mean nectar volume values ranged from 37.3 ± 7.54 µl in A. occidentalis (Cactaceae) to 579.23 ± 19.06 µl in Ceiba aesculifolia (Malvaceae). The mean nectar concentration values ranged from 14.46 ± 0.36% in Helicteres baruensis (Malvaceae) to 28 ± 1.31% in A. occidentalis (Cactaceae). Mean fructose content values ranged from 28.97 ± 3.14% in A. occidentalis (Cactaceae) to 49.82 ± 0.63% in C. aesculifolia (Malvaceae), while mean glucose content values ranged from 17.06 ± 2.93% in A. occidentalis (Cactaceae) to 47.18 ± 0.90% in C. aesculifolia (Malvaceae). Fructose content was higher than glucose content in all species, except in S. chrysocarpus (Cactaceae). Mean sucrose content values ranged from 2.99 ± 0.96% in C. aesculifolia (Malvaceae) to 53.98 ± 5.92% in A. occidentalis (Cactaceae). Finally, mean energy values ranged from 229.88 ± 19.98 (kJ) in H. baruensis (Malvaceae) to 451.60 ± 50.28 (kJ) in A. occidentalis (Cactaceae) when referred to 100 ml of nectar. However, when energy mean values where referred to energy media per flower, values ranged from 1.88 ± 0.82 (kJ) in A. occidentalis (Cactaceae) to 15.21 ± 4.67 (kJ) in C. aesculifolia (Malvaceae).
After classifying all of the 49 chiropterophilic plant species in relation to their sugar content, we obtained the following distribution: 1 sucrose-dominant species, 6 sucrose-rich species, 31 hexose-rich species, and 11 hexose-dominant species. Twenty-seven plant species showed greater contents of fructose than those of glucose, 21 had more glucose than fructose, and only Mucuna andreana (Fabaceae) presented equal amounts of fructose and glucose. Total nectar concentration showed a normal distribution with a mean value of 18.62 ± 7.48% (Fig. 1). The total percentage of sucrose in nectar showed a normal left-skewed distribution, with a mean value of 16.03 ± 10.54%. Sugar concentration from hexoses showed a normal right-skewed distribution with an average value of 73.26 ± 24.52% (41.37 ± 9.90%, 38.33 ± 11.32% for fructose and glucose, respectively).
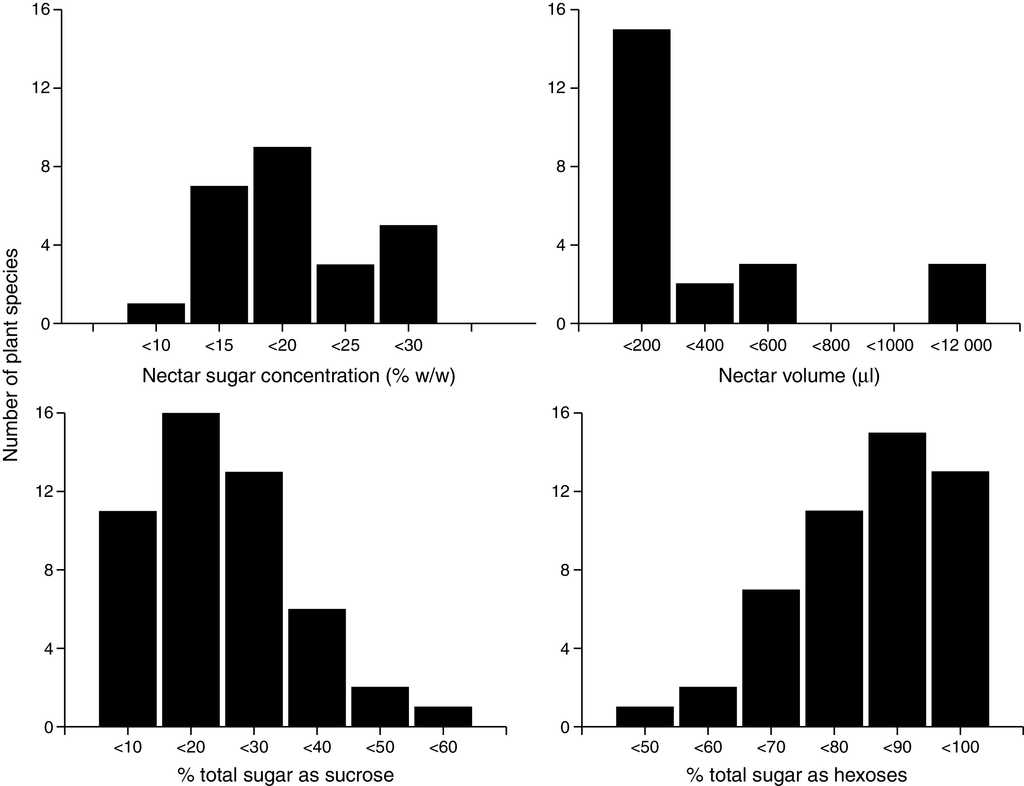
Figure 1 Nectar sugar concentration (% w/w) and sugar composition (% total sugar as sucrose and hexoses) mean values per species of quiropterophilic plants.
PCI's showed that nectar concentration was negatively related to glucose content (β ± SE = −1.33 ± 0.47, t 18 = 2.86, p < 0.05) and positively related to the amount of fructose in solution (1.19 ± 0.25, t 18 = 4.72, p < 0.01). We found no relationship between nectar concentration and sucrose content. We found that sucrose content was negatively related to both glucose and fructose contents in nectar (−0.707 ± 0.09, t45 = −7.073, p < 0.01 and −0.21 ± 0.11, t45 = −2.076, p < 0.05 for glucose and fructose, respectively). Finally, glucose content was negatively related to fructose content (−0.35 ± 0.19, t45 = −1.81, p < 0.05).
The multivariate analysis of variance revealed that nectar traits of the different chiropterophilic plant species were not related to their flowering strategy (F4,30 = 0.79, p = 0.54).
Discussion
The role of the biochemical and ecological factors that influence nectar traits in chiropterophilic plants has been poorly studied. Here, we found a general pattern in which Neotropical chiropterphilic plant species produce mainly hexose rich or hexose dominant nectars. We only found nectars with a greater amount of sucrose than hexoses in 7 out of 49 plant species. As we predicted, we found a negative relationship between nectar concentration and glucose content, and a negative relationship between sucrose and both glucose and fructose contents. Contrary to our expectations we found a positive relationship between nectar concentration and fructose content, no relationship between nectar concentration and sucrose content and a negative relationship between glucose and fructose contents. Similarly, we found no evidence that nectar traits of the different plant species were related to plant flowering strategy. In the following section we first discuss the role that biochemical factors could have on Neotropical chiropterophilic nectar sugar composition. Then, we comment on the relationship between flowering strategies and nectar traits. Finally, we discuss the relationship between the nectar characteristics of chiropterophilic plants and neotropical bats’ evolution and physiology.
The role of biochemical factors on nectar sugar composition
As predicted, we found a negative relationship between sucrose and both glucose and fructose contents. This relationship can be explained considering that nectar sugars are derived from sucrose translocated from the phloem sap (De la Barrera & Nobel, 2004). Sucrose is either secreted into nectar, or it is hydrolyzed into hexoses by the activity of invertase enzymes (De la Barrera & Nobel, 2004; Nicolson, 2002). As a result, the final sugar composition of nectar is determined by both the activity and amount of invertase enzyme present in the nectary walls (Sturm & Guo-Qing, 1999; Woodson & Wang, 1987). The hydrolysis of sucrose by the invertase enzymes renders 1 molecule of glucose and 1 molecule of fructose, per each sucrose molecule. However, we found that 48 out of the 49 species included in this study showed different proportions of glucose and fructose. Our results are similar to the sugar ratios found in some bird and insect-pollinated plants, which have different proportions of glucose and fructose (Chalcoff, Aizen, & Galetto, 2006; Lüttge, 1962; Wenzler, Hölscher, Oerther, & Schneider, 2008).
Three mechanisms may explain this pattern of asymmetric content of glucose and fructose in Neotropical chiropterophilic plants: (1) the biochemical effect of spontaneous mutarotation of hexoses (Ma, Schaefer, & Allinger, 1998). The stability of cyclic forms of hexoses is differential, and glucose and fructose can take on pyranose and furanose forms, respectively. The most stable form of the minimized model in the gas phase corresponds to fructose (furanose); however, in aqueous solutions the pyranose form of glucose has greater stability (Ma et al., 1998). Notwithstanding the above, there are no studies on the differential stability of cyclic forms of hexoses in nectar; (2) the presence of additional enzymes as acidic phosphatases and transporters must be involved in generating the chemical composition of nectars (Ziegler, 1956), and (3) the action of microorganisms present in nectar. It has been reported that the biochemical action of some yeasts and bacterial species inhabiting the nectar could change its sugar composition (Pozo, Lievens, & Jacquemyn, 2014), and this may occur in chiropterophilic nectars.
However, we found that glucose and fructose contents were negatively related. This result can be associated with: (1) the cycling of the different sugars taking place in nectary cells once that the enzyme invertase has hydrolyzed sucrose. After sugar uptake in the parenchyma cells, fructose could be directly phosphorylated, and half of the fructose-6-phosphate seems to be converted to glucose-6-phosphate (Wenzler et al., 2008). Then, glucose-6-phosphate could be used as sugar for nectar secretion; (2) the glucose decrease could be explained by the simple metabolic consumption of glucose in the phloem symplasm, which contains an operational glycolytic pathway (Geigenberger et al., 1993). And by the leaking and retrieval of sugars during phloem transport associated with sucrose formation in the parenchyma of the vascular bundles (Ayre, Keller, & Turgeon, 2003; Wenzler et al., 2008), and (3) in the nectary glucose or fructose (indistinctly) can enter into the glycolysis, gluconeogenesis, and pentose phosphate pathways (Wenzler et al., 2008).
Unexpectedly, our results showed that nectar concentration was negatively related to glucose content, positively related to fructose content and not related to sucrose content. While the negative relationship between glucose content and nectar concentration was expected, and could be created by an osmotic disbalance during the hydrolysis of sucrose in the nectary (Nicolson, 1998; Nicolson & Flemin, 2003), a positive relationship between nectar concentration and fructose content was completely unexpected. Unfortunately, no mechanisms have been proposed that could explain our results. Therefore, more work needs to be conducted on the mechanisms associated to nectar secretion in Neotropical plants.
The role of flowering strategies on nectar traits
Contrary to our hypothesis, we found no relationship between chiropterophilic plant flowering strategies and nectar sugar concentration and composition. Our results agree with those suggesting that nectar production implies small energetic costs to the plants (Golubov et al., 2004; Pyke, 1992). In this sense, historical factors of the different chiropterophilic plant species could have played a stronger influence on nectar composition than the flower production strategies adopted by the different plant species (Baker et al., 1998; Harvey & Pagel, 1991). Although, this assessment may be true for sugar composition and nectar concentration, this hypothesis remains to be studied considering nectar volume.
The relationship between the nectar characteristics of chiropterophilic plants and neotropical bats’ evolution and physiology
As we mentioned beforehand, a dichotomy involving nectar concentration and sugar composition has been observed in bird-pollinated flowers. In this dichotomy dilute and copious nectars are generally hexose-rich, while concentrated and less copious nectars are usually sucrose-rich (Nicolson, 1998, 2002). Here, we found a different pattern for chiropterophilic plant species. The differences between the nectar characteristics of ornithophilic and chiroptepophilic plants could be the result of important differences in the evolution of bird, and New-world bat pollination systems: (1) bird pollination started much earlier than New-world bat pollination. Pumiliornis tessellates is the earliest fossil of a nectar-eating bird with an age of 47 million years (Mayr & Wilde, 2015). While New-world bats (family Phyllostomidae) are only 39 million years old (Jones, Bininda-Emonds, & Gittleman, 2005, Teeling et al., 2005). Dávalos (2004) has estimated that nectar-eating bats (subfamily Glossophagine) are between 12 and 17 million years old. This difference in time could have allowed for the development of a much stronger plant-pollination relationship in birds than in bats, allowing for bird pollinated plants to show clear patterns of nectar characteristics that do not exist in the case of chiropterophilic plants. Also, differences in the physiological capacities of nectar-eating birds and New-world nectarivorous bats could be responsible for molding nectar characteristics differently in these 2 pollination systems. Since bird nectar specialists can use all nectars efficiently, regardless of their sugar composition and concentration, they are not a selective force on the evolution of nectar traits. In this pollination system, non-specialized birds have acted as a selective force for dilute hexose dominated nectars in several groups of plants (Bruneau, 1997; Dupont, Hansen, Rasmussen, & Olesen, 2004; Lotz & Schondube, 2006). Interestingly, the New-world bat pollination system involves less than 30 species of 1 family of bats (Phyllostomidae). All are nectar specialists that have high capacities to assimilate sucrose and hexoses (Schondube, Herrera, & Martínez-del Río, 2001), and are able to efficiently use nectars with different sugar compositions and concentrations (Ayala-Berdon & Schondube, 2011). As a result, the lack of a dichotomy in nectar sugar concentration and composition in chiropterophilic plants could be the result of neotropical nectar-eating bats being able to use nectars with different sugar compositions. By doing so, these animals, instead of molding nectar biochemical characteristics, could have released the plants they pollinate from the selective pressures generated by other less specialized pollinators, creating the lack of pattern we found in this study.

