


 nova página do texto(beta)
 Inglês (pdf)
 Artigo em XML
 Referências do artigo
 Enviar este artigo por email
 Citado por SciELO
  Similares em
SciELO
Similares em
SciELO 
 Permalink
Introduction
Synanthropic species are those able to adapt to a variety of human activities to ensure their growth, often extending their natural distribution into habitats such as houses, farms, gardens, roadsides, and garbage dumps (Di Castri, Hansen, & Debussche, 1990). Urbanization is associated with a variety of effects, such as pollution, drainage, watercourse diversion, and fragmentation and habitat loss may decrease, extinguish or allow the expansion of certain groups (McIntyre, 2000). However, arthropods in urban systems can be species rich, because of local conditions, and temperature, humidity and available resources determine their distribution in the urban environment, in some cases limiting their abundance (Melic, 1997; Robinson, 2005). Primarily, anthropogenic activities have favored certain habitats and colonization by particular groups of arthropods, promoting not only their abundance but also their diversity.
Despite the fact that accelerating urbanization is considered one of the main causes of biodiversity loss, it is unknown whether the changes caused by urbanization similarly affect biodiversity worldwide (Magura, Tóthmérész, Hornung, & Horváth, 2008). Thus, the study of arthropod populations in urban environments is important to determine the influence of urbanization on these organisms (Magura et al., 2008). One of the most diverse arthropod groups is spiders. They are distributed worldwide and have colonized every ecological environment, except the open ocean, the Arctic and Antarctica. There are even species found in semi-aquatic environments (Foelix, 2011; Robinson, 2005; Spagna, Crews, & Gillespie, 2010). Spiders comprise 45,618 species worldwide (World Spider Catalog, 2015), being the second most diverse order of arachnids after mites (Coddington & Colwell, 2001; Coddington & Levi, 1991; Francke, 2014). Many of them have successfully adapted to urban areas, because some aspects of their biology give them an advantage for transitioning from natural, wild or semi-wild habitats to urban environments, colonizing new habitats created by humans (Desales-Lara, Francke, & Sánchez-Nava, 2013; Durán-Barrón, Francke, & Pérez-Ortiz, 2009). Additionally, spiders are predators (Coddington & Levi, 1991; Foelix, 2011) that help stabilize insect populations (Foelix, 2011).
Studies of urban spiders have been conducted in various parts of the world. Guarisco (1999) recorded 74 species of synanthropic spiders in Kansas, United States. In Europe, Urák (2005) cited 2 invasive species in Romania, and Kostanjšek and Celestina (2008) recorded 4 species of urban spiders in Slovenia. There are several studies of synanthropic spiders from Brazil. Brazil et al. (2005) recorded 13 species and 17 morphospecies in 3 cities in Bahia with different degrees of urbanization, and Melo et al. (2010) recorded 170 species and morphospecies of spiders in the city of Salvador in the Brazilian Atlantic Forest, which is under pressure from urbanization. In the Caribbean, Armas (2003) recorded 31 species of spiders inside and outside of a single house in San Antonio de los Baños, Havana Province, Cuba.
In Mexico, Jiménez (1998) recorded 42 species of spiders for the interior and exterior of 32 houses in La Paz, Baja California Sur; Durán-Barrón et al. (2009) recorded 63 species of spiders associated with human housing in México City and State of Mexico, and Desales-Lara et al. (2013), recorded 28 species and 13 morphospecies of spiders in the municipality of Toluca, State of Mexico. The latter study used a systematized method to collect spiders inside houses considering 4 environments with different degrees of urbanization and demonstrated that spider diversity is higher in houses with gardens in an urban environment.
The goal of this work was to study the diversity of spiders in different degrees of urbanization in the city of Chilpancingo to answer the following questions: (1) Which of the species of spiders are found in the urban, suburban and rural zones? (2) What is the diversity and abundance of spiders in these zones? (3) Is there seasonal variation in the diversity and abundance of spiders? (4) Are there any differences in spider abundance between the first and the second levels of the houses?
Materials and methods
The city of Chilpancingo de los Bravo is the capital of the state of Guerrero, Mexico, located centrally between 17°33′00″ N, 99°30′04″ W, with an elevation of 1,253 m above sea level. The native vegetation type is deciduous tropical forest in the lowlands and Quercus sp. forest in highland zones with different levels of succession. There are 2 types of climate: climate (A )C (w0 ) (semi-warm humid with rain in summer), with an annual temperature between 18 °C and 22 °C, and a temperature for the coldest month greater than 18 °C; and climate Aw1 (warm humid with rain in summer) with an average annual temperature greater than 22 °C and the temperature of the coldest month is greater than 18 °C (García, 2004).
Zone categorization was accomplished according to the law of Municipal Cadastre of Guerrero No. 676, issued in 2007, which divides the city into 3 zones: urban, suburban and rural. For this study, we categorized 4 sampling zones: urban with a garden, urban without a garden, suburban, and rural. We followed the systematized collecting method used by Desales-Lara et al. (2013), with some modifications. For each of the sampling zones, 4 houses were sampled, with the exception of the urban zone where 4 additional homes with gardens were chosen to determine whether a garden increases the presence and diversity of spiders. For each sampling zone, 2 houses of 2 stories and 2 houses of 1 story were selected. In total, 16 houses were sampled (Fig. 1).

Figure 1 Location of the sampled houses for each categorized zone in the city of Chilpancingo de los Bravo, Guerrero, Mexico. Circles represent the ratio of the radius where the sampling zones were located in relation to the center of the city. Taken and modified from Geostatistical urban mapping, Economic Census 2009, Denue, March 2011, Inegi, 2012.
Sampling was conducted from July 2013 to May 2014 with a total of 6 sampling times: 3 in the rainy season (July, September, and November of 2013) and 3 in the dry season (January, March and May of 2014). The sampling effort was 100 min (by the same 2 people) for each of the 16 houses (40 min per story) and 20 min outside: garden, walls and courtyard. The specimens were collected manually using forceps and placed in vials and jars of 80% ethanol with their complete collecting data (locality, date, house number, geographical coordinates, altitude, and names of collectors). The specimens were deposited in the Colección Nacional de Arácnidos (CNAN), Institute of Biology, UNAM, México City. All samplings occurred during the day between 9 and 18 h. Specimen identification was performed with a Nikon SMZ645 stereoscopic microscope. For identifying families and genera, the identification keys of Ubick, Paquin, Cushing, and Roth (2005) were used. For species identification, specialized literature was used. The female epigyna and the males palpi of adult specimens were dissected, and 10% KOH was used to remove the soft internal tissue of the epigyna.
Data analysis
To measure specific biodiversity based in the uniformity importance values across all species in the sample, the Shannon-Wiener's diversity index (H ′) was used. Shannon-Wiener's diversity index was determined with the software Paleontological Statistics (PAST) v2.08 (Hammer, Harper, & Ryan, 2001). To determine the similarity among communities, the Morisita-Horn index (MH) was used (Moreno, 2001). The software Statistical Package for the Social Sciences (SPSS) v15.0 (Norman, Nie, Hull, & Bent, 1968) was used to analyze the abundance data, and the Shapiro-Wilk normality test was implemented to determine the data distribution; if the values were normally distributed (p > 0.05), a parametric one-way analysis of variance (ANOVA) was applied, but if the values were not normally distributed (p > 0.05), the nonparametric Kruskal-Wallis test was applied. These tests were used to determine whether there were significant differences among the abundances of males, females and juveniles, and spider abundances between the first and second stories of the houses (considering only the indoor samples). Using PAST v2.08, a repeated-measure ANOVA was applied to determine whether there were significant differences among the abundances by sampling periods. To evaluate the quality and total sampling effort, we applied a species accumulation curve for each categorized zone, for each season, and for the total. The data matrix was created based on the total number of sampled houses (16) and the total abundance of each species. Sampling efficiency was estimated with EstimateS (Statistical estimation of species richness and shared species from samples version) 9.1.0 (Colwell, 2013). Using EstimateS, the non-parametric richness estimators Chao1 and Chao2 were applied to assess species sampling. These 2 non-parametric estimators were selected because the normality assumption was not satisfied. For the diversity settings, we applied 1,000 randomizations of sample order. A nonlinear estimation was implemented using the statistical software STATISTICA v12 (StatSoft, 2014). To model the relationship between sampling effort and the number of species found, the Clench equation was implemented (Fagan & Kareiva, 1997; Moreno & Halffter, 2000). To adjust the nonlinear estimation, the Hooke-Jeeves and Quasi-Newton iterative algorithm was used (StatSoft, 2014). To evaluate the adjustment of the data functions (rate of increase of new species and the shape of the curve), the coefficient of determination (R 2) was calculated. The slope of a tangent to the curve was calculated to assess sampling quality using the derivative of the Clench equation: slope (at a point n ) = a /(1 + (b × n ))2, in which a and b are the function parameters obtained (Jiménez-Valverde & Hortal, 2003). Additionally, to assess sampling quality, the proportion of recorded spiders was calculated using the function parameters obtained with the Clench equation and the observed species richness: S obs /(a /b ) (Jiménez-Valverde & Hortal, 2003).
Results
Species richness
The richness of spiders associated with houses in the city of Chilpancingo was 63 morphospecies, 49 genera and 21 families (Table 1). The families Theridiidae and Salticidae made up 50.7% of the morphospecies, followed by Thomisidae (9.5%) and, Lycosidae (7.9%); the another 15 families only accounted for 31.9% of the total richness. These families were: Araneidae, Caponiidae, Corinnidae, Dictynidae, Filistatidae, Linyphiidae, Liocranide, Nephilidae, Nesticidae, Oxyopidae, Philodromidae, Pholcidae, Scytodidae, Sicariidae, and Tetragnathidae (Fig. 2).
Table 1 Spider morphospecies recorded for each sampling zone in houses in Chilpancingo, Guerrero, Mexico.
| Family | Genus | Morphospecies | 1 | 2 | 3 | 4 |
|---|---|---|---|---|---|---|
| Araneidae | a Mastophora | sp. 1 | * | |||
| Caponiidae | a Calponia | sp. 1 | * | |||
| Corinnidae | a Castianeira | sp. 1 | * | * | * | |
| Dictynidae | Dictyna | jacalana | * | * | * | * |
| Filistatidae | Filistatoides | sp. 1 | * | * | * | |
| Linyphiidae | Tmeticus | sp. 1 | * | |||
| Liocranidae | Agroeca | sp. 1 | * | |||
| Lycosidae | Allocosa | subparva | * | |||
| Allocosa | utahana | * | ||||
| aGenus 1 | sp. 1 | * | * | |||
| aGenus 2 | sp. 1 | * | ||||
| aGenus 3 | sp. 1 | * | ||||
| Nephilidae | a Nephila | clavipes | * | * | * | |
| Nesticidae | Eidmannella | sp. 1 | * | * | ||
| Oecobiidae | Oecobius | navus | * | * | * | * |
| a Oecobius | sp. 2 | * | ||||
| Oxyopidae | Oxyopes | acleistus | * | |||
| Philodromidae | a Tibellus | sp. 1 | * | * | ||
| Pholcidae | Physocyclus | globosus | * | * | * | * |
| Crossopriza | lyoni | * | ||||
| Salticidae | a Chalcoscirtus | sp. 1 | * | * | * | |
| Corythalia | sp. 1 | * | * | * | * | |
| Corythalia | opima | * | * | * | ||
| Habronattus | cambridgei | * | ||||
| Hasarius | adansoni | * | * | * | * | |
| Plexippus | paykulli | * | * | |||
| Sassacus | sp. 1 | * | * | * | * | |
| Sassacus | sp. 2 | * | ||||
| Sitticus | palpalis | * | ||||
| aGenus 1 | sp. 1 | * | ||||
| Scytodidae | Scytodes | fusca | * | * | * | * |
| Sicariidae | a Loxosceles | sp. 1 | * | |||
| Tetragnathidae | Leucauge | aurostriata | * | |||
| Theridiidae | Coleosoma | floridanum | * | |||
| Coleosoma | normale | * | * | |||
| Euryopis | sp. 1 | * | ||||
| Latrodectus | geometricus | * | * | * | ||
| Latrodectus | mactans | * | * | |||
| a Neottiura | sp. 1 | * | ||||
| Nesticodes | rufipes | * | * | * | * | |
| Nesticodes | sp. 1 | * | ||||
| Parasteatoda | tesselata | * | * | |||
| Tidarren | mixtum | * | * | |||
| Tidarren | sisyphoides | * | * | * | * | |
| a Tidarren | sp. 1 | * | * | * | ||
| a Theonoe | sp. 1 | * | ||||
| Theridion | sp. 1 | * | ||||
| Thymoites | sp. 1 | * | ||||
| Thymoites | sp. 2 | * | ||||
| aGenus 1 | sp. 1 | * | ||||
| aGenus 2 | sp. 1 | * | * | |||
| aGenus 3 | sp. 1 | * | ||||
| aGenus 4 | sp. 1 | * | ||||
| aGenus 5 | sp. 1 | * | ||||
| aGenus 6 | sp. 1 | * | ||||
| Thomisidae | Misumenoides | quetzaltocatl | * | |||
| a Misumenoides | sp. 1 | * | ||||
| a Misumenoides | sp. 2 | * | ||||
| Misumenoides | sp. 3 | * | ||||
| a Synema | sp. 1 | * | ||||
| Xysticus | paiutus | * | ||||
| Uloboridae | a Philoponella | sp. 1 | * | * | ||
| a Philoponella | sp. 2 | * | * |
1 = Urban zone with a garden; 2 = urban zone without a garden; 3 = suburban zone and 4 = rural zone.
* Presence of spiders.
a Juvenile specimens
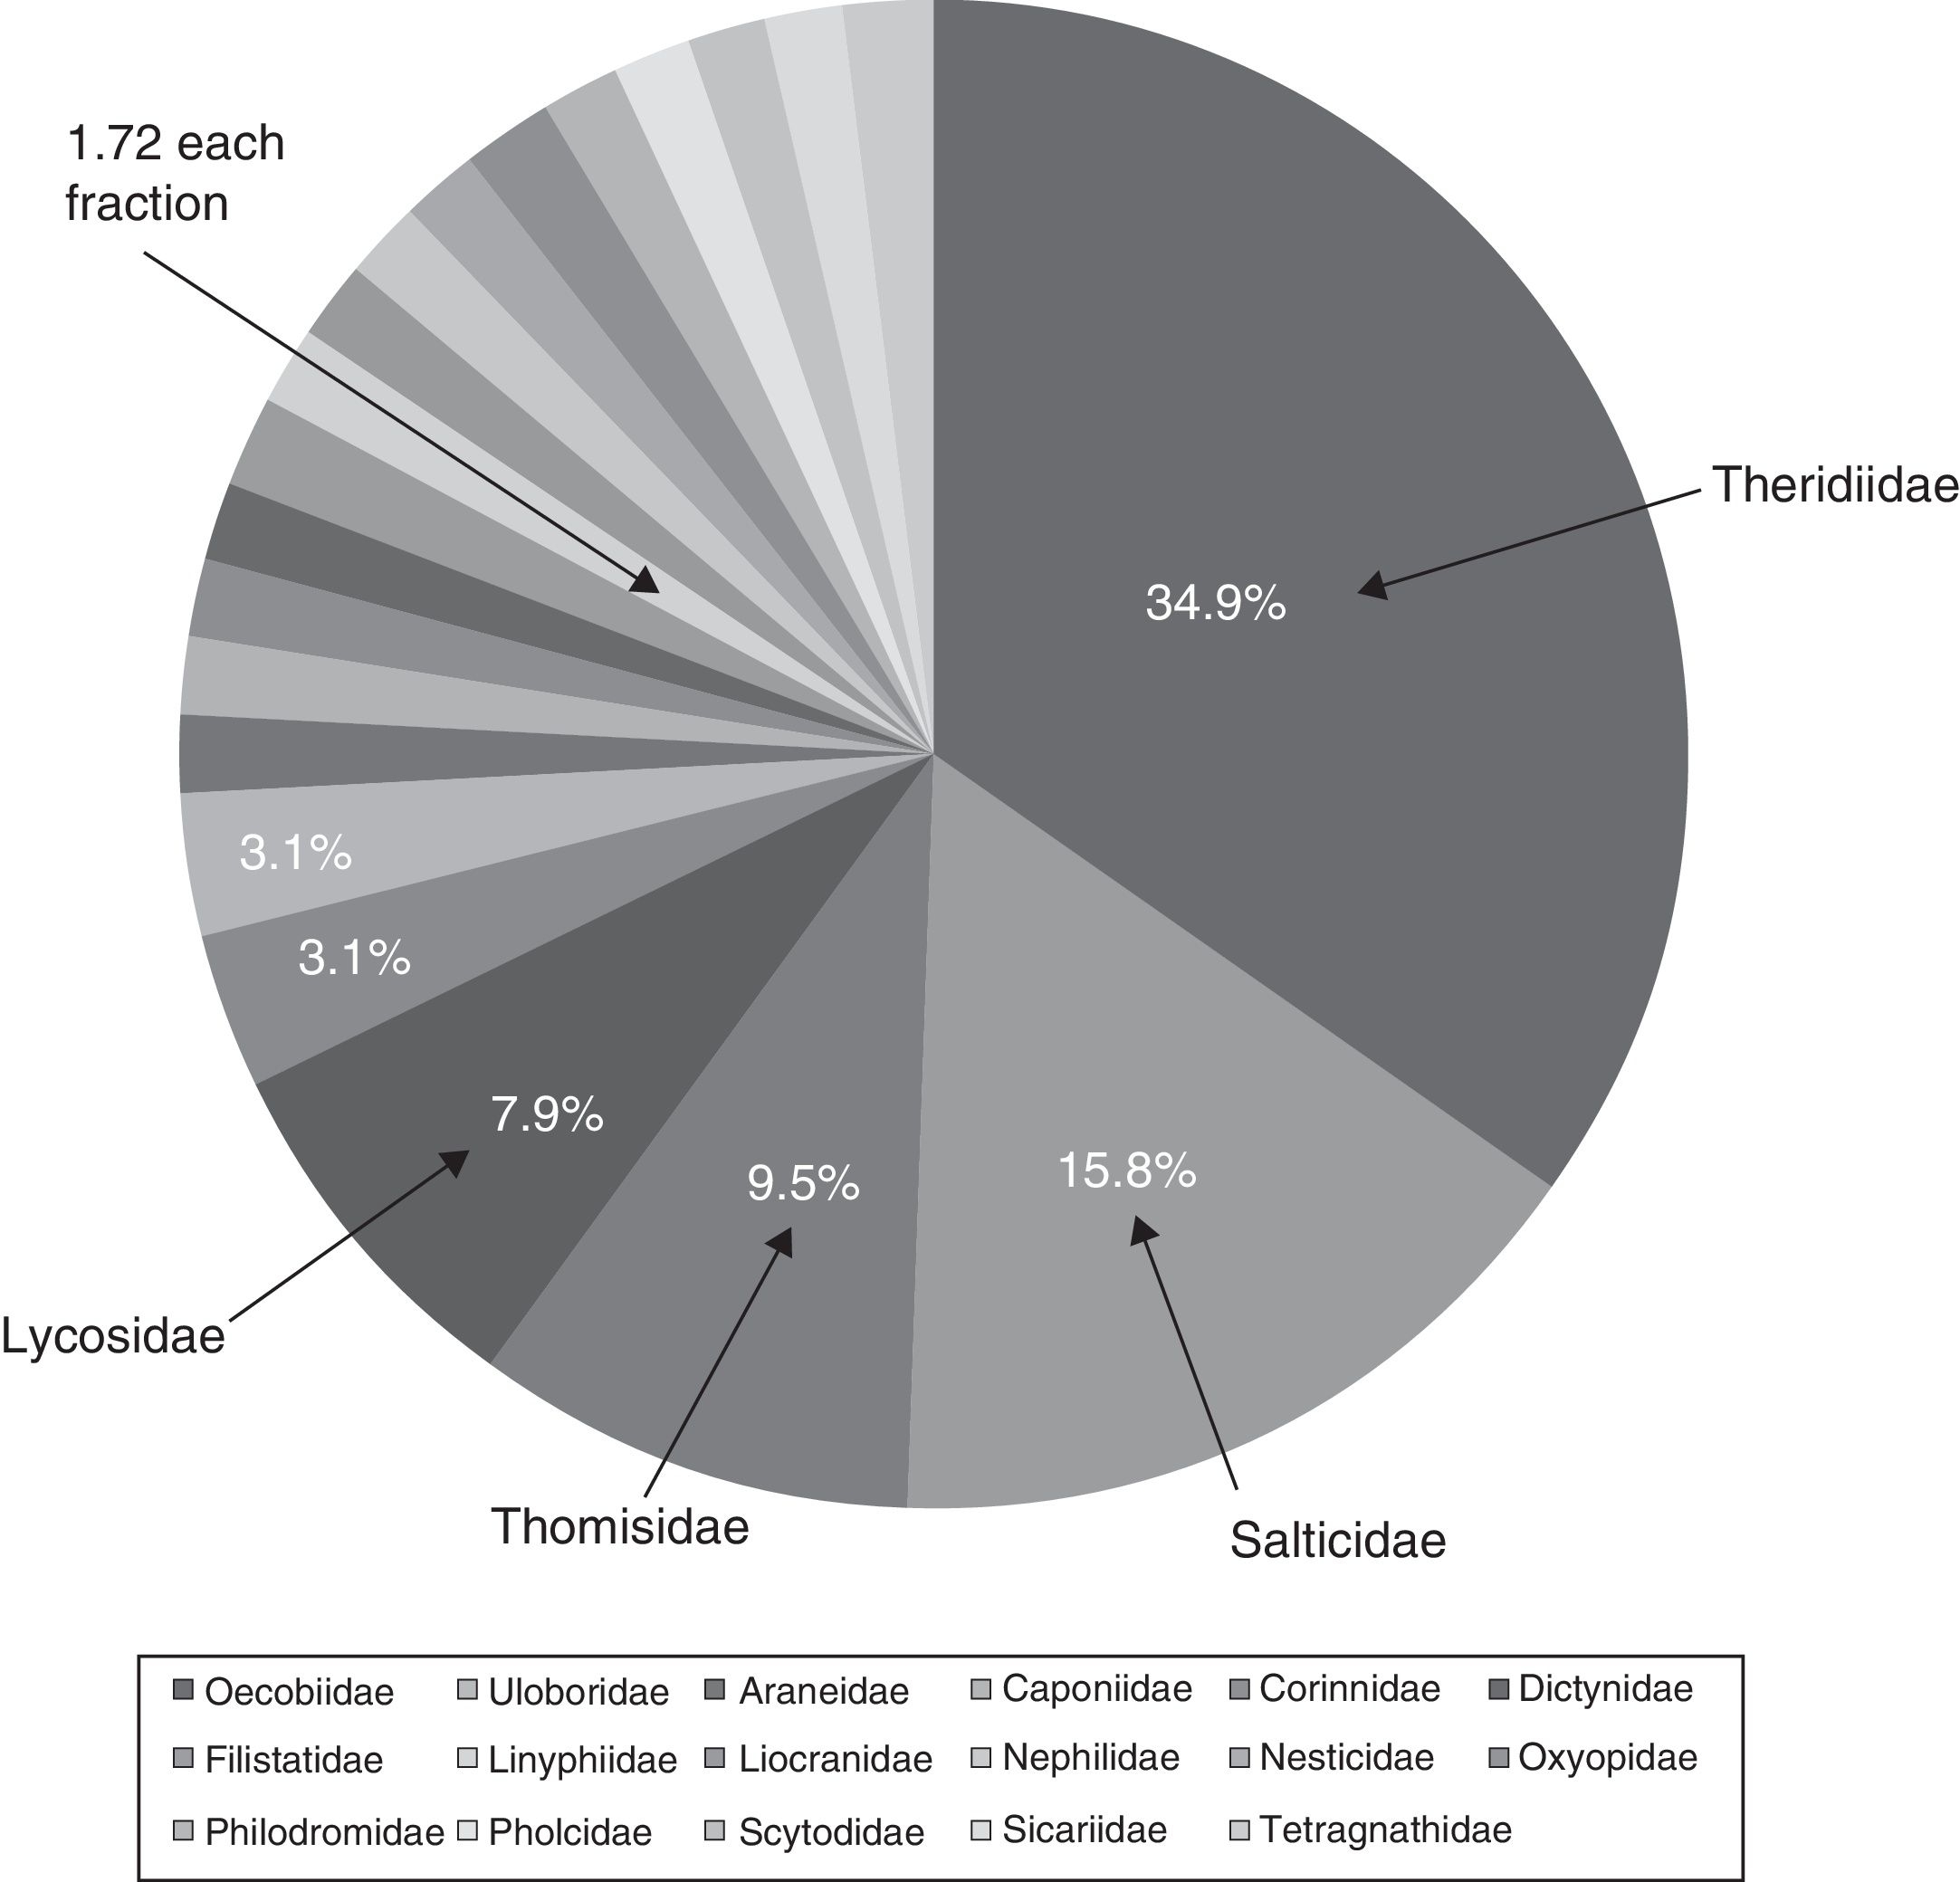
Figure 2 Percentage of morphospecies richness (S) of spiders per family recorded in houses, Chilpancingo, Guerrero, Mexico.
Concerning the quality and total sampling effort in the houses, the coefficient of determination R 2 = 0.99209, which is close to 1, indicates that there was a good fit of the Clench model to the data. The slope value of the species accumulation curve based on the derivative of the Clench equation, the slope was >0.1, in this case 1.4290, indicating that the species accumulation curve did not reach an asymptote (Fig. 3). However, the calculated proportion of registered spiders was 0.644, indicating that 64.4% of the expected species in the sampling were collected.

Figure 3 Species accumulation curve for the total sample. The x-axis represents the total number of sampled houses, and the y-axis represents the total number of recorded species.
The morphospecies richness per zone was greater in the rural zone (42 morphospecies), followed by the suburban zone (28 morphospecies), the urban with a garden zone (26 morphospecies), and finally the urban without a garden zone (21 morphospecies). The widely distributed morphospecies (present in all 4 zones) were: Physocyclus globosus , Oecobius navus , Nesticodes rufipes , Tidarren sisyphoides , Corythalia sp. 1, Dictyna jacalana , Hasarius adansoni , Sassacus sp. 1 and Scytodes fusca (Table 1). Table 2 shows the morphospecies richness per month. A total of 94 morphospecies, 43 genera, and 19 families were recorded in the rainy season, with the greatest morphospecies richness in the families Theridiidae (20), Salticidae (8), Lycosidae and Thomisidae (5 morphospecies each). In the dry season, the morphospecies richness was lower, with 48 morphospecies, 24 genera and 12 families. The families with the greatest morphospecies richness were: Theridiidae (10), Salticidae (6), and Pholcidae (2), in addition to the families Sicariidae and Caponiidae, with 1 morphospecies each (Loxosceles sp. 1 and Calponia sp. 1 respectively) that were not collected in the rainy season.
Table 2 Seasonal morphospecies richness (S) of spiders recorded in houses in Chilpancingo, Guerrero, Mexico.
| Rainy season | Dry season | |||||
|---|---|---|---|---|---|---|
| July | September | November | January | March | May | |
| Specific richness (number of morphospecies) | 38 | 35 | 21 | 20 | 16 | 12 |
| Total (per season) | 94 | 48 | ||||
Concerning the quality and sampling effort in the houses for the dry and the rainy seasons, based on the derivative of the Clench equation, the slope value was >0.1, (rainy = 1.3859, dry = 0.4737), indicating that the species accumulation curve did not reach an asymptote. The calculated proportion of registered spiders for the rainy season was 0.64 and 0.73 for the dry season. These results indicate that 61% and 73% respectively of the expected species for each season were collected.
Table 3 shows the morphospecies richness per story of the house for each season. In the rainy season, for the first story, the greatest richness was found in suburban and rural zones (9 morphospecies each), and the least richness was in the urban zone without a garden (5 morphospecies). For the second story, the greatest richness was in the rural zone (8 morphospecies), and the least richness was in the suburban zone (4 morphospecies). For the dry season, the greatest richness for the first story was recorded in the suburban zone (5 morphospecies), and the least richness occurred in the rural zone (3 morphospecies). For the second story, the greatest richness occurred in the rural zone (5 morphospecies), whereas the lowest richness was in the urban zone with a garden (2 morphospecies).
Table 3 Specific richness (S) of morphospecies in the 1st and 2nd levels of housing, corresponding to the rainy and the dry season.
| Specific richness (S ) per sampling zones | Rainy season | Dry season | ||
|---|---|---|---|---|
| 1st level | 2nd level | 1st level | 2nd level | |
| Urban zone with a garden | 7 | 7 | 4 | 2 |
| Urban zone without a garden | 5 | 5 | 4 | 4 |
| Suburban zone | 9 | 4 | 5 | 3 |
| Rural zone | 9 | 8 | 3 | 5 |
Based on Shannon t test (Hutcheson, 1970), the Shannon-Wiener index was significantly higher in rainy season (H ′ = 1.493) than in dry season (H ′ = 1.368), (p = 0.001). However, the Shannon-Wiener index values for the rural zone in the rainy season (H ′ = 1.405) and for the urban zone with a garden in the dry season (H ′ = 1.342) were not statistically different in both zones (p = 0.189) (Table 4). Concerning diversity, the Morisita-Horn index (MH) indicated that the urban zone with a garden and the suburban zone (MH = 0.95) were more similar than the other zones (Table 5).
Table 4 Total specific richness (S) of spiders and diversity index for each sampling zone in the rainy and the dry seasons.
| Rainy season | Dry season | |||
|---|---|---|---|---|
| S | H ′ | S | H ′ | |
| Urban zone with a garden | 21 | 1.359 | 15 | 1.357 |
| Urban zone without a garden | 18 | 1.256 | 9 | 1.119 |
| Suburban zone | 25 | 1.186 | 10 | 1.074 |
| Rural zone | 34 | 1.405 | 21 | 1.342 |
S = specific richness; H′ = Shannon index. Bold numbers indicate the highest values.
Table 5 Diversity similarity among sampling zones based on the Morisita–Horm's (MH) similarity index.
| Urban zone with a garden | Urban zone without a garden | Suburban zone | Rural zone | |
|---|---|---|---|---|
| Urban zone with a garden | ||||
| Urban zone without a garden | 0.81 | |||
| Suburban zone | 0.95 | 0.74 | ||
| Rural zone | 0.92 | 0.70 | 0.73 |
Bold number indicates the highest value.
Total abundance
A total of 4,120 spiders (320 males, 767 females and 3,033 juveniles) were recorded. Juvenile specimens of spiders are typically not identified to species because the adult genitalia are required to confirm the identification. The total abundance per zone was: 1,163 spiders for the urban zone with a garden, 1,010 for the urban zone without a garden, 1,004 for the suburban zone, and 943 for the rural zone. The Kruskal-Wallis test (x 2 = 14.36, df = 2, p = 0.01) indicated that there were significant differences between the abundances of males, females and juveniles, with the juveniles considerably more abundant. A list of all species recorded and their abundance is provided in the Appendix . The most abundant species were: P. globosus (1,998 individuals) (Pholcidae), O. navus (1,388 individuals) (Oecobiidae), and N. rufipes (313 individuals) (Theridiidae).
A total of 2,430 spiders were recorded in the rainy season: 194 males, 519 females and 1,717 juveniles. In the dry season, the abundance was 1,690 spiders: 126 males, 248 females, and 1,316 juveniles (Table 6). The repeated-measure ANOVA (F = 6.32, df = 23, p = 0.002) indicated statistically significant differences between the abundance by sampling periods, with November being the sampling period with the highest abundance (Table 6).
Table 6 Seasonal abundance of spiders registered in houses by sampling period.
| Rainy season | Dry season | |||||
|---|---|---|---|---|---|---|
| July | September | November | January | March | May | |
| Urban zone without a garden | 131 | 180 | 252 | 177 | 149 | 121 |
| Urban zone with a garden | 203 | 212 | 264 | 210 | 143 | 131 |
| Suburban zone | 226 | 245 | 169 | 126 | 102 | 136 |
| Rural zone | 149 | 196 | 203 | 190 | 95 | 110 |
| Total | 709 | 833 | 888 | 703 | 489 | 498 |
To compare the abundance of spiders between the first and the second levels of the houses, only 8 houses (those with 2 stories) were considered. A total of 1,244 individuals for the first floor and 701 individuals for the second floor were recorded. The abundance of the first floor of the house was significantly higher than the abundance of the second floor (F = 17.7, df = 1, p = 0.02).
Discussion
Species richness
Compared to the study by Desales-Lara et al. (2013) anthropogenic spiders in Toluca, State of Mexico, where 41 species were recorded using a systematized collecting method, we recorded more (22) morphospecies. Other studies conducted in Mexico where spiders have been collected in houses without using a systematic collection method have also found similar results. In México City, Durán-Barrón et al. (2009) found a total richness of 63 morphospecies, 52 genera, and 25 families, and Jiménez (1998), in La Paz, Baja California Sur, Mexico, recorded 42 species, 35 genera in 22 families. The reason for the differences in species richness for the various studies could be the different physical and biological characteristics of each area, such as vegetation type, climate, or a combination of factors, because each zone has unique environmental conditions. Teixeira-de-Souza and de Souza-Módena (2004) demonstrated that vegetation complexity and even variation in inflorescence characteristics can influence spider distribution, thereby increasing the range and quality of microhabitats available for spiders. Another important factor causing richness differences between the studies may be that different collecting methods and sampling efforts were employed in each study. For example, Desales-Lara et al. (2013) sampled 12 homes (unique systematic method), Durán-Barrón et al. (2009) sampled 109 homes, Jiménez (1998) sampled 32 homes for a period of 11 months (monthly collecting), and Guarisco (1999) conducted a literature search and reviewed biological collections.
The rural zone had the highest species richness, possibly because of its proximity to the native vegetation around Chilpancingo and lower levels of anthropogenic disturbance compared to the other sampling zones where anthropogenic activity has already occurred. Pristine vegetation provides different habitats types and shelters for spiders, and orb-weaving spider species diversity is highly significantly correlated with vegetation (Greenstone, 1984; Pinkus-Rendón, León-Cortés, & Ibarra-Núñez, 2006). These results contrast to those obtained by Desales-Lara et al. (2013) who found that the highest richness occurred in the urban zone with a garden. However, the environmental characteristics of each of the study zones differ: the municipality of Toluca, State of Mexico, comprises pine and oak forests, with a humid temperate climate with summer rains and dry winter. The city of Chilpancingo is surrounded by tropical deciduous forest with a predominant semi-warm humid climate with summer rains. Pinkus-Rendón et al. (2006) demonstrated that relatively pristine habitats, such as the tropical deciduous forest in southeastern Mexico, contain an important proportion of spider diversity in fragmented landscapes.
The data indicate that the highest species richness occurred in the rainy season, with the highest diversity in July. This suggests that species richness is influenced indirectly by increased precipitation: flowering and vegetation growth is promoted, providing food for insects, the primary prey of most spiders (Valdez-Mondragón, 2006).
The highest diversity in the urban zone with a garden in dry season and in the rural zone in rainy season (Table 4) showed that both locations may accommodate spiders living in the forest and spiders living in urban habitats, because both zones are important for spiders. The Morisita-Horm's similarity index showed a high similarity in the spider diversity in these 2 zones (MH = 0.92) (Table 5), which is explained also by the similarity between diversity indexes that statistically were the same between both zones. Therefore, the importance of gardens or wild plants or ornamental plants in urban zones favor the presence of insects that serve as the potential prey of spiders, thus promoting diversity and species richness associated with these environments.
Concerning the species richness was higher on the first story than the second story, the first story usually contains the principal entrance, and therefore is the first area that spiders colonize (Desales-Lara et al., 2013). Furthermore, places such as kitchens where waste is generated daily, favor the presence of insects and even some terrestrial crustaceans, such as: Lepidoptera, Diptera, Hemiptera, Homoptera and Collembola (McIntyre, 2000), Coleoptera (Magura et al., 2008; McIntyre, 2000), Hymenoptera (Cupul-Magaña, 2009; McIntyre, 2000), Isopoda (Magura et al., 2008) and Blattodea (Hernández-Rodríguez et al., 2013). This suggests that species richness is favored due the presence of potential prey on the first floor; however additional studies could test this hypothesis.
Based on the total sampling effort inside the houses, the species accumulation curve did not reach an asymptote (Fig. 3) in either the rainy or the dry season, indicating that the sampling effort in our work was not enough. This problem is exacerbated when surveying invertebrates, especially hyperdiverse but poorly known groups, like arthropods (Colwell & Coddington, 1994; Jiménez-Valverde & Hortal, 2003; Willott, 2001). Spiders certainly belong to this category. They are very abundant and diverse in terrestrial ecosystems, with great ecological diversity, but the taxonomic knowledge at the species level remains poor for most groups and there is often a dearth of distribution data, however many of the new species are being described by taxonomists (New, 1999). We collected more than 50% of the expected species based on the predictions using the function parameters obtained with the Clench equation. The sampling effort to collect all the species was apparently not enough statistically because the species accumulation curve did not reach an asymptote. Sixty-four percent of the total species were collected based on our proportion of registered species, and 61% for the rainy season and 73% for the dry season. In all previous spider surveys, which are nearly always undersampled; the accumulation curves do not reach an asymptote (Brennan, Majer, & Reygaert, 1999; Coddington, Young, & Coyle, 1996; Sørensen, Coddington, & Scharff, 2002; Toti, Coyle, & Miller, 2000).
Total abundances
Our results showed a higher abundance than reported in a study by Desales-Lara et al. (2013), in which they recorded a total of 1,196 specimens, and a study by Durán-Barrón et al. (2009), that recorded 1,404 specimens. The spider family with the highest abundance of individuals was Pholcidae, with 1,999 individuals, consistent with the results of Durán-Barrón et al. (2009) who recorded 491 individuals and Desales-Lara et al. (2013) who recorded 738 individuals. P. globosus (Pholcidae) was the most abundant species recorded in this study, with a total of 1,998 individuals. This species is commonly found in buildings, including homes, and has been introduced worldwide (Valdez-Mondragón, 2010). Pholcidae is one of the spider families with the most numerous synanthropic species (Huber, 2000; Valdez-Mondragón, 2013).
Concerning seasonal abundance, the highest abundance was recorded in the rainy season and tended to decline toward the dry season. This could be caused by a low percentage of flowering and vegetation growth, which reduces the presence of potential prey, such as insects. For the first sample corresponding to the rainy season, 709 spiders were recorded, and for the next sampling period, the abundance increased in November, to 888 individuals. The abundance tended to decrease in March, which was when the fifth sampling occurred, and showed a lower abundance of 489 individuals. In May, the abundance increased to 498 individuals. The variation in inflorescence composition can influence spider distribution, increasing or decreasing the microhabitats available for spiders (Teixeira-de-Souza & de Souza-Módena, 2004); which is more marked in some habitats like the tropical deciduous forest in Mexico because to the seasonal variation.
Abundance was statistically different between the first and second floors of the houses. These results are consistent with those of Desales-Lara et al. (2013) that showed spiders are most abundant on the first floor compared to the second floor of the houses. Their work was the first to examine this variable, and proposed 3 hypotheses to explain their results: (A) access (colonization) to the first floor is easier than to the second floor, (B) on the first floor, there is more food for spiders because kitchens may attract insects, and (C) the first floor offers more microhabitats with better conditions (temperature, humidity), therefore it is more readily colonized by spiders. Although none of these hypotheses were evaluated, our results are similar to the results of Desales-Lara et al. (2013) in relation the abundances between house levels, which perhaps explain the differences in the abundances between first and second floor; however, additional studies are needed to test these hypotheses.
Regarding the abundance per level among the 4 zones, the urban zone with a garden, the suburban zone and the rural zone had similar abundances that were higher for the first floor and lower for the second floor. However, for the urban zone without a garden, the highest abundance was obtained on the second floor. This result was most likely because one of the houses had been fumigated only days before sampling the first floor. At this house, the second floor was used as an office where the walls have a textured plaster, and the most abundant species recorded on this floor was O. navus (116 individuals). This species inhabits small cavities on walls, so the textured walls may have favored its presence.
Currently, urbanization is increasing and it causes the fragmentation of natural habitats and may also create many shelters for both native and introduced spiders; some of them may represent a medical problem because their venomous bites (Greene et al., 2009). Although we found that rural houses had higher species richness than urban houses, further research is required in urban areas to evaluate how anthropogenic activities impact populations and in non-urban areas surrounding the city to determine which species of spiders are found there. Also, species accumulation curves remain a useful tool to evaluate sampling quality and compare inventories of mega-diverse groups, such as spiders. They can also be used for better planning for field work and for experimental design to determine the best type of sampling for the study.
Further studies may provide answers to the following questions: Do the same spider species inhabit both wild and urban zones? Is spider diversity in the wilderness higher than that of urban zones? Is spider abundance equal between wild and urban zones? Will the spider communities from different zones be similar? Does the marked seasonality in the tropical deciduous forest influence the diversity and abundance of spider species? Do they vary seasonally? The answers to these questions will help to determine the impact of urbanization on populations and population dynamics of spiders between preserved and altered habitats, such as tropical deciduous forest and urban areas with high anthropogenic activity.

