nueva página del texto (beta)
 Inglés (pdf)
 Artículo en XML
 Referencias del artículo
 Enviar artículo por email
 Citado por SciELO
  Similares en
SciELO
Similares en
SciELO 
 Permalink
Introduction
Ruderal plant species are characterized by life-history traits which make them tolerant to disturbance (Grime, 1979). This functional group has been favored by anthropogenic disturbances in terrestrial ecosystems during the past century (Pino, Font, de Cáceres, & Molowny-Horas, 2009), and these habitat changes have opened new niches and resulted in demographic and range expansion for many species (Alexander, Van Kleunen, Ghezzi, & Edwards, 2012). In this way, ruderal plants may achieve invasive status and displace species in some areas (Bossdorf et al., 2005). Thus, as new areas become disturbed and are subsequently colonized by ruderal species, these species contribute to habitat modification (Alexander et al., 2012).
A common approach for evaluating the invasive capacity of ruderal plants has been to describe their evolutionary genetics and capacity to displace other species (Leiss, & Müller-Schäer, 2001; Müller-Schäer, Schaffner, & Steinger, 2004; Poulin, Weller, & Skal, 2005). In contrast, very little is known about the outcrossing rate, demographic status, and demographic expansion of these species. However, there is evidence that bioclimatic heterogeneity influences genetic diversity and structure in ruderal plants, and has even been found to have a selective effect on some genetic markers (Hamasha, Schmidt-Lebuhn, Durka, Schleuning, & Hensen, 2013 and references therein).
The herb Ruellia nudiflora (Engelman and Gray) Urban (Acanthaceae) is found from southern Texas and northern Tamaulipas to Central America and the Caribbean islands, where it occurs in disturbed areas and is considered an invasive native weed; however, its dispersal history remains unknown (Villaseñor, & Espinoza, 1998). R. nudiflora exhibits traits common to ruderal species, such as a high dispersal ability, high rates of seed germination and seedling survival in environments with low water availability, and adequate growth in a wide range of soil types (Cervera, & Parra-Tabla, 2009; Ortegón-Campos et al., 2012), like other species of the genus Ruellia (Meyer, & Lavergne, 2004). Furthermore, R. nudiflora grows in contrasting environments including deforested habitats as well as sites with varying levels of precipitation (Cervera, & Parra-Tabla, 2009; Munguía-Rosas, Ollerton, & Parra-Tabla, 2012). Such climatic variation is associated with different vegetation types ranging from spiny low deciduous forest in the north to medium-height subdeciduous forest in the south (Flores, & Espejel-Carvajal, 1994).
This species is self-compatible and exhibits varying low levels of pollen limitation, but its outcrossing rate and other mating system traits are unknown (Abdala-Roberts, Marrufo-Zapata, Arceo-Gómez, & Parra-Tabla, 2012). Additionally, populations of R. nudiflora in the Yucatán Peninsula display drastic spatial variation in floral traits such as degree of herkogamy (Marrufo, 2011). This, together with the presence of cleistogamous flowers that obligately self-pollinate, contributes to the high reproductive success of this species (a very common pattern in invasive plants; Campbell, Quinn, Cheplick, & Bell, 1983) and may also be responsible for spatial variations in outcrossing rate and genetic diversity.
All the aforementioned traits contribute to make R. nudiflora a species with a high potential to colonize anthropologically disturbed sites, although the location and date of its introduction to the Yucatán Peninsula are so far unknown.
The present study aimed to describe genetic structure and diversity as well as the outcrossing rate along a climatic gradient, in populations of the ruderal plant R. nudiflora . Since increased environmental variability on a small spatial scale favors genetic differentiation influenced by differential local adaptation (Lee, & Mitchell-Olds, 2011; Leiss, & Müller-Schäer, 2001), it seemed desirable to test the hypothesis that genetic variability and outcrossing rate are structured along a climatic gradient in which genetic differences between nearby populations are greater if these populations belong to different environments, and smaller if they are in similar environments. In particular, the following questions were addressed: (i) are populations of R. nudiflora in the Yucatán Peninsula genetically structured along a climatic gradient? and if so, what is the relative contribution of isolation by distance and isolation by environment on the genetic pattern? (ii) Is there evidence of historical demographic differences among these populations that suggest genetic bottlenecks and/or population expansion events? (iii) Is there a relationship between phenotypic variation (measured in levels of herkogamy) and genetic variation?
Materials and methods
Study species and characterization of study sites
Ruellia nudiflora is a 20-30-cm tall perennial plant that shows few ramifications (3-6) and produces chasmogamous (CH) and cleistogamous flowers (CL) (Long, 1971). Fruit production is similar in both flower types (approximately 70% fruit set success) (Munguía-Rosas et al., 2012). The proportion of CH flowers in this species throughout the season is reported to be 0.43-0.47 (Munguía-Rosas, Campos-Navarrete, & Parra-Tabla, 2013). During the flowering peak in the area under study, individual plants produce 6-12 CH flowers every day, which are visited by at least 6 bee species, such as Apis mellifera Linnaeus (Apidae) and Trigona fulviventris Guérin-Méneville (Apidae), and 5 butterfly species, the most common being Microtia elva Bates (Nymphalidae) (Abdala-Roberts et al., 2012). CH flowers are self-compatible and of tubular shape, the 20-25-mm long corolla opening for only 1 day. Fruits from both flower types are dry and dehiscent, measure 1-2 cm in length, and produce 6-15 seeds each. Seeds from both flower types remain viable for 3-4 months. This plant rarely grows clonally; Abdala-Roberts et al. (2012) found that virtually all recruitment occurs via seeds. Species in the Acanthaceae family disperse their seeds by capsule explosion once they are mature, in both flower types (Witztuma, & Schulgasserb, 1995).
Population sampling
To estimate genetic structure and diversity, and to evaluate demographic history, nine populations were sampled: Conkal (CKL), Inifap (INF), Dzemul (DZL), San José Tzal (SJT), Molas (MOL), San Antonio Tehitz (SAT), Lol-Tum (LTM), Akil (AKL), and Ticum (TCM), as shown in Fig. 1. A total of 76 adult flowering plants (5-23 individuals from each population; Tables 1 and 2) were sampled. Since R. nudiflora is considered a weed, it is frequently removed by people from growing areas, rendering it impossible to obtain many individuals at some sites, and to thereby achieve an equally large sample for all populations.

Figure 1 Location map of Ruellia nudiflora populations sampled in the Yucatán Peninsula, Mexico. Conkal (CKL), Inifap (INF), Dzemul (DZL), San José Tzal (SJT), Molas (MOL), San Antonio Tehitz (SAT), Lol-Tum (LTM), Akil (AKL), and Ticum (TCM) were sampled in 2007 (black circles) to assess genetic structure and diversity and demographic history, as well as in 2009 to determine outcrossing rates, while Aldana (ALD) and Solorio (SOL) were sampled only in 2009 to determine outcrossing rates (blue circles). (For interpretation of the references to color in this text, the reader is referred to the web version of the article.)
Table 1 Geographic coordinates of Ruellia nudiflora study populations, and sampling site vegetation, mean annual temperature in °C (TEMP), mean annual precipitation in mm (PP), and mean herkogamy in mm (HER). SDF=spiny deciduous forest; DEF=deciduous forest; STF=subdeciduous tropical forest; MEF=medium-height evergreen forest.

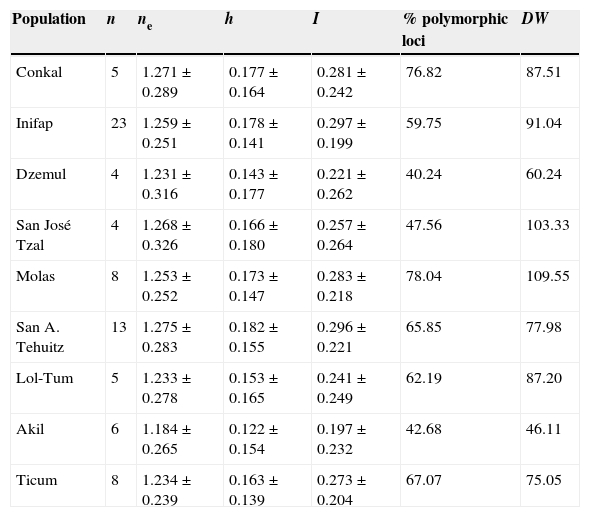
Table 2 Genetic diversity in nine populations of Ruellia nudiflora from the Yucatán Peninsula. n=sample size; ne=effective number of alleles; h=Nei's genetic diversity index; I=Shannon's index of diversity; polymorphic loci (%); DW=frequency-down-weighted-marker value.
To define the climatic gradient along which these R. nudiflora populations that are found, mean annual temperature and mean annual precipitation in these same 9 sites were obtained from WorldClim v1.4 (Hijmans, Cameron, Parra, Jones, & Jarvis, 2005). This database uses historical records from 1950 to 2000 (Table 1) and provides weather surfaces from which global climate data with a spatial resolution of approximately 1 km2 can be extracted. Mean temperature and precipitation were selected since these variables have been reported to influence genetic diversity and structure in ruderal plants (Hamasha et al., 2013). For each population, the surrounding vegetation type was characterized according to Duch-Gary (1988) (Table 1).
In 2007 during June and July (the months when the flowering peak typically occurs), the same nine populations were visited and 5-23 plants were selected from each for sampling. Selected plants were similar in size and floral display, free of folivory, and at a minimum distance of 2 m from each other. Three chasmogamous flowers were randomly selected from each of these plants and herkogamy was determined as the height of the lowest stigma lobe minus the height of the highest anther, measured from the apical tip of the ovary using a digital caliper (Fisher; Grass Valley, CA; accuracy ±0.02 mm/±0.001 mm). Measurements were made between 8:00 and 10:00 h.
Evaluation of the outcrossing rate in R. nudiflora requires an array of genotypes of siblings from one maternal plant (Ritland, 2002). Therefore, in June and July 2009, fruits of CH flowers were collected from 22 plants in six of the populations (3-5 fruits per maternal plant); not enough seeds were found in some populations for the outcrossing rate analysis and therefore some sites could not be adequately sampled. Four of these populations (INF, DZL, LTM, TCM) had been sampled previously to estimate genetic diversity and two more were added: Aldana (ALD) and Solorio (SOL). Seeds taken from these fruits were germinated in plastic growing trays. After the seeds had sprouted (approximately 90% germination), seedlings were transplanted to 2-L pots filled with commercial substrate. All seeds from one maternal plant were considered as a genetic family. After 6 months of growth, leaf tissue was collected per genetic family, from a total of 108 individuals and 22 families (see column 2, Table 5).
Table 3 (A) Deviance information criterion (DIC) values for each test model of Ruellia nudiflora in the Yucatán Peninsula. (B) Bayesian analysis of genetic structure. θII and θIII represent scaled allele frequency variances, both reflect only differentiation among contemporaneous populations; GST – B is the Bayesian version of GST. Values are the mean and 2.5% and 97.5% confidence intervals for all populations (full model only). (C) Population genetic structure inferred by analysis of molecular variance (Amova).
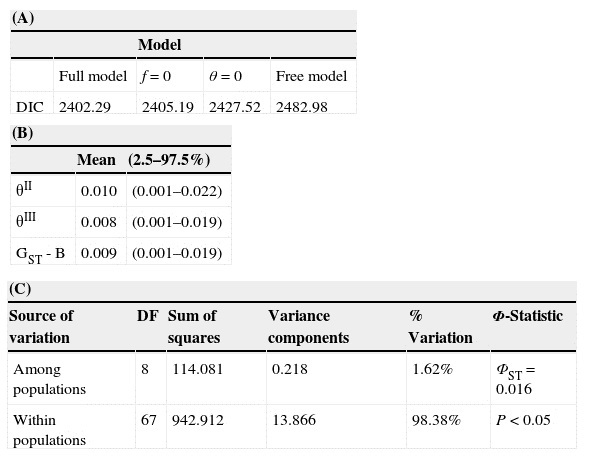
Table 4 Mean values of tau (τ), theta 0 (θ0) and theta 1 (θ1) in populations of Ruellia nudiflora. The 95% confidence interval is shown in parentheses. SSD=sum of squared deviations.

*p < 0.05, ns = not significant.
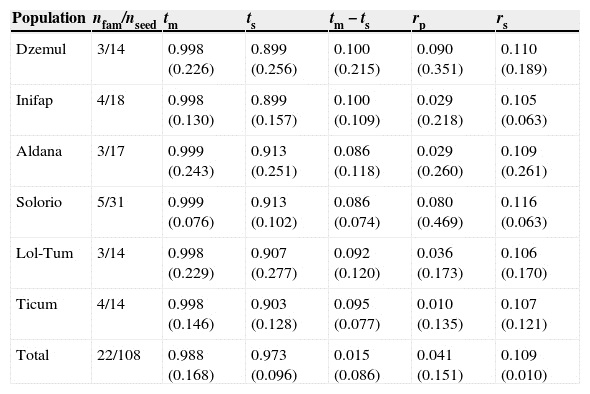
Table 5 Mating system indices in Ruellia nudiflora populations. (n fam) family number, (n seed) seedling number, (tm) multilocus outcrossing rate, (ts) single-locus outcrossing rate, (t m−ts) biparental inbreeding, (r p) multilocus correlation of outcrossed paternity, (r s) correlation of selfing. Values in parentheses are the standard error.
It should be noted that the nine populations selected to estimate herkogamy, genetic diversity, and demographic history adequately represent the bioclimatic gradient and along which R. nudiflora occur in the Yucatán Peninsula (i.e., three populations per each of three bioclimatic regions); this particular bioclimatic gradient in Yucatán has been described previously and was used to explain the distribution of genetic diversity and structure in other plant species in the region (Martínez-Natarén, Parra-Tabla, Ferrer-Ortega, & Calvo-Irabién, 2013 and references therein). Similarly, the six populations selected in order to evaluate the mating system represent the intermediate and two extreme values of variation in herkogamy found in this species (Marrufo, 2011). In particular, herkogamy in R. nudiflora is reported to follow a pattern of reduced anther-stigma separation in the north to greater separation in the south (Marrufo, 2011). The two selected populations therefore represent the "degree" of herkogamy along this gradient: DZL and INF in the north have reduced anther-stigma separation (0.32 ± 0.48 mm and 0.51 ± 0.5 mm, mean ± SD, respectively), the two central region populations an intermediate separation (ALD 1.46 ± 1.00 mm and SOL 1.56 ± 0.51 mm), and the two southern populations a greater separation (TCM 2.99 ± 0.51 mm and LTM 3.69 ± 1.5 mm) (Marrufo, 2011).
DNA extraction and AFLP protocol
Total genomic DNA of adult plants and seedlings was isolated from 200 mg lyophilized leaf material by the mini-prep CTAB method (Doyle, & Doyle, 1990). Isolated DNA was purified using the Wizard(r) DNA Clean-Up kit (Promega, Madison, WI) according to manufacturer instructions. The quality of the genomic DNA was verified in 1× TBE agarose gels and quantification of each sample was made in an Implen Nanophotometer (Thermo Fisher Scientific; Toronto, Canada).
Amplified fragment length polymorphism (AFLP) analysis was performed using a modified version of the protocol proposed by Vos et al. (1995): 250 ng genomic DNA (1.4-13.4 μL) was digested in a 20-μL reaction with 0.2 and 0.25 μL of the restriction enzymes Mse I and Eco RI respectively, 0.2 μL BSA, 2 μL NE Buffer 2 (both reagents from New England Biolabs; Ipswich, MA), and water to attain the final volume. The reaction was maintained at a constant temperature of 36 °C for 2 h. Adaptor ligation was performed in a 10-μL reaction with 1.08 μL of each of the 100 μM Eco RI and Mse I adapters, 1 μL T4 DNA ligase, 5 μL ligase buffer (both reagents from New England Biolabs), and 3.86 μL water. Ligation occurred at 16 °C for 1 h, and the ligase reaction was inactivated at 65 °C. Samples were then stored at 4 °C.
Pre-amplification was performed in 20-μL reactions using the restriction-ligation products and the primers Eco RI + A and Mse I + C. The temperature profile for amplification was 30 cycles of 94 °C for 30 s, 56 °C for 30 s, and 72 °C for 2 min. A total of 18 selective primer combinations were used to amplify DNA from adult plants and seedlings, based on which the following primer combinations were selected: Eco RI + ACC with Mse I + CTT and Eco RI + ACT with Mse I + CGT, for which a larger number of loci and a clearer band pattern were obtained. Adapters and oligonucleotides used were obtained from MWG Biotech (Huntsville, AL).
Bands of different molecular weight were identified in a transilluminator (Ultra-Violet Products; Upland, CA) using as a reference the band patterns of a marker of known molecular weight (PROMEGA(r) Lambda DNA/Hin dIII Markers, Promega). A presence/absence (1/0) matrix was constructed for use in these analyses.
To find the scoring error rate and genotype repeatability, eight individuals were selected at random from among all populations, and their band patterns were evaluated twice. The proportion of unshared bands in these two assays averaged 20%. Since this is a high value, bands <100 bp and >1,000 bp (i.e., those with a higher probability of evidencing homoplasy) were eliminated, thus reducing the scoring error rate to 5.54% on average.
To identify outlier loci among the above-mentioned markers, a Bayesian analysis to estimate the posterior probability of selection was performed with BAYESCAN v2.01 (Foll & Gaggiotti, 2008). This program calculates a Bayes factor (BF), which indicates that there is conclusive evidence in favor of selection when BF > 2, while with BF values equal to or close to 1 the null hypothesis of neutrality cannot be rejected (Foll & Gaggiotti, 2008). None of the 104 loci analyzed in R. nudiflora showed conclusive evidence of selection, since all BF values were between 0.8 and 1.2. Therefore, all genetic diversity and structure analyses were run on the full set of 104 loci.
Data analysis
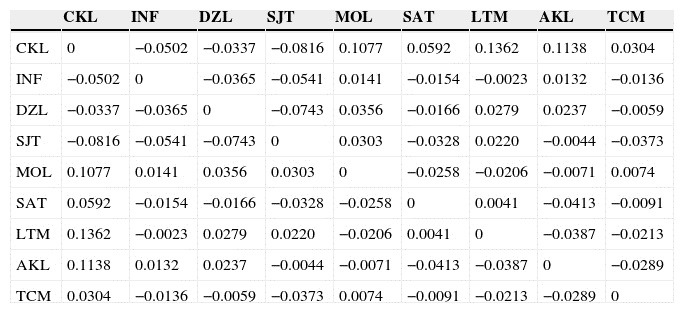
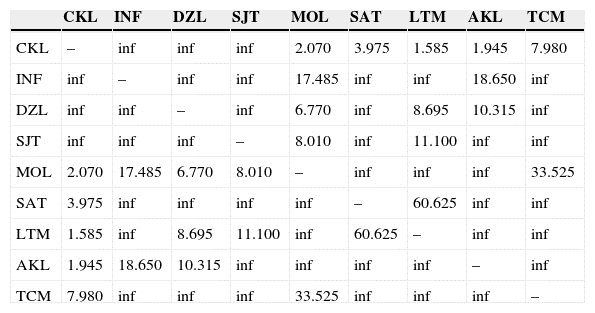
Overall mean proportion of polymorphic loci (as a percentage), effective number of alleles (ne ), Nei's (1978) genetic diversity index (h ), and Shannon's index of diversity (I ) were estimated in the nine populations, using POPGENE v1.32 (Yeh & Boyle, 1997). To quantify the distribution of rare alleles, we calculated the frequency-down-weighted-marker value (DW ); a high value of this index for a given population indicates a high level of genetic diversity distinctiveness (Schönswetter, & Tribsch, 2005). Furthermore, to complement DW data, the degree of genetic divergence among populations and gene flow (M = Nm ) in each population pair were estimated with ARLEQUIN v3.5.1.2 software (Excoffier, Laval, & Schneider, 2005).
Genetic structure was estimated using a Bayesian approach implemented with HICKORY v1.1 (Holsinger, & Lewis, 2002), which permits evaluation of different models and selection of the one with the best fit (full model, f = 0, θ = 0 and free model), i.e., the one with the lowest deviance information criterion (DIC) (Holsinger, & Lewis, 2002). HICKORY v1.1 was also used to estimate the parameters GST-B, θ II and θ III, which are Bayesian analogs of F ST, to enable contemporary population differentiation rather than historical differentiation to be tested (Holsinger, & Lewis, 2002). These analyses were performed using the following conditions for all four models: burn-in = 5,000, number of iterations = 100,000, thinnin = 20. Estimates were made using all sampled populations. Analysis of molecular variance (Amova) was also performed with ARLEQUIN v3.5.1.2 software (Excoffier et al., 2005); additionally, paired F ST values and gene flow were estimated for all possible combinations.
To assess if each plant could be genetically assigned to a given population, STRUCTURE v2.3 (Earl, 2011; Pritchard, Stephens, & Donnelly, 2010) was used. Similarly, to determine the number of homogeneous groups that sampled populations can cluster into, a Bayesian search was performed using this same program with 20 replicates, considering K = 1-9 as the number of possible groups. Additionally, a neighbor-joining (NJ) tree was constructed with the matrix of Nei's (1978) genetic distance, and principal coordinates analysis (PCoA) was carried out using the genetic frequencies of each population; both were done with PAST v.2.15 software (Hammer, Harper, & Ryan, 2001).
To determine if populations were undergoing demographic or spatial expansion, the following were estimated: 1) distribution of paired differences between individuals (mismatch distribution), and 2) number of segregating sites within a population and changes in population size (Rogers, & Harpending, 1992). Populations that have had sustained rapid demographic expansion are expected to have Poisson-type distributions of paired differences while multimodal distributions are expected in populations that are in demographic equilibrium (Rogers, & Harpending, 1992). Distribution was analyzed per population by estimating the sum of squared deviations observed over that expected based on a demographic expansion model (SSD ), as well as by Harpending's raggedness index (spatial expansion model) using the program ARLEQUIN v3.01 (Excoffier et al., 2005). The standard error was estimated based on 1000 resampling replicates. The peak of mismatch distribution provides an estimate of τ , initial time of expansion. Mismatch distribution also provided θ0 and θ1 values, which are approximations of the initial and final effective population size, respectively (Excoffier et al., 2005). The standard error and 95% confidence interval were estimated based on 5,000 resampling replicates.
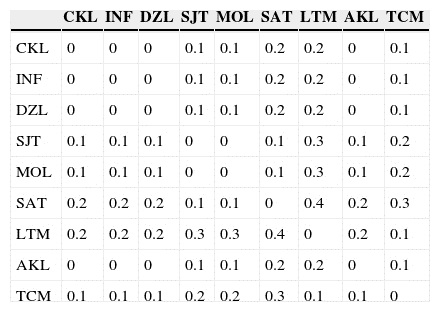
To evaluate potential correlations between neutral genetic differentiation (paired F ST) and geographic distance, environmental factors and phenotypic divergence, several Mantel and partial Mantel tests were performed (Crispo, Bentzen, Reznicl, Kinnison, & Hendry, 2006). The partial Mantel test evaluates the correlation of matrices X and Y, controlling for similarities given in a third matrix Z (Mantel, & Valand, 1970). The following matrices were compared: (i) geographic distance yielded a spatial genetic pattern (IBD model) when paired F ST and paired distance in kilometers were compared (mean temperature and mean precipitation were included in the partial Mantel test; Appendix, matrices A and B); (ii) environmental variables (mean temperature and precipitation; Appendix, matrices D and E) and genetic distance (IBE); geographic distance was included in the partial Mantel, and (iii) phenotypic differences (herkogamy; Appendix, matrix F) and genetic pattern; geographic distance was included in the partial Mantel (Sexton, Hangartner, & Hoffmann, 2013). To obtain matrices of environmental, phenotypic, and geographic variables, pairwise Euclidean distance between populations was estimated using PAST v2.15 (Hammer et al., 2001). The Mantel and partial Mantel tests were carried out with XLSTAT v2014.6.01 (Microsoft Excel); the p -value was estimated by using r (AB) to create a distribution from 10,000 permutations.
AFLP markers have been used to estimate outcrossing rates in numerous plant species regardless of allelic dominance (Gaiotto, Bramucci, & Grattapaglia, 1997; see references in Meudt, & Clarke, 2007). Values in the seedling presence/absence matrix were recoded to classify dominant (1) and recessive (2) genotypes in each band and individual, for use with MLRT v3.4 (Ritland, 2002). Based on the correlated-mating model proposed by Ritland (2002) assuming a mixed mating system model, the following mating system indices were obtained: single-locus outcrossing rate (ts ), multilocus outcrossing rate (tm ), biparental inbreeding (tm -ts ), multilocus correlation of outcrossed paternity (rp ), and correlation of selfing (rs ). The latter 2 indices are based on a sib-pair arrangement, which was used as the observation unit. In this case, rp estimates the probability that a given pair of plants are full-sibs due to an outcrossing event, and rs the probability that they are full-sibs due to a selfing event (Ritland, 2002). Hence, a high rs value has been previously correlated with pollen limitation (Takebayashi, Wolf, & Delph, 2006). Confidence intervals were estimated by bootstrap resampling (1,000 iterations) of progeny within each family.
Results
Genetic diversity
The overall mean proportion of polymorphic loci was 60.73 ± 13.88% (mean ± SD). At the population level, the percentage of polymorphic loci fluctuated between 40.24% and 78.04% (Table 2). The overall mean effective number of alleles (ne ) was 1.245 ± 0.029 (mean ± SD). The overall mean for Nei's genetic diversity index (h ) was 0.162 ± 0.02 (mean ± SD), the highest value occurring in SAT and the lowest in AKL. For Shannon's index (I ), the overall mean was 0.261 ± 0.035 (mean ± SD), with the same two populations having the highest (SAT) and lowest (AKL) values. As regards DW , the highest values occurred in MOL, SJT, and INF (Table 2), while the lowest was found in AKL and DZL. Mean values for this index indicate that the latter two populations and SAT may have the longest divergent times while CKL, MOL, TCM, SJT, and LTM have recent divergence times (Table 2). All Nm estimates were >1.0 individuals; CKL and LTM had the lowest gene flow values (Nm = 1.585). In 22 comparisons between populations, Nm had an infinite value while in the remaining 13, Nm = 1.945-60.625 individuals (Appendix, matrix C).
Genetic structure
Bayesian analyses indicate differences among populations (Table 3A), as evidenced by the full model (the model with the lowest DIC) in which θ II, θ III and GST - B were very low, albeit significantly different from zero (Table 3). Similarly, the Amova indicates genetic differences among populations (ΦST = 0.016, p < 0.05), which account for 1.62% of the total variation. However, within-population differences explain most of the variation (98.38%). The paired F ST matrix showed low levels of differentiation in almost all comparisons, suggesting a high rate of gene flow in the Yucatán Peninsula, as stated above (Appendix, matrices B and C).
The analysis performed with STRUCTURE v2.3.3 obtained an optimum number of clusters at ΔK = 3. Also, as shown in Fig. 2, populations were not observed to be genetically homogeneous groups of individuals; in other words, individuals from the same predefined population had partial membership in multiple populations. NJ and PCoA showed no clear geographic clustering of sampled populations or of individual plants (Fig. 2). This suggests that there are individuals that have ancestral relationships with plants from populations other than the one in which they were collected, which in turn provides indirect evidence of some degree of genetic connectivity.

Figure 2 (A) Plot of first 2 axes of Principal Coordinates Analysis (PCoA) of sampled individuals; different populations are represented by different colors; (B) neighbor-joining tree of nine populations sampled, the same colors are used as in the PCoA, and (C) results from STRUCTURE analysis with K=3, each individual is represented by a thin vertical line partitioned into different colored segments that represent membership in a given population, in the north (orange), central (red) and south (green) of the Yucatán Peninsula. (For interpretation of the references to color in this text, the reader is referred to the web version of the article.)
Demographic history
Mismatch distribution (SSD index) and Harpending's raggedness index showed that all populations have undergone demographic and spatial expansion (Table 4) except DZL (SSD = 0.202, p = 0.04). Also, the peak of the mismatch distribution ranged from 19.2 (IC 10.6-30.6) in AKL to 40.7 (IC 18.9-178.3) in DZL, although the most common value was 27, indicating that population growth is not recent. Overall, these results show a drastic expansion of all populations, each population starting with a few dozen individuals (θ0 ranged from 0.7 to 11.0; Table 4) and now comprising thousands (θ1 ranged from 14,456.3 to 91,862.4) as shown in Table 4. These values are approximate, but such gross estimation suggests large demographic expansion along the climatic gradient.
Mantel and partial Mantel tests
Results of the 3 Mantel and partial Mantel tests were as follows: (i) IBD model: a moderate and significant correlation was found between F ST and geographic distance; when environmental variables were included in the partial correlation (r = 0.439, p = 0.009), geographic distance explains up to 19% of variance, and when these variables were removed (r = 0.416, p = 0 .012), explained up to 17% of the variance (Fig. 3); (ii) effect of environmental variable matrices: mean temperature (r = 0.010, p = 0.944) and mean precipitation (r = −0.224, p = 0.182) had no significant IBE effect on the genetic matrix both when geographic distance was included in the partial correlation and when it was removed (mean temperature r = 0.015, p = 0.896; and mean precipitation r = 0.162, p = 0.346); (iii) Phenotypic differences (herkogamy) were not correlated with genetic distance when geographic distance was included (r = 0.208, p = 0.234) and a weak, almost significant correlation was found when geographic distance was removed (r = 0.308, p = 0.085).

Mating system
Elevated single-locus and multilocus outcrossing rates were obtained in R. nudiflora (tm = 0.998 ± 0.009; t s = 0.983 ± 0.012; mean ± SE) indicating that nearly 99% of progeny were produced by noninbreeding events. The values obtained for both multilocus correlation of outcrossed paternity (rp ) and correlation of selfing (rs ) were low, suggesting that in most cases seeds from one family do not share the same father (rp = 0.041 ± 0.013; mean ± SE) and that pollen limitation is low in this species (r s = 0.108 ± 0.003; mean ± SE) (Table 5).
Discussion
Colonization of new areas usually entails loss of genetic diversity in plant species, since such events are initiated by a small number of individuals. Thus, a strong founder effect, which is related to genetic bottlenecks in recently formed populations, is to be expected (Austerlitz, Jung-Muller, Godelle, & Gouyon, 1997; Bossdorf et al., 2005). Despite this prediction, the genetic diversity observed in ruderal and invasive plant species is usually not low (Bossdorf et al., 2005; Hamasha et al., 2013; Mandák, Zákravsky, Korínková, Dostál, & Placková, 2009). This agrees with our findings in R. nudiflora which show no evidence of genetic erosion, although θ0 values showed populations starting with a few dozen individuals, large demographic expansion occurred in a short period of time. This may explain why no indication was found of sampled individuals being genetically similar, highly homozygous, or clones, and all sampled plants had a distinct haplotype.
There are some possible explanations for the high genetic diversity observed in R. nudiflora populations. First, the number of loci used may have been high, enabling detection of a great part of the variation within each population (Sunnucks, 2000). This seems to be a common result when AFLP markers are used to measure genetic variation in plants (Lihová, Kudoh, & Marhold, 2010; Nybom, 2004; Steinger, Haldimann, Leiss, & Müller-Schärer, 2002) in contrast to findings using isozyme markers. This is a clear pattern in Cactaceae (Cornejo-Romero, Vargas-Mendoza, Valverde, & Rendón-Aguilar, 2013) and Agavaceae (Eguiarte et al., 2013) or in other ruderal plants with the same reproductive system as R. nudiflora (Culley, & Wolfe 2001; Imaizumi, Wang, & Tominaga, 2008). There is no similar review of genetic data in the Acanthaceae, but it is assumed that the same pattern holds true.
Secondly, high pollinator visitation rates (A. mellifera , T. fulviventris , and several butterfly species; Abdala-Roberts et al., 2012) in R. nudiflora may result in high pollen movement among plants. Populations in which pollen movement is high usually exhibit few inbreeding events and high levels of genetic variation (Barrett, 2003). In fact, if there are open pollination events among apomictic or clonal individuals, the level of genetic variation present produces high heterozygosity (Maynard-Smith, 1982). Likewise, R. nudiflora is characterized by low genetic differentiation among populations (as shown by the paired F ST matrix, NJ and PCoA) and this is frequently characteristic of plants with a high genetic connectivity, i.e., low population differentiation is consistent with high-vagility species (Linhart, & Grant, 1996; Slatkin, 1993), which seems to be the case of R. nudiflora (Abdala-Roberts et al., 2012).
However, a low genetic differentiation was statistically significant with 1.62% of genetic differences among populations grouping in three regions. Possible explanations of this low but significant differentiation are recent origin of populations, large effective population sizes, and separate, temporally persistent, local populations (Knutsen et al., 2011). In R. nudiflora , persistent local populations and a recent origin may be the more plausible explanations as shown by DW index as well as demographic and STRUCTURE analysis results. It is not common for ruderal or invasive plants to show low inter-population differentiation (Leiss, & Müller-Schäer, 2001; Poulin et al., 2005). Thus, some potentially confounding factors such as nonrepresentative sampling cannot be discarded (Knutsen et al., 2011). Further research with a larger sample size and/or other markers may contribute to understanding this pattern.
Also, a weak but significant pattern in which genetic differentiation increased with geographic distance (IBD) was revealed by the partial Mantel test (Sexton et al., 2013; Slatkin, 1993). A similar situation has been observed in the ruderal invader plant Microstegium vimineum , where IBD was not very consistent throughout its distribution range (Baker, & Dyer, 2011). Under a strict IBD model, a constraint is placed by the inherent dispersal limitations of the organism and the size of its populations, but not by the nature or structure of environmental variation. In R. nudiflora , low similarity across distances (IBD) indicates that species expansion has been a slow diffuse spread leading to a patchy environment (Lee, & Mitchell-Olds, 2011; Leiss, & Müller-Schäer, 2001) that is the result of multiple invasions and colonization/extinction events in the Yucatán Peninsula. A similar finding has been reported in North America for the invasive plant Silene vulgaris (McCauley, Smith, Lisenbay, & Hsieh, 2003). In this case, S. vulgaris had undergone several colonization events associated with a demographic expansion process occurring after its introduction from Europe (McCauley et al., 2003). On the other hand, spatial genetic structure is expected to be stronger for maternally inherited genes (mitochondrial and chloroplast), which are dispersed through seed flow, than for nuclear genes which are dispersed by both pollen and seed flow (Ennos, 2001); in the present study only nuclear markers (AFLP) were used.
Demographic and range expansion in R. nudiflora may be explained by human-induced disturbances that have prevailed in southeastern Mexico since the late 19th and early 20th centuries. One effect of these anthropogenic impacts has been an increase in the surface area covered by agricultural fields (Mizrahi, Ramos-Prado, & Jiménez-Osomio, 1997). These vast abandoned areas constitute suitable habitats for colonization by ruderal species such as R. nudiflora . The demographic and range expansion of ruderal annual species in the Yucatán Peninsula has been suggested to coincide with human-induced disturbances beginning in the late 19th century, and even much earlier during the pre-Hispanic era (Mizrahi et al., 1997). This is a common finding in ruderal species that colonize new environments (Bossdorf et al., 2005), since they are able to persist in a given site during the stabilization phase, following which they undergo a phase of population growth that allows subsequent colonization events (Richardson, Pysek, Rejmánek, Barbour, Panetta, & West, 2000). This type of pattern has been reported in other species that invade different environments, such as Barbarea vulgaris (Buschmann, Edwards, & Dietz, 2005), Eschscholzia californica (Leger, & Rice, 2003), and Senecio jacobaea (Stastny, Schaffner, & Elle, 2005). Although virtually no studies have been conducted on invasive herb species with CH and CL flowers, there is evidence of other species with a similar reproductive system that follow the same pattern of "resistance" (Cheplick, 2005).
The tm estimates obtained in the present study seem unexpectedly high, but are consistent with the high Nm values reported; this result could be explained by multiple factors such as floral traits variation and asynchrony (Barrett, 2003; Boshier, Chase, & Bawa, 1995), pollen movement patterns (Murawski, & Hamrick, 1992), genetic differences at the self-fertilization level (Warwick, Bain, Wheatcroft, & Thompson, 1989), and pollen competition inside pollen tubes (Morgan, & Barrett, 1990), although high outcrossing rates have been observed in herbs with a similar reproductive system (Culley, & Wolfe 2001; Imaizumi et al., 2008). Regarding pollen movement, a previous study indicates that R. nudiflora is visited by bees such as A. mellifera and T. fulviventris as well as several butterfly species (Abdala-Roberts et al., 2012). Species of the genus Trigona may travel up to 1.5 km when foraging (Roubik, & Aluja, 1983) and A. mellifera up to 13.5 km (especially in disturbed habitats). Such foraging patterns by pollinator insects partly explain the occurrence of high tm values, high gene flow, and low genetic structure across populations (Linhart, & Grant, 1996), as observed in R. nudiflora in the present study. Additionally, recent data suggest that self-pollinating CH flowers are twice as likely to be aborted than outcrossing CH flowers (Abdala-Roberts et al., 2012). Furthermore, a better performance has been observed in progeny produced by outcrossing than in those derived by selfing (Munguía-Rosas et al., 2013). Thus, in R. nudiflora , the addition of new individuals to the population is apparently generated mostly through outcrossing events, which may help explain genetic diversity levels and the slight genetic structure observed, as occurs in the cleistogamus species Viola pubescens (Culley, & Wolfe 2001). On the other hand, spatial variation in key floral traits such as herkogamy may affect the mating system as well as patterns of genetic diversity and structure; however, in the case of R. nudiflora no clear correlation was found between herkogamy and F ST (Barrett, 2003; Takebayashi et al., 2006).
The hypothesis was put forth initially that genetic differences between nearby populations of R. nudiflora will be great if they belong to different environments and small if they are in similar environments, as has been described in other species (Lee, & Mitchell-Olds, 2011; Leiss, & Müller-Schäer, 2001). However, our results do not support this assumption. A possible explanation of the pattern described in R. nudiflora may be the existence of high gene flow. An increase in the number of individuals in a population, multiple invasions, and a corresponding increase in the distribution range of a species may cause increment in connectivity between populations, thereby shaping its genetic structure within a region (Austerlitz et al., 1997; Crispo et al., 2006; Sexton et al., 2013). IBE may arise through nonrandom mating, which is the result of adaptation to different environments (Sexton et al., 2013). However, gene flow in R. nudiflora may run counter to patterns of environmental variation or local adaptation, being higher across dissimilar environments. Under this scenario, adaptation may be difficult under stable conditions, but can be faster under rapid environmental change if strong gene flow across different environments maintains high genetic variation (Lee, & Mitchell-Olds, 2011; Leiss, & Müller-Schäer, 2001; Sexton et al., 2013). As demonstrated by Ortegón-Campos et al. (2012), R. nudiflora is not adapting rapidly to the local soil environment.
Finally, the lack of a clear pattern in the present data suggests that this plant has recently and successively colonized the Yucatán Peninsula area. To have a clearer idea of this situation, a phylogeographic study that might clarify the evolutionary history of R. nudiflora is required.
Acknowledgments
To Mónica Medrano, Luis Abdala, Daniel Piñero, and two anonymous reviewers for valuable comments on the manuscript. We thank Sara V. Good for kindly allowing genetic analyses to be performed in her laboratory at the University of Winnipeg, and Miriam Ferrer for assistance in carrying out these analyses. This study was financially supported by Conacyt as part of a grant provided to VPT (SEP-2004-CO1-4658A/A1).