


Serviços Personalizados
Journal
Artigo
 Inglês (pdf)
 Artigo em XML
 Referências do artigo
 Enviar este artigo por email
Indicadores
-
 Citado por SciELO
 -
 Acessos
Links relacionados
-
 Similares em
SciELO
Similares em
SciELO
Compartilhar

 Permalink
Revista mexicana de biodiversidad
versão On-line ISSN 2007-8706versão impressa ISSN 1870-3453
Rev. Mex. Biodiv. vol.83 no.4 México Dez. 2012
https://doi.org/10.7550/rmb.27125
Taxonomía y sistemática
A modification to the SCAR (Sequence Characterized Amplified Region) method provides phylogenetic insights within Ceratozamia (Zamiaceae)
Una modificación al método SCAR (Sequence Characterized Amplified Region) aporta entendimiento filogenético en Ceratozamia (Zamiaceae)
Dolores González1* and Andrew P. Vovides2
1 Laboratorio de Sistemática Molecular, Departamento de Biodiversidad y Sistemática, Instituto de Ecología, A.C. Km. 2.5 Antigua Carretera a Coatepec 351, 91070 Xalapa, Veracruz, México. *dolores.gonzalez@inecol.edu.mx
2 Laboratorio de Biología Evolutiva de Cycadales, Departamento de Biología Evolutiva, Instituto de Ecología, A.C. Km. 2.5 Antigua Carretera a Coatepec 351, 91070 Xalapa, Veracruz, México.
Recibido: 31 agosto 2011
Aceptado: 14 mayo 2012
Abstract
Phylogenetic relationships among closely related plant species are still problematic. DNA intergenic regions often are insufficiently variable to provide desired resolution or support. In this study, a modification to the Sequence Characterized Amplified Region (SCAR) method was used to find polymorphic loci for phylogenetic analyses within Ceratozamia. RAPD markers were first used to detect variation in 5 species. Then, equal length fragments found in 2 or more species were excised from the gel, purified and digested with frequent cutter restriction enzymes for isolating both ends, which have the same primer site. Digested fragments were sequenced with the RAPD primer. Variable sequences were used to design specific primers for amplifying and sequencing in all species for phylogenetic analyses. Our results confirmed the previously known high genome sequence resemblance within this genus that contrasts with its high morphological variation. Only 7 parsimony informative characters were found with this approach. Nonetheless, the Digested-SCAR (D-SCAR) method provided some phylogenetic insights. Four main clades consistent with distribution ranges of the species were detected. The approach presented here was effective to solve some relationships within the genus and can potentially be implemented in other organisms to find polymorphic loci for phylogenetic studies at any taxonomic level.
Key words: phylogeny, cycads, D-SCAR, molecular markers, RAPD, restriction enzymes, polymorphic loci, parsimony.
Resumen
Las relaciones filogenéticas entre especies de plantas cercanamente relacionadas es aún problemático. Las regiones intergénicas del ADN son a menudo insuficientemente variables para proveer los niveles de resolución y soporte deseados. En este estudio, se usó una modificación al método Sequence Characterized Amplified Region (SCAR) para encontrar loci polimórficos para análisis filogenéticos en Ceratozamia. Primero se usaron marcadores RAPD para detectar variación en 5 especies; luego, se cortaron del gel los fragmentos de la misma longitud en 2 o más especies, se purificaron y se digirieron con enzimas de restricción de corte frecuente para aislar las 2 terminaciones que tienen el mismo sitio del oligo. Los fragmentos digeridos se secuenciaron con el oligo usado para los RAPD. Las secuencias variables se usaron para diseñar oligos específicos para amplificar y secuenciar todas las especies para los análisis filogenéticos. Nuestros resultados confirmaron la elevada semejanza del genoma, previamente detectada dentro de este género, que contrasta con su elevada variación morfológica. Sólo 7 caracteres parsimoniosamente informativos se encontraron con esta estrategia. No obstante, el método SCAR-digerido (D-SCAR) aportó entendimiento filogenético adicional. Se detectaron 4 clados principales que son consistentes con el intervalo de distribución de las especies. La estrategia presentada en este trabajo fue efectiva para resolver algunas relaciones dentro del género y potencialmente puede implementarse en otros organismos para encontrar loci polimórficos para estudios filogenéticos a cualquier nivel taxonómico.
Palabras clave: filogenia, cícadas, D-SCAR, marcadores moleculares, RAPD, enzimas de restricción, loci polimórficos, parsimonia.
Introduction
DNA sequence data have played a central role in modern taxonomic studies during the last 2 decades. This has also provided a seemingly endless number of characters to be used in phylogenetic studies and have allowed comparisons across divergent groups where difficulty in establishing morphological homologies has been encountered. Characters for DNA based analyses have been obtained from all three-plant genomes. Nonetheless, these data have mostly helped to resolve phylogenetic relationships in higher taxonomic ranks (Soltis and Soltis, 1998) because usually, closely related species have not accumulated a large amount of molecular differences to facilitate phylogenetic resolution. Non-coding regions have been presumed to be more useful at low taxonomic ranks because they are less functionally constrained and have a higher mutation rate, thereby potentially providing more phylogenetically informative characters per unit of sequencing effort (Small et al., 1998). Non-coding regions from chloroplast DNA (cpDNA) and spacers of the nuclear ribosomal DNA (nrDNA) have been, by far, the sequences of choice for phylogenetic studies at the species level (Shaw et al., 2005). However, these sequences are often insufficiently variable to provide desired levels of resolution or support (e.g. Potter et al., 2000; Ekenas et al., 2007; Kyoda and Setoguchi, 2010). This was the case in a recent study using sequences of non-coding regions from cpDNA and nrDNA (trnL-F and ITS) to explore phylogenetic relationships in the Mexican genus Ceratozamia Brongn (Zamiaceae, Cycadales). Our results revealed a very low number of informative characters, compared with the number of nucleotides sequenced (González and Vovides, 2002). Low sequence variation for these markers has also been found in studies performed in our laboratory with species of Dioon Lindley (Zamiaceae; González et al., 2008) and Tillansia L., (Bromeliaceae; Chew et al., 2010). Surprisingly, the scarce variation detected in non-coding regions contrast with the remarkable morphological variation found among species within each of these genera (Horres et al., 2000; Bogler and Francisco-Ortega, 2004; Barfuss et al., 2005).
The genus Ceratozamia to date comprises 22 species, 20 named and 2 new species not formally named yet. However, the number of species is approximate because new species accounts are being published (Pérez-Farrera et al., 2007; Vovides et al., 2008a, 2008b), and there are other Ceratozamia populations under investigation that may also be described as new species or undergo nomenclatural changes. This group of cycads presents remarkable morphological variation both within and between species. For example, some Ceratozamia species are arborescent with stems up to one meter tall, often leaning or curved and rarely branching. Others are semi-hypogeous and often branching (Norstog and Nicholls, 1997). Leaflet width also varies drastically within the various species of Ceratozamia. For instance, variation goes from 3 to 5 mm in C. norstogii and C. zaragozae, to as much as 90-160 mm in C. euryphyllidia (Whitelock, 2004a). Despite this broad morphological variation, species have an extremely stable chromosome number 2n= 16 and karyotype generally 12m + 2sm + 2t (Vovides, 1983; Moretti, 1990).
There are several sequence-based methods that have been proposed for phylogenetic inference among closely related species such as amplified fragment length polymorphism (AFLP) and to a lesser extent inter-simple sequence repeat (ISSR), and random amplification of polymorphic DNA (RAPD, Simmons et al., 2007). The AFLP method is based on the selective amplification of genomic restriction fragments by PCR (Vos et al., 1995). The ISSR method involves amplification with a single primer composed of a short microsatellite sequence anchored at the 3' or 5' end by 2 to 4 arbitrary nucleotides (Zietkiewicz et al., 1994). The RAPD method uses a short primer (usually 10 bases) to amplify anonymous stretches of DNA (Williams et al., 1990). However, characters for phylogenetic analyses obtained with these methods have been questioned. For instance, RAPD are quick and easy, but notoriously difficult to replicate, AFLP and RAPD potentially generate comigrating non-homologous fragments (e.g. Rieseberg, 1996), and presence/absence characters for each allele treat all absences as homologous to one another. Band absence may be caused by a number of different factors such as loss of a primer-annealing site, insertions or deletions in the fragment between the 2 primer sites, or even experimental error. Consequently, it may be unlikely that the absence of bands in 2 individuals arose from an identical ancestral mutation. Therefore, the use of shared band absences for phylogenetic reconstruction may overestimate the relatedness among species.
Recently, a strategy involving the Sequence Characterized Amplified Region (SCAR; Paran and Michelmore, 1993) methodology was proposed to identify DNA sequence loci for species level phylogeny reconstruction (Bailey et al., 2004). These authors assessed variation from a number of non-coding cpDNA sequences and low copy number nuclear gene introns prior to embarking on the SCAR based studies. However, problems encountered for each of these genes prompted them to investigate the RAPD and SCAR based strategy for identifying potentially useful loci. In their paper they described very nicely the pros and cons of this strategy (Bailey et al., 2004; Hughes et al., 2006). Unfortunately, it involves a laborious part of cloning random amplified polymorphic DNA fragments (RAPD) prior to sequencing. The cloning step requires cutting and purifying RAPD fragments, digestion of fragments and vector with restriction enzymes, ligation of fragments and vector, transformation of competent cells, screening transformants for inserts and sequencing inserts for designing specific primers. Therefore, finding an easier and faster method for identifying polymorphic loci would be significant to circumvent the cloning step. Here, the Digested SCAR method (D-SCAR) is described to detect variable locisuitable for phylogenetic analyses that could be helpful for phylogenetic studies in recently diverged, infra-specific taxa or closely related species, such as in Ceratozamia.
Materials and methods
Taxon sampling and digested SCAR. Twenty-three exemplars of Ceratozamia representing 19 described species (2 with duplicate) and 1 recently named (with duplicate) were included in this study (Osborne et al., 2006; Vovides et al., 2012; Table 1). We did not include 2 recently described species from Southern Mexico, C. vovidesii and C. chimalapensis (Pérez-Farrera et al., 2007; Vovides et al., 2008b), due to unavailability of material at the time this research was performed. Genomic DNA of all taxa was extracted from field-documented live plants held at the National Mexican Cycad Collection at the Clavijero Botanic Garden (Instituto de Ecología, Xalapa) according González and Vovides (2002).
Prior to amplification, DNA was purified with Sephadex G50 (Sigma-Aldrich). To detect variable loci within Ceratozamia we used the Digested SCAR method (González, 2010). Six commercially available RAPD primers from kit "B" (OPB-5; OPB-7; OPB-10; OPB-13; OPB-15 and OPB-17), from Operon Technologies (Alameda, CA) were first used to explore genetic variation in 5 species of Ceratozamia. Approximately 0.01 μg of purified DNA was amplified by the polymerase chain reaction (PCR). Target DNA sequences were amplified by PCR in a MyCycler (Bio Rad, USA) Thermal Cycler. Reactions conditions for PCR amplification were performed in a 25 μl mixture containing 50 mM KCl, 10 mM Tris-HCl (pH 8.3), 1.5 mM MgCl2, 200 μM of each of the 4 deoxynucleoside triphosphates, 5 pmol of primer, 10-50 ng of template and 2.5 units of Taq polymerase. The cycle parameters were: an initial cycle of denaturation at 94o C for 2.5 min, annealing at 37o C for 1 min and extension at 72o C for 2 min. This initial cycle was followed by 44 cycles consisting of denaturation at 94o C for 1 min, annealing at 37o C for 1 min, extension at 72o C for 2 min and a final extension for 7 min at 72o C.
Band visualization and purification. Amplification products were resolved by electrophoresis on 1.2% agarose gels. Gels were run in 1 X TBE buffer at 60 volts for 3 h and stained with ethidium bromide. Bands were visualized with UV. PCR products between 500 to 800 bp present in at least 2 out of those 5 species were excised from the gel and purified with Wizard SV gel and PCR-clean up system (Promega, USA). Faint bands were re-amplified in order to obtain enough DNA for digestion.
Digestion, sequencing and alignment of the RAPD products. To circumvent the cloning step required by the usual SCAR method, RAPD products were digested with frequent-cutter restriction enzymes to isolate the 2 ends that have the same primer site and cannot be sequenced in the same reaction. This modification resulted in an easier and faster protocol for identifying polymorphic loci. The amplification products were digested with the restriction enzymes Alu I, Rsa I, Bst OI and Taq I according manufacturers instructions (Promega, USA). Digested products were electrophoresed in a 1.2% agarose gel for 2.5 hours at 60 volts and stained with ethidium bromide. Bands were observed with UV light and distinct digested fragments were removed from the gel, then purified and sequenced with the RAPD primer. Digestion of the RAPD fragments with restriction enzymes allowed separating both 5' ends, which contain the same primer site (González, 2010).
Sequence reaction was performed with the Big Dye Terminator v 3.1 Cycle Sequencing Kit (Applied Biosystems, Foster City USA) using the RAPD primer OPB-7. Although this primer is only 10 bp long, annealing temperature for sequencing was standard. Cycle conditions were: an initial denaturation at 95o C for 3 min, followed by 30 cycles consisting of denaturation at 95o C for 20 seg, annealing at 50o C for 20 seg, extension at 60o C for 3 min. Electrophoresis was performed in a 310 Genetic Analyzer sequencing system (ABI PRISM, Foster City USA) in our Institutional facilities. Alignment was performed using the Clustal V program (Higgins et al., 1992) within the Megalign software package (Lasergene DNASTAR Inc) with a penalty of 10 for introducing gaps and a penalty of 5 for the length of the gaps. The aligned products were used to design 2 specific primers for amplifying and sequencing all Ceratozamia spp., called CAV500-F (5'-ACCCGCTGTCGGACCAGAGCACCCAGC-3') and CAV500-R (5'-GGTGACGCAGGGAAGTGAGA GCGCTAGG-3').The cycle conditions for amplification with these primers were: an initial cycle of denaturation at 95o C for 5 min, followed by 30 cycles consisting of denaturation at 95o C for 1 min, annealing at 67o C for 1 min, extension at 72o C for 2 min and a final extension for 7 min at 72o C. Sequencing reactions were performed as described above. Sequences were easily aligned.
Sequence analyses. The aligned data set included the D-SCAR nucleotide sequences from 23 exemplars of Ceratozamia (data set 1). Base frequencies and pairwise uncorrected sequence distances for this data set were obtained using the program PAUP* version 4.0b8 (Swofford, 2001). Distances were calculated with all characters included. We used the BLAST-based Expect value (E) to describe the probability due to chance that a sequence match exists between our data and the GenBank sequence database (Altschul et al., 1997; http://blast.ncbi.nlm.nih.gov/Blast.cgi?PROGRAM=blastn&BLAST_PROGRAMS=megaBlast&PAGE_TYPE=BlastSearch&SHOW_DEFAULTS=on&LINK_LOC=blasthome).
Phylogenetic analyses. Due to scarce phylogenetic informative characters in data set 1 (see Results), phylogenetic analyses were performed including non-coding regions from cpDNA and nrDNA (ITS and trnL-F) from previous studies (González and Vovides, 2002, data set 2). Phylogenetic analyses were conducted using maximum parsimony (MP [PAUP*, ver. 4.0b8 Swofford, 2001]) and maximum likelihood (ML; GARLI v. 0.951 [Zwickl, 2006]). Zamia herrerae was selected as the outgroup (González and Vovides, 2002). The D-SCARE nucleotide sequences for this taxon were coded as missing data (?) because the designed primers for Ceratozamia did not amplify for species belonging to different genera of cycads. For MP analyses we executed branch and bound searches with furthest addition of sequences. Bayesian posterior probabilities (BP) for clades were estimated using MrBayes v. 3.1.2 [(e.g. Ronquist and Huelsenbeck, 2003]). The program jModelTest v. 0.1.1 (Guindon and Gascuel, 2003; Felsenstein, 2005; Posadas, 2008) was used to determine the best-fitted substitution model in ML and BP analyses. The Akaike information criterion was used to evaluate the fit of competing models. ML analyses were performed with model parameters fixed according values obtained with jModelTest. Searches consisted of 100 replicas to ensure that results were consistent. Each BP analysis comprised 2 independent 500 000 generation runs, with 4 chains (1 cold and 3 hot) each, until we reached an average standard deviation of split frequencies of 0.011. We sampled trees every 100th generation and discarded initial samples applying a "burnin" value of 1 250 generations before calculating the majority consensus tree and posterior probabilities for each clade. Branch support was also evaluated by bootstrap and jackknife analyses with PAUP*, ver. 4.0b8 (Swofford, 2001). Bootstrap was based on 500 heuristic replicates with TBR searches and MaxTrees set to 10 000. Jackknife analysis was based on 1 000 replicates and 10 iterations of random addition per replicate with 35% of characters deleted followed by TBR searches. All aligned positions were given equal weight. MP analyses were performed considering only informative characters (data matrix is available from the corresponding author). We used the following categories for bootstrap and jackknife support: <50% unsupported, 50%-70% weakly supported, 71%-85% moderately supported, 86%-100% highly supported. To quantify gain or loss of resolution between tree from data set 2 and the tree generated without the D-SCARE sequences, we used the normalized consensus fork index (nCFI; Colles, 1980). The nCFI measures tree disagreement as a function of the number of uncertain relationships (polytomies) in consensus trees having its maximum at complete congruence. All analyses were performed including gaps as "missing" data.
Results
Digested SCAR. From the 6 RAPD primers used in this study to find genetic variation in 5 species of Ceratozamia only primers OPB-7 and OPB-10 produced a few polymorphic bands. PCR products obtained, ranged in size from 240 to 800 bp. One sharp band of about 700 bp occurring in 2 species was selected for digestion from the assay with the primer OPB-7, and one faint band of about 600 bp existing in 3 species with the primer OPB-10. None of the 4 restriction enzymes tested digested the band produced with primer OPB-10. However, enzymes Rsa I and Bst OI produced clear digested fragments in the 700 bp band obtained with primer OPB-7. After sequencing both fragments digested with Bst OI only that of approximately 500 bp produced unambiguous sequence data indicating that the fragment very likely had 2 restriction sites, one of them close to the priming site of the 200 bp fragment that generated one small fragment not visible in the gel that prevented the annealing step in the sequencing reaction. After aligning the sequences of the 500 bp fragments for the 2 species of Ceratozamia, we selected 2 regions close to the 5' end of each DNA strand to design the primers CAV500-F and CAV500-R for amplifying all species. These newly designed primers amplified successfully all the species of Ceratozamia in this study.
Sequence analyses data set 1. Unambiguous alignments were obtained for the D-SCAR fragment. Alignment consisted of 20 species of Ceratozamia represented with 23 exemplars and 477 nucleotide positions (table 1). From the 477 characters, 470 (98.5%) were uninformative and 7 (1.5%) were parsimony informative. Although we confirmed with this novel strategy that genetic variation is remarkably low in this plant lineage, the sequenced fragment displayed greater levels of variation (1.5%) than those found in a non-coding cpDNA region previously studied for this group (0.2%; González and Vovides, 2002).
The resulting empirical nucleotide frequencies were A= 0.2387; C= 0.3229; G= 0.1711; T= 0.2671 with an evident higher amount of cytosines. Distances values between species were low. They ranged from 0 for several species of Ceratozamia to 0.04635 between C. matudae and C. kuesteriana. The BLAST search of the sequence data obtained for this D-SCAR fragment resulted in no significant similarity when the search was optimized for highly similar sequences (megablast). When the search was optimized for somewhat similar sequences (blastn) the maximum score of identity was found only with a sequence of the house mouse (Mus musculus L.) BAC (clone RP24-86O15), from chromosome 9.
Sequence analyses data set 2. Since there were only 7 informative characters in data set 1, our phylogenetic analyses also included ITS and trnL-F sequences from our previous studies (data set 2). We were interested to examine if these 7 extra nucleotide positions from the D-SCAR fragment added resolution and/or supported our previous hypothesis of phylogenetic relationships in Ceratozamia (González and Vovides, 2002). Final alignment of this data set consisted of 2727 nucleotide positions (1219 from ITS; 1031 from trnL-F; 477 from D-SCAR), and only 47 parsimony informative characters. From those, 37 were from the ITS, 3 from the trnL-F, and 7 from the D-SCAR fragment. The best-fit model of sequence evolution selected with the Akaike Information Criterion (AIC) for data set 2 was TIM3ef+G. Nucleotide frequencies and substitution rates values were as follows: "Lset base=equal nst=6 rmat=(1.9307 3.1438 1.0000 1.9307 3.8618 1.0000) rates=gamma shape=0.5050 ncat=4 pinvar=0". ML analyses with these model parameters resulted in a loglikelihood (-ln) score of -5991.93.
Phylogenetic results with data set 2. Parsimony analysis of data set 2 yielded 66 trees of 76 steps (CI= 0.7105; RI= 0.8281; RC= 0.5884), these values are lower than those found with the combined ITS and trnL-F data set alone (CI= 0.7541; RI= 0.8684; RC= 0.6549), indicating that the 7 additional informative characters from the D-SCAR fragment sequenced increased the levels of homoplasy. Visual inspection of trees produced with data set 2 showed an increase of resolution. The nCFI for sequence data 2 was 0.440 while nCFI for data set without D-SCAR sequences was 0.373. The higher value indicates a gain of resolution in consensus trees from data set 2 as a function of the number of fully resolved nodes in the trees (Fig. 1).
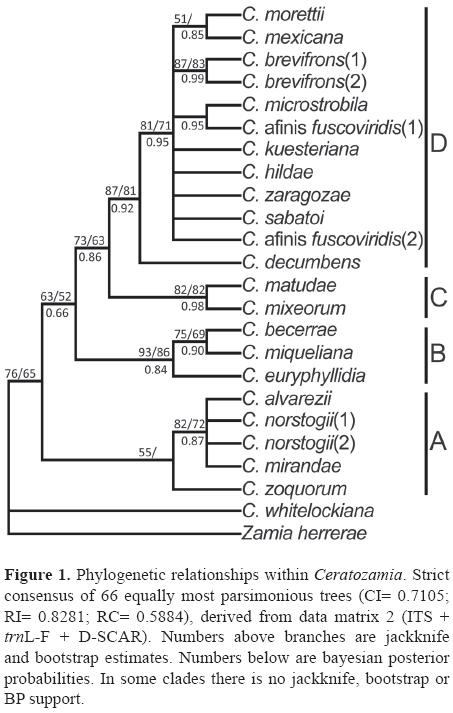
Phylogenetic analyses with data set 2 supported 4 main clades similar to those found in previous analyses within Ceratozamia (González and Vovides, 2002), but with 2 additional resolved monophyletic groups. One unsupported group formed by C. microstobila and C. afinis fuscoviridis (exemplar 1), and another moderately supported formed by C. becerrae and C. miqueliana. Three clades (A, B, C) were moderately supported and one (D) was highly supported (Fig. 1). Clade A was sister to clades B, C and D with moderate support. Clade A included C. zoquorum, C. mirandae, C. norstogii (1 and 2) and C. alvarezii. Clade B grouped C. euryphyllidia, C. miqueliana and C. becerrae. Clade C grouped C. mixeorum and C. matudae. Clade D comprised 12 exemplars of Ceratozamia with high values of jackknife, bootstrap and BP (87/81/0.95). Clade A corresponds to the C. norstogii complex (Stevenson, 1982; Perez-Farrera et al., 2004) and clade B to the C. miqueliana complex (Whitelock, 2004a, 2004b). In clade D, C. decumbens is sister to a large clade grouping 11 exemplars (Fig. 1), which contains the unresolved species of the C. kuesteriana and C. latifolia species complexes as defined by Vovides et al. (2004a). Within this large clade only the relationships between C. mexicana and C. morettii; both exemplars of C. brevifrons, and C. microstobila and C. afinis fuscoviridis (exemplar 1) were resolved. However, only the clade with the 2 exemplars of C. brevifrons was well supported (jackknife/bootstrap/Bp= 87/83/0.99). The addition of 7 informative characters from the D-SCAR fragment sequenced resulted in 2 new clades that were not revealed in previous analyses. One nested within clade D (C. microstobila and C. afinis fuscoviridis exemplar 1) with no support, and other within clade B (C. becerrae and C. miqueliana) with a jackknife/bootstrap/ BP support of 75/69/0.90. Topology of ML analysis (not shown) is similar to that of the MP, but with 2 additional branches resolved in clade D as follows: (C. kuesteriana [(C.microstobila, C. afinis fuscoviridis exemplar 1), C. sabatoi, C. afinis fuscoviridis exemplar 2, C. hildae]). However, only clade formed by C. microstobila, C. afinis fuscoviridis (1), C. sabatoi, C. afinis fuscoviridis (2) and C. hildae showed a BP support of 0.62.
Discussion
Sequence analysis. Studies based on common intergenic nuclear and chloroplast sequences reveal low level of molecular differentiation within the genus in contrast with its morphological variation. For example, no Ceratozamia species differed in nrDNA sequence by more than 2.5%, and in cpDNA sequence by more than 0.8%, whereas leaf morphology traits vary enormously in most species. Therefore, sequence divergence for these regions make it difficult to reconstruct the phylogeny of Ceratozamia particularly in terminal branches (Fig. 1). Nonetheless, tree consensus fork index was higher than without D-SCAR sequences, indicating tree topological agreement. Still, there was an increase in resolution entailing gain of evidence for testing homology hypotheses.
Phylogenetic relationships in Ceratozamia. The present phylogenetic analysis of chloroplast and nuclear DNA spacers and a novel DNA segment show the main clades recognized previously within Ceratozamia. Although not fully resolved, clades within Ceratozamia are consistent with distribution ranges of the species included in each clade (González and Vovides, 2002). Clades A, B and C contain species distributed in southern and southeastern Mexico, as well as around and south of the Neovolcanic mountain range of Pliocene-Quaternary (Pleistocene) age. Clade D comprises a group of species that occurrs in localities north and northeast of the Neovolcanic range. This is in agreement with the findings of Marshall and Liebherr (2000) whom identified 2 biogeographic assemblages for endemic species, one to the north, and another to the south of the Neovolcanic range. However, the grouping found within Ceratozamia does not quite reflect the taxonomic relationships proposed by Stevenson et al. (1986) or Whitelock (2004a, 2004b) based on observations on plant size; leaflet width; emergent leaf color or megastrobilus morphology, since both wide and narrow leaflet species are represented within the major clades. However, we can say that generally the species north of the Neovolcanic mountain range tend to have smaller trunks, often branching and bearing smaller cones than those occurring south of this range, although there are exceptions to this such as C. brevifrons and C. mexicana. There is also altitudinal variation correlated with climate and habitat, not attributed to plasticity. Generally narrow leaflet species of this genus occur in more xeric habitats (higher altitude habitats cf. C. zaragozae at 1 800 m.a.s.l. and C. norstogii at 1 100 m.a.s.l.) whereas those with wide leaflets are mostly found in the more humid or mesic habitats (cf. C. euryphyllidia and C. zoquorum at below 500 m altitude in tropical evergreen forest sensu Stevenson et al., 1986). After growing several individuals of these species under uniform greenhouse conditions at the botanic garden over a period of years, no appreciable differences have been observed in leaf and leaflet morphology (data not shown).
Seven additional characters from the D-SCAR fragment resolved relationships not previously detected within the C. miqueliana complex sensu Vovides et al. (2004a) in clade B. Ceratozamia euryphyllidia was found to be sister to C. miqueliana, and to C. becerrae. C. euryphyllidia is perhaps the most distinctive species in the genus (Stevenson et al., 1986). The unique morphological characters are the conspicuous leaves (up to 3 m long) and the highly obovate translucent leaflets with undulate margins. Ceratozamia miqueliana, although similar in leaflet shape, differs significantly in the smaller size of its leaves and leaflets, but lacks the undulate margins of C. euryphyllidia (Stevenson et al., 1986). Neither the present analysis nor the previous (González and Vovides, 2002), resolve relationships among species within the C. norstogii complex (C. mirandae, C. norstogii, and C. alvarezii) in clade A or relationships in most species in clade D.
The small number of mutations giving rise to the 4 clades shown in figure 1 could be partially explained by the considerable long life cycle in Ceratozamia and its reduced number of generations, as proposed by González and Vovides (2002). Generation times (from seed germination to reproductive stages) under optimal cultivation conditions span at least 15 years, and this period can be safely doubled for conditions in the wild. Therefore, only about 300 generations of a putative Ceratozamia species would have occurred since the end of the Pleistocene 10 thousands years ago, suggesting that most extant Ceratozamia species have a very recent origin. This is in agreement with recent diversification in the cycads lineage as proposed by Nagalingum et al. (2011). Another suggestion is that a severe bottleneck in the genus may have caused the drop in the level of variation or that morphological variation in some species is only a phenotypical expression of environmental conditions as pointed out by Stevenson et al. (1986). However, this has been ruled out since adult species in question grown under uniform conditions in the Botanic Garden do not change phenotypically, especially in leaflet shape (see Pérez-Farrera et al., 2001; Vovides et al., 2004b, 2008b). It has been observed that some species appear morphologically identical in their seedling and juvenile stages and pinnae, but this similarity is soon outgrown with age (Dyer, 18821886). Previous studies have shown that morphology exhibits a correlation with habitat (Stevenson et al., 1986). Our phylogenetic studies suggest that the biogeography and high morphological variation of this genus may be explained by vicariance through orogenesis followed by incipient speciation.
Utility of the digested SCAR method. D-SCAR sequence data identified variable DNA regions through a RAPD based system, and helped us to improve phylogenetic relationships within Ceratozamia. Since this method initially uses RAPD markers, short primers are employed to amplify anonymous stretches of DNA. Therefore, a universal set of primers of arbitrary nucleotide sequence can be applied for potentially developing many loci in a group of interest. Moreover, the random amplification of regions across plant genomes eliminates the restriction of working with known gene regions too often insufficiently variable. Bailey et al. (2004) discussed in detail the pros and cons of using the SCAR approach to find polymorphic loci for phylogenetic studies. Some advantages are that most loci sampled are nuclear encoded and bi-parental inherited; no prior sequence information is necessary and universal RAPD primers can be used for the initial amplification and screening. Some disadvantages are increased potential for DNA contamination-related problems, difficulties amplifying more divergent taxa, and the lack of universally applicable primers (Bailey et al., 2004).
The D-SCAR approach presented here remains as an option for avoiding cloning the RAPD fragments. The almost complete absence of genetic variability within Ceratozamia prevented us to improve substantially the phylogenetic relationships within the genus. Nonetheless, the method allowed us to compare in an easier method, variable DNA fragments for a closely related plant species and is comparable to the use of any other DNA sequence region in phylogeny reconstruction (Bailey et al., 2004). Sequence variation from the D-SCAR method was 1.5% compared with the 0.2% from a non-coding cpDNA region. Nevertheless, the D-SCAR method had a weakness in this particular study. Along with the potential strengths of being able to find variable loci within Ceratozamia, the cost per mutation seems relatively high given the amount of informative characters present within the genus. Notwithstanding, our results highlighted the usefulness of the D-SCAR method, especially for phylogenetic studies in closely related species with low sequence variation. The resulted low E value in the blastn search indicated this was a novel segment of DNA not previously sequenced, which opened up the opportunity to evaluate new DNA markers for phylogenetic studies in Ceratozamia. Currently we are also testing the utility of applying this technique to find genetic variation within populations of the Mexican plant species Beaucarnea recurvata Lem., with promising results.
Rapid advances inDNA sequencing are currently leading an era that will revolutionize all biological disciplines. Massively parallel sequencing (MPS, often called next-generation sequencing) is now being implemented in plant systematics studies and other comparative approaches (e.g. Shadt et al., 2010; Orlando, et al., 2011; Eagan et al., 2012; Steele et al., 2012). Systematists may soon no longer need to choose between more taxa or more characters because the increasing accessibility and affordability of this technology for obtaining DNA sequences (Straub et al., 2012). However, it is important to recognize the current limitations of MPS. Sequencing prices have fallen considerably in the world's genome centers that provide such services; however for smaller research groups, along with the substantial investment in infrastructure, data management and analysis, time, and personnel, costs are still prohibitive. Moreover, there are limits in read length, error rates, and assembly algorithm issues, all of which remain a challenge (Morozova and Marra, 2008; Kircher and Kelso, 2010; Eagan et al., 2012). Therefore, the D-SCAR approach presented here will remain as a viable option for the near future to expediently find variable DNA loci for phylogenetic studies in closely related, recently diverged or infra-specific taxa for any organism. This strategy can also be easily implemented for developing species-specific molecular markers with the purpose of DNA barcode identification.
Acknowledgments
This work was supported by a grant from CONACYT-SEMARNAT-2002-C01-0183. The authors also thank the Jardín Botánico Francisco Javier Clavijero for access to the National Mexican Cycad collection where living material was obtained for DNA extraction, to Victor Luna for assistance in collecting this material and to Cristina Bárcenas for technical assistance at the beginning of this research. We also thank two anonymous reviewers for their comments to improve the manuscript.
Literature cited
Altschul, S. F., T. L. Madde, A. A. Schäffer, J. Zhang, Z. Zhang, W. Miller and D. J. Lipman. 1997. Gapped BLAST and PSI-BLAST: a new generation of protein database search programs. Nucleic Acids Research 25:3389-3402. [ Links ]
Bailey, C. D., C. E. Hughes and S. A. Harris. 2004. Using RAPDs to identify DNA sequence loci for species level phylogeny reconstruction: an example from Leucaena (Fabaceae). Systematic Botany 29:4-14. [ Links ]
Barfuss, M., R. Samuel, W. Till and T. F. Stuessy. 2005. Phylogenetic relationships in subfamily Tillandsioideae (Bromeliaceae) based on DNA sequence data from seven plastid regions. American Journal of Botany 92:337-351. [ Links ]
Bogler, D. J. and J. Francisco-Ortega. 2004. Molecular systematic studies in cycads: Evidence from trnL intron and ITS2 rDNA sequences. Botanical Review 70:260-273. [ Links ]
Chew, T., E. D. Luna and D. González. 2010. Phylogenetic relationships of the pseudobulbous Tillandsia species (Bromeliaceae) inferred from cladistic analyses of the ITS 2, 5.8S ribosomal RNA gene, and ETS sequences. Systematic Botany 35:86-95. [ Links ]
Colless, D. H. 1980. Congruence between morphometric and allozyme data for Menidia species: a reappraisal. Systematic Zoology 29:288-299. [ Links ]
Dyer, W. 1882-1886. Cycadaceae. Biologia Centrali-Americana 3:190-195. [ Links ]
Egan, A. N., J. Schlueter and D. M. Spooner. 2012. Applications of next-generation sequencing in plant biology. American Journal of Botany 99:175-185. [ Links ]
Ekenäs, C., B. G. Baldwin and K. A. Andreasen. 2007. A molecular phylogenetic study of Arnica (Asteraceae) low chloroplast DNA variation and problematic subgeneric classification. Systematic Botany 32:917-928. [ Links ]
Felsenstein, J. 2005. PHYLIP (Phylogeny Inference Package) version 3.6. Distributed by the author. Departament of Genome Sciences. University of Washington, Seatle. [ Links ]
González, D. and A. P. Vovides. 2002. Low intralineage divergence in Ceratozamia (Zamiaceae) detected with nuclear ribosomal DNA ITS and chloroplast DNA trnL-F non-coding region. Systematic Botany 27:654-661. [ Links ]
González, D., A. P. Vovides and C. Bárcenas. 2008. Phylogenetic relationships of the Neotropical genus Dioon (Cycadales, Zamiaceae) based on nuclear and chloroplast DNA sequence data. Systematic Botany 33:229-236. [ Links ]
González, D. 2010. Optimización al método SCAR (Sequence Characterized Amplified Region) que favorece el aislamiento de loci polimórficos para estudios filogenéticos en taxa cercanamente relacionados. Revista Mexicana de Biodiversidad 81:183-185. [ Links ]
Guindon, S. and O. Gascuel. 2003. A simple, fast and accurate method to estimate large phylogenies by maximumlikelihood. Systematic Biology 52:696-704. [ Links ]
Higgins, D. G., A. J. Bleasby and R. Fuchs. 1992. CLUSTAL V: Improved software for multiple sequence alignment. CABIOS 8:189-191. [ Links ]
Horres, R., G. Zizka, G. Khal and K. Weising. 2000. Molecular phylogenetics of Bromeliaceae evidence from trnL (UAA) intron sequences of the chloroplast genome. Plant Biology 2:306-315. [ Links ]
Hughes, C. E., R. J. Eastwood and C. D. Bailey. 2006. From famine to feast? Selecting nuclear DNA sequence loci for plant species-level phylogeny reconstruction. Philosophical Transactions of the Royal Society B 361:211-225. [ Links ]
Kircher, M. and J. Kelso. 2010. High-throughput DNA sequencing-concepts and limitations. Bioessays 32:524-536. [ Links ]
Kyoda, S. and H. Setoguchi. 2010. Phylogeography of Cycas revoluta Thunb. (Cycadaceae) on the Ryukyu Islands very low genetic diversity and geographical structure. Plant Systematics and Evolution 288:177-189. [ Links ]
Marshall, C. J. and J. K. Liebherr. 2000. Cladistic biogeography of the Mexican transition zone. Journal of Biogeography 27:203-216. [ Links ]
Moretti, A. 1990. Karyotypic data on north and central American Zamiaceae, (Cycadales) and their phylogenetic implications. American Journal of Botany 77:1016-1029. [ Links ]
Morozova, O. and M. A. Marra. 2008. Applications of next-generation sequencing technologies in functional genomics. Genomics 92:255-264. [ Links ]
Norstog, K. J. and T. J. Nicholls. 1997. The biology of the cycads. Cornell University Press, Ithaca, New York. 363 p. [ Links ]
Nagalingum, N. S., C. R. Marshall, T. B. Quental, H. S. Rai, D. P. Little and S. Mathews. 2011. Recent synchronous radiation of a living fossil. Science 334:796-799. [ Links ]
Osborne, R., D. W. M. Stevenson and A. P. Vovides. 2006. What is Ceratozamia fuscoviridis ? Delpinoa 48:5-10. [ Links ]
Paran, I. and R. W. Michelmore. 1993. Development of reliable PCR based markers linked to downy mildew resistance genes in lettuce. Theoretical and Applied Genetics 85:985-993. [ Links ]
Pérez-Farrera, M. A., A. P. Vovides and C. Iglesias. 2001. A new species of Ceratozamia (Zamiaceae) from Chiapas, Mexico. Botanical Journal of the Linnean Society 137:77-80. [ Links ]
Pérez-Farrera, M. A., A. P. Vovides, L. Hernández-Sandoval, D. González and M. Martínez. 2004. A morphometric analysis of the Ceratozamia norstogii complex (Zamiaceae). In Cycad classification: concepts and recommendations, T. Walter and R. Osborne (eds.). Cabi Publisher, Cambridge, Massachusetts. p. 127-136. [ Links ]
Pérez-Farrera, M. A., J. González-Astorga and S. Avendaño. 2007. A new species of Ceratozamia (Zamiaceae) from the Sierra Madre de Chiapas, Mexico, with comments on species relationships. Botanical Journal of the Linnean Society 153:393-4Posada, D. 2008. jModelTest: phylogenetic model averaging. Molecular Biology and Evolution. 25:1253-1256. [ Links ]
Potter, D., J. J. Luby and R. E. Harrison. 2000. Phylogenetic relationships among species of Fragaria (Rosaceae) inferred from non-coding nuclear and chloroplast DNA sequences. Systematic Botany 25:337-348. [ Links ]
Rieseberg, L. 1996. Homology among RAPD fragments in interspecific comparisons. Molecular Ecology 5:99-105. [ Links ]
Ronquist, F. and J. Huelsenbeck. 2003. MrBayes 3: Bayesian phylogenetic inference under mixed models. Bioinformatics 19:1572-1574. [ Links ]
Shaw, J., E. B. Lickey, J. T. Beck, S. B. Farmer, W. Liu, J. Miller, K. C. Siripun, C. T. Winder, E. E. Schilling and R. L. Small. 2005. The tortoise and the hare II relative utility of 21 noncoding chloroplast DNA sequences for phylogenetic analysis. American Journal of Botany 92:142-166. [ Links ]
Simmons, M. P., L.-B. Zhang, C. T. Webb and K. Müller. 2007. A penalty of using anonymous dominant markers (AFLPs, ISSRs and RAPDs) for phylogenetic inference. Molecular Phylogenetics and Evolution 42:528-542. [ Links ]
Small, R. L., J. A. Ryburn, R. C. Cronn, T. Seelanan and J. F. Wendel. 1998. The tortoise and the hare choosing between noncoding plastome and nuclear Adh sequences for phylogeny reconstruction in a recently diverged plant group. American Journal of Botany 85:1301-1315. [ Links ]
Soltis, D. E. and P. S. Soltis. 1998. Choosing an approach and an appropriate gene for phylogenetic analysis. In Molecular systematics of plants II, D. E. Soltis, P. S. Soltis and J. F. Doyle (eds.). Kluwer Academic Publishers, New York. p. 1-42. [ Links ]
Steele, P. R., K. L. Hertweck, D. Mayfield, M. R. McKain, J. Leebens-Mack and J. C. Pires. 2012. Quality and quantity of data recovered from massively parallel sequencing: examples in Asparagales and Poaceae. American Journal of Botany 99:330-348. [ Links ]
Stevenson, D. 1982. A new species of Ceratozamia (Zamiaceae) from Chiapas, Mexico. Brittonia 34:181-184. [ Links ]
Stevenson, D., S. Sabato and M. Vázquez-Torres. 1986. A new species of Ceratozamia (Zamiaceae) from Veracruz, Mexico with comments on species relationships, habitats, and vegetative morphology in Ceratozamia. Brittonia 38:17-26. [ Links ]
Straub, S. C. K., M. Parks, K. Weitemier, M. Fishbein, R. C. Cronn and A. Liston. 2012. Navigating the tip of the genomic iceberg: next-generation sequencing for plant systematics. American Journal of Botany 99:349-364. [ Links ]
Swofford, D. L. 2001. PAUP* Phylogenetic Analysis Using Parsimony (*and other methods), version 4.0b8. Sinauer Associates, Sunderland, Massachusetts. [ Links ]
Vos, P., R. Hogers, M. Bleeker, M. Reijans, T. van de Lee, M. Hornes, A. Frijters, J. Pot, J. Poleman, M. Kuiper and M. Zabeau. 1995. AFLP: a new technique for DNA fingerprinting. Nucleic Acids Research 23:4407-4414. [ Links ]
Vovides, A. P. 1983. Systematic studies on the Mexican Zamiaceae I. Chromosome numbers and karyotypes. American Journal of Botany 70:1002-1006. [ Links ]
Vovides, A. P., M. A. Pérez-Farrera, D. González and S. Avendaño. 2004a. Relationships and phytogeography in Ceratozamia (Zamiaceae). In Cycad classification: concepts and recommendations, T. Walter and R. Osborne (eds.). Cabi Publisher, Cambridge, Massachusetts. p. 109-125. [ Links ]
Vovides, A. P., M. A. Pérez-Farrera, B. Schutzman, C. Iglesias, L. Hernandez-Sandoval and M. Martínez. 2004b. A new species of Ceratozamia (Zamiaceae) from Tabasco and Chiapas, Mexico. Botanical Journal of the Linnean Society 146:123-128. [ Links ]
Vovides, A. P., S. Avendaño, M. A. Pérez-Farrera and J. González-Astorga. 2008a. A new species of Ceratozamia (Cycadales, Zamiaceae) from Veracruz, Mexico. Novon 18:109-114. [ Links ]
Vovides, A. P., M. A. Pérez-Farrera, J. González-Astorga and C. Iglesias. 2008b. A new species of Ceratozamia (Zamiaceae) from Oaxaca, Mexico with comments on habitat and relationships. Botanical Journal of the Linnean Society 157:169-175. [ Links ]
Vovides, A. P., S. Avendaño, M. A. Pérez-Farrera and D. W. M. Stevenson. 2012. What is Ceratozamia brevifrons (Zamiaceae)? Brittonia 64:35-42. [ Links ]
Whitelock, L. M. 2004a. Classification concepts in Ceratozamia (Zamiaceae). In Cycad classification: concepts and recommendations, T. Walter and R. Osborne (eds.). Cabi Publisher, Cambridge, Massachusetts. p. 95-108. [ Links ]
Whitelock, L. M. 2004b. Range and variation in the genus Ceratozamia (Zamiaceae). Botanical Review 70:235-239. [ Links ]
Williams, J. G. K., A. R. Kubelik, K. J. Livak, J. A. Rafalski and S. V. Tingey. 1990. DNA polymorphisms amplified by arbitrary primers are useful as genetic markers. Nucleic Acids Research 18:6531-6535. [ Links ]
Zietkiewicz, E., A. Rafalski and D. Labuda. 1994. Genome fingerprinting by Simple Sequence Repeat (SSR)-anchored polymerase chain reaction amplification. Genomics 20:176-183. [ Links ]
Zwickl, D. 2006. Genetic algorithm approaches for the phylogenetic analysis of large biological sequence datasets under the maximum likelihood criterion. Ph. D. dissertation. The University of Texas at Austin. Austin, Texas. 115 p. [ Links ]

