


Servicios Personalizados
Revista

Articulo
 Inglés (pdf)
 Artículo en XML
 Referencias del artículo
 Enviar artículo por email
Indicadores
 Citado por SciELO
 Links relacionados
-
 Similares en
SciELO
Similares en
SciELO
Compartir

 Permalink
Revista mexicana de biodiversidad
versión On-line ISSN 2007-8706versión impresa ISSN 1870-3453
Rev. Mex. Biodiv. vol.80 no.1 México abr. 2009
Conservación
Genetic diversity and conservation of the Resplendent Quetzal Pharomachrus mocinno in Mesoamerica
Diversidad genética y conservación del quetzal Pharomachrus mocinno en Mesoamérica
Sofía Solórzano1,*, Mara García–Juárez2 and Ken Oyama2
1 FES Iztacala, Universidad Nacional Autónoma de México. Avenida de los Barrios No. 1. Los Reyes Iztacala, 54090 Tlalnepantla, Estado de México, México.
2 Centro de Investigaciones en Ecosistemas, Universidad Nacional Autónoma de México. Antigua carretera a Pátzcuaro 8701. San José la Huerta, 58090 Morelia, Michoacán, México.
*Correspondent:
solorzanols@campus.iztacala.unam.mx
Recibido: 24 mayo 2007
Aceptado: 08 diciembre 2008
Abstract
In this study, we analyzed the genetic variation of quetzals (Pharomachrus mocinno) throughout their geographic distribution to determine conservation targets. This species is found in patchy isolated cloud forests from Mexico to Panama. A multidimensional scaling and UPGMA analysis of a 286 RAPD fragment set resolved 3 genetic groups: cluster 1 (Mexican localities), cluster 2 (Guatemala, Nicaragua and El Salvador) and cluster 3 (Panama). The mean genetic diversity estimated by the Shannon index was 0.38, 0.22 and 0.32, for clusters 1, 2, and 3, respectively. The genetic differentiation among clusters was statistically significant. The highest percentage of genetic variation (70.86%) was found within populations using an AMOVA analysis. Our results suggest that within the quetzal species, there are 3 genetic groups that should be considered as independent conservation targets and included in a global Mesoamerican conservation program.
Key words: conservation priority units, Pharomachrus mocinno, quetzal, RAPD markers, threatened species.
Resumen
En este estudio, analizamos la variación genética del quetzal (Pharomachrus mocinno) a lo largo de su distribución geográfica con la finalidad de determinar prioridades de conservación. Esta especie se encuentra desde México hasta Panamá en bosques de niebla fragmentados y aislados. Un análisis escalar multidimensional y un UPGMA de un conjunto de 286 fragmentos de RAPD resolvieron 3 grupos genéticos: grupo 1, localidades mexicanas; grupo 2, Guatemala, Nicaragua y El Salvador, y grupo 3, Panamá. La media de la diversidad genética estimada con el índice de Shannon fue de 0.38, 0.22 y 0.32, para los grupos 1, 2 y 3, respectivamente. La diferenciación genética entre grupos fue estadísticamente significativa. El análisis de AMOVA detectó que el porcentaje más alto de variación genética (70.86%) está dentro de las poblaciones. Nuestros resultados sugieren que dentro de la especie de quetzal, existen 3 grupos genéticos que deben ser considerados como prioridades de conservación independientes y ser incluidas en un programa global mesoamericano de conservación.
Palabras clave: unidades de conservación prioritarias, Pharomachrus mocinno, quetzal, RAPD, especies amenazadas.
Introduction
The destruction and fragmentation of natural habitats and the overexploitation of particular species have been identified as the main threats to wild populations (IUCN, 2008). These processes cause the decline and isolation of remnant populations, modifying their genetic attributes through processes that eventually may lead to local extinctions (Frankham et al., 2002). The identification of conservation priority units is one of the main goals of conservation genetics. The efforts to define these conservation targets have been focused mainly on 2 contrasting levels. The first one is the determination of conservation priority units at the species level, which requires information on population genetics and ecology to evaluate its evolutionary potential (Ryder, 1986). The second level is the delineation of key conservation areas by considering the global threatened category of the species that compose the community, including ecological traits such as restricted–range species, the habitat usage determined by the species behavior and the temporal species assemblages (Eken et al., 2004). Both approaches are not mutually exclusive, but the species level could support a community level proposal (e.g. Juutinen et al., 2008; Poulin et al., 2008). At the level of species, Moritz (1994a, 1994b) emphasizes the use of genetic criteria to define conservation priorities (King and Burke, 1999; Young, 2001). The Management Units (MUs) and the Evolutionary Significant Units (ESUs) are 2 of the most convincing methods to define priority conservation units (Moritz, 1994a, 1994b). MUs are defined as a population or a group of individuals with high allelic differences, regardless the evolutionary history given by these alleles. In contrast, the ESUs are populations showing exclusive genetic properties (e.g. mtDNA haplotypes detected in a single locality) and explained by historical isolation, and visualized as monophyletic clades in a population phylogenetic tree.
In animals, mitochondrial DNA (mtDNA) is a robust marker for the detection of historical processes (Rhymer et al., 2005), but it is not an appropriate marker to find MUs due to its relatively low resolution at the intraspecific level (Qui–Hong et al., 2004). In order to find MUs within the genetic groups studied via mtDNA, there are more appropriate molecular markers that serve to infer recent population history and contemporary gene flow between fragmented subpopulations. Among these molecular markers are microsatellites, restriction fragment length polymorphisms (RFLP), and random amplified polymorphic DNA (RAPD).
RAPD markers are suitable for most taxa because they detect high allelic variation, which is useful to address a variety of ecological and evolutionary issues (Aagaard et al., 1998; Semerikov et al., 2005). However, these markers are not able to detect codominance, impeding the resolution of heterozygous genotypes, and require a careful control of PCR conditions for repeatability (Williams et al., 1990; Haig, 1996; Parker et al., 1998; Ferreyra et al., 2007). Their random character limits the ability of RAPD to describe evolutionary histories of populations because these fragments are not necessarily from the same regions of the genome, even though they appear to be the same size, a phenomenon known as PCR–based size homoplasy.
Despite all these restrictions, RAPD markers are very useful in diverse types of studies such as population genetics (e.g. Susini et al., 2007; Wei et al., 2008), taxonomy (Williams and Clair, 1993), hybridization (e.g. Facey et al., 2007; Milne and Abbot, 2008), gene mapping and gene isolation (e.g. Huei–Mei et al., 2007), and ecology of isolated populations (e.g. Schlüter et al., 2007; Wood and Gardner, 2007). In the particular case of birds, RAPDs have detected greater genetic diversity than other molecular markers (Nusser et al., 1996; Haig et al., 1996, 2001).
The Resplendent Quetzal (Pharomachrus mocinno) is an emblematic case of an endemic threatened species. This bird is endemic to Mesoamerica and its habitat ranges from southern Mexico to western Panama. However, this pattern of geographic distribution is discontinuous with different levels of connectivity among remnant populations. The forest destruction that has occurred in the last few decades can explain the current quetzal distribution and its small population sizes (Solórzano et al., 2003). This situation placed quetzals in the IUCN category of "lower risk near threatened" (IUCN, 2008).
Recently, to help in quetzal conservation, Solórzano et al. (2004) found 2 ESUs defined as monophyletic groups according to genetic variation found in mtDNA (Solórzano et al., 2004). The northern ESU corresponded to the traditional subspecies P. m. mocinno that includes individuals from Mexico, Guatemala, El Salvador and Nicaragua, and the southern ESU consisted of P. m. costaricensis including individuals from Panama. However, mtDNA did not resolve internal grouping within these 2 ESUs, and a higher resolution of genetic groups within P. mocinno would strengthen conservation proposals. To identify conservation targets of quetzal, we analyzed the same samples used by Solórzano et al. (2004) using RAPDs, expecting to find more genetic resolution within this species throughout its distribution.
Materials and methods
Study species. We used the same 25 blood samples collected by Solórzano et al. (2004). All sampling sites represent quetzal breeding habitats and are located between 1800 to 2300 masl. In these forests, the climate is very humid with dense clouds and a mean annual rainfall of 4500 mm and mean temperature of 16°C (Solórzano et al., 2000).
During the quetzal breeding season (February to May) of 2000 and 2001, 500 µL of blood from the major brachial wing vein of each captured individual was sampled. All samples were stored at ambient temperature in buffer solution (Hillis et al., 1996) and permanently stored at –70° C in the laboratory. These samples represent 5 of the 7 countries in which this species occurs (Fig. 1). According to the 2 ESUs identified by Solórzano et al. (2004), in this study we have the following localities represented: ESU P. m. mocinno (northern populations): Mexico [El Triunfo Biosphere Reserve (ET), N = 8; Finca Santa Cruz (FC), N = 1; and Northern Mountains (NM)], N = 1; Guatemala [Sierra de las Minas Biosphere Reserve (SM), N = 3 and Biotopo Quetzal (BQ)], N = 1; El Salvador [National Park Montecristo (PM)], N = 1; and Nicaragua [Southwest Nicaragua (PA)], N = 1. ESU P. m. costaricensis (southern populations): Chiriquí (BG), N = 9; 1 male quetzal of unknown origin (UN) but putatively from Guatemala was included in this study (Fig. 1).
Genetic analyses. Total genomic DNA was isolated using standard protocols for proteinase K—SDS digestion and phenol–chloroform extraction, and then precipitated with ethanol (Sambrook et al., 1989). The DNA pellet was diluted in 30 µL of H2O and stored at –70°C.
We tested 60 primers of 10 base length from primer sets OPA, OPB and OPC from Operon Technologies Inc. (Alameda, California USA). These 60 primers were tested, carefully observing the same PCR conditions, quantifying 10 ng of total genomic DNA for all PCR reactions. All PCR reactions were conducted in the same PTC–100 MJ Research thermocycler (GMI Inc. Ramsey, Minnesota USA) to reduce the variation of temperature ramping rate and avoid unspecific PCR fragments. For each primer, all 25 samples were amplified in the same PCR run to avoid variation between runs. From these assays, we eliminated 36 primers because they did not show repeatability of their fragments in experimental assays. The other 24 primers were selected because they consistently showed clear, discrete and reproducible bands in all 25 samples of quetzal.
All PCR reactions contained 1X PCR buffer (20mM Tris HCl, PH 8.4 and 50mM KCl), 2mM MgCl2, 0.1 mM of each dNTP, 5 pM of random primer, 1.5 U of TaqPol (Operon Technologies Inc., Alameda, California), and 10 ng of total genomic DNA in a total reaction volume of 25 µL. PCR parameters were 94 °C for 2 min, followed by 44 cycles of 94 °C for 1 min, 36 °C for 1 min, and 72 °C for 2 min. All PCR assays included a negative control (assay with all chemicals components but without DNA template to check for contamination). The PCR products were separated on 1.2 % agarose gels with 0.5 X TBE buffer containing 0.5 µg/ml of ethidium bromide and run at 200 V for 1.5 h. In all runs a DNA ladder of 123 bp was included to size the bands produced by each primer. The gels were visualized in a Stratagene 400 transilluminator UV light. The gels resulting from reactions with each primer were photographed on Polaroid 667 film. Photographs were interpreted to obtain the banding pattern of each individual.
RAPD bands are scored as dominant markers, which means that they are di–allelic with a band present or absent, which is scored as the 2 alleles of a locus; thus the loci are inferred as bands showing a particular size. Therefore, to calculate average similarity and measures of genetic distance using RAPD banding patterns it is necessary to use statistical analysis modified for dominant markers and assuming a Hardy Weinberg departure. To estimate genetic distances among samples, multivariate analysis is frequently applied to construct spatial relationships among populations (e.g. Clark and Lanigan, 1993; Wolfe and Liston, 1998; Semagn et al., 2000). Here, we first computed genetic distances among samples using the method implemented in POPOGENE V. 1.32 (Yeh and Yang, 2000) that is based on modified distances of Nei (1973, 1978). This matrix was analyzed in a multivariate program for clustering the samples (McCune and Mefford, 1999) based on an UPGMA method and a bootstrap analysis was incorporated to estimate the robustness of the branches of the dendrogram. Additionally, we used a multivariate analysis to estimate the similarities of allelic frequencies and derive a spatial model from Jaccard distances and to plot a graphic representation of the spatial relationships among all samples (McCune and Mefford, 1999).
In the clusters detected with the analyses described above, we proceeded to estimate the mean genetic diversity expressed by the Shannon Index (HS = –Σ(PILOG2PI, Williams et al., 1990) over all loci. Additionally, we estimated the mean HT, HS and Gst for grouped data, considering each cluster as a different genetic group and assuming Hardy Weinberg disequilibrium using POPGENE V. 1.32 (Yeh and Yang, 2000). The differentiation index (ΦST) between clusters was estimated with Arlequin V. 3.1 software (Excoffier, 2006), regarding RAPDs as a type of RFLP data. We estimated the variance distribution among the clusters (groups) found in the UPGMA analysis, applying a molecular analysis of variance (AMOVA) (Excoffier, 2006).
Results
Two hundred and eighty–6 RAPD markers were scored for 25 quetzal individuals. The number of RAPD bands amplified varied from 7 (OPA20, OPB6 and OPC15) to 17 (OPB2 and OPC7) among the 24 primers used. These primers amplified bands with sizes ranging from 246 to 3690 bp (Table 1). None of the samples exhibited identical banding patterns, and as a result we obtained 25 different genotypes. Seventeen bands amplified from the operons A10, B2, B6, B7, B12, B14, B15, C2 and C7 were obtained in most samples of P. m. mocinno and in the individual BG–20 of P. m. costaricensis.
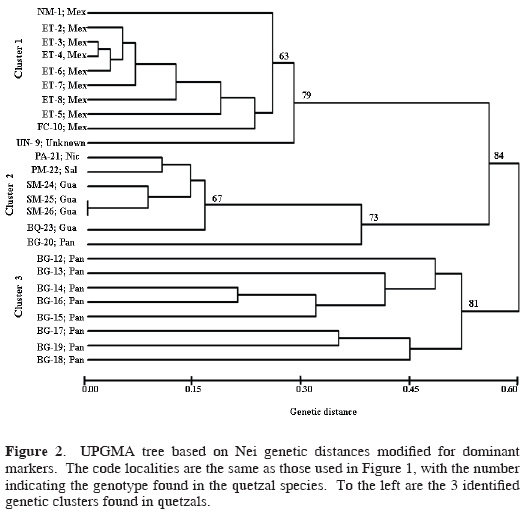
The UPGMA dendrogram formed 3 genetic clusters supported with high bootstrap values (Fig. 2). Cluster 1 grouped individuals from 3 Mexican localities and the quetzal of unknown origin; cluster 2 joined individuals from Guatemala, El Salvador, and Nicaragua, and the individual BG–20 from Panama (Fig. 2); and cluster 3 contains individuals only from Panama. These 3 clusters were maintained in the multivariate analysis (describing the spatial distribution of data), but the individual BG–20 from Panama was joined to cluster 3 (Fig. 3). The results of this analysis found that axis 1 explained 55.4% of the variation, axis 2 explained 8.12%, and axis 3 explained 6.15%; the differences among the 3 eigenvalues were significant (P < 0.05).
Across the species range, 94% of the bands were polymorphic. While cluster 1 showed 86% of polymorphic loci, cluster 2 showed 40% of polymorphic loci, and cluster 3 had 74% of polymorphic loci. The Shannon diversity index varied among primers ranging from 0.01 diversity (OPA2, Cluster 1) to 0.50 (OPAB6, OPC17, Cluster 2). Clusters 1 and 3 showed higher mean genetic diversity than cluster 2 (Table 1). The genetic diversity calculated for grouped data (each cluster representing a distinct group) found a total diversity of HT = 0.25 for the 3 groups, and the mean diversity for the groups was HS= 0.20. The mean genetic differentiation among grouped clusters had a GST = 0.19. The paired genetic differentiation (ΦST) between these clusters was significant: cluster 1 and cluster 2 (Φst = 0.32), cluster 1 and cluster 3 (ΦST = 0.47), cluster 2 and cluster 3 (ΦST = 0.31). The AMOVA analysis showed that 24.13% of the variance occurs among populations within clusters (groups), 70.86% within populations, and 5.01% among the 3 clusters.
Discussion
RAPD markers prove to be a valuable tool for estimating genetic diversity and for the identification of conservation targets among quetzal populations throughout Mesoamerica. We support the use of RAPDs to evaluate genetic diversity, to identify clustering within species, and to estimate genetic similarities as have been shown in other studies that used RAPDs to analyze intraspecific genetic diversity. Solórzano et al. (2004) analyzed the genetic variation of quetzals using mtDNA, which resolved into 2 monophyletic groups that were interpreted as a result of a historical isolation. In contrast, 3 genetic clusters were identified with the RAPD banding patterns, which would reflect recent patterns of gene flow and the ecologic effects of recent forests fragmentation caused by human activities.
The 3 clusters detected in this study have a geographical concordance with genetic distinctiveness, indicating that they can be considered as conservation priorities. However, given the small sampling size this suggestion must be taken with caution. Undoubtedly, the sampling size is a key factor in conservation studies even that it has not been pointed out as a fundamental sign to make conservation decisions (e.g. Moritz 1994a, 1994b). Considering that many endangered species are represented by small population sizes, it is very important to consider a high allelic richness found in a given geographical area, allelic richness not shared with other geographical areas, or low allelic diversity exclusive of a certain geographical area.
The definition of universal biological criteria to determine conservation priorities within species is under debate and there is no one entirely satisfactory for all taxa (e.g. Moritz, 1994a, 1994b; King and Burke 1999; Young, 2001; Juutinen et al., 2008). Here, we propose that these 3 groups should be considered as a reference to implement a conservation program of quetzals across Mesoamerica. In addition, each locality within clusters 2 and 3 must be interpreted as areas of conservation priority because they have distinctive mitochondrial haplotypes (Solórzano et al., 2004).
In quetzals, RAPDs showed high differentiation across all loci. This result contrasts with findings in other bird species such as the Yuma clapper rail (Rallus longirostris), where 1338 bands were amplified but only 1 % of them were polymorphic (Nusser et al., 1996). This high variation still present in quetzal populations suggests that in the recent past quetzals had large population sizes that have declined or were fragmented recently due to a high rate of habitat loss, as was inferred in other bird species (Haig et al., 1996, 2001).
RAPD data showed a strong partitioning of genetic diversity into 3 clusters (Figs. 2 and 3), and AMOVA results indicate that more variation is found at the individual level than among populations. Hence, for conservation goals the concept that the source of genetic variation is represented at the individual level should be considered as a criterion for conservation concern.
These 3 genetic clusters (Figs. 2 and 3) most likely originated via recent ecological and genetic processes that were interrupted by recent high forest loss across Mesoamerica, leading to isolation and local extinction of remnant quetzal populations (Solórzano et al., 2003). Therefore, it is necessary that the conservation programs for quetzals include the maintenance of biological connectivity (possibility to maintain gene flow) among the different groups in order to enhance the possibilities for the preservation of high genetic diversity within P. mocinno. In Figure 1 the black polygons enclose the potential forests that could maintain such connectivity.
To preserve the integrity of the species, it is necessary to create a system of natural corridors incorporated into the national systems of protected areas through the evaluation of the current quetzal habitats among remaining quetzal populations. The proposed corridors should be represented by lower montane and temperate forests, located at lower altitudes than the nesting habitats, since these forests are used by quetzals during the migratory season (Solórzano et al., 2000). In Mexico, we should create and maintain natural corridors among the remnant quetzal populations located within different mountain chains including the Northern Mountains (NM) and southern Sierra Madre (ET, and FC) to preserve the basic biological processes. Our results highlight the necessity to create a Mesoamerican program to design a global strategy to create natural corridors that maintain the connectivity among the remnant cloud forests, together with an internal political program to protect the quetzals.
RAPD markers were also useful for the identification of the potential provenance of individuals of unknown origin. In this study, we included 1 male sample of uncertain origin reportedly captured in Guatemala and obtained from Mexican authorities following the arrest of an animal dealer in southern Mexico. As the mtDNA haplotype of this male sample was shared between Mexico and Guatemala it was impossible to determine its exact origin (Solórzano et al., 2004). However, with the RAPD analysis, the potential Guatemalan sample was seen to cluster with the individuals from Mexico and not with individuals from Guatemala, thus verifying the origin of the male bird and exposing the dealer's poaching activities in Mexican territory.
In conclusion, we propose 3 genetic clusters as independent Mesoamerican conservation priorities that supplement the 2 recently determined ESUs corresponding to each of the 2 quetzal subspecies based on mtDNA sequences (Solórzano et al., 2004). We found that within the subspecies P. m. mocinno (northern ESU, defined by Solórzano et al., 2004) there are at least 2 groups, 1 of them found in Mexico, and the other 1 clustered in Guatemala, El Salvador, and Nicaragua. In contrast, mtDNA indicated that the Guatemala and Mexico groups were genetically identical (Solórzano et al., 2004), but here they are separated.
Acknowledgments
The authors wish to thank D. Bonifaz, M. Castillo for drafted Figure 1 (ECOSUR, Mexico). Defensores de la Naturaleza, CECON and CONAP (Guatemala); Cocibolca Foundation and Ministerio del Ambiente y Recursos Naturales (Nicaragua); Parque Nacional Montecristo, Universidad Nacional de El Salvador and Secretaría de Agricultura, Ganadería y Desarrollo Rural (El Salvador), kindly helped to obtain sampling permissions. The CITES authorizations 13788, 13569, 08–2001 and 05312 were given for this study. Comments by R. A. McCauley and 2 anonymous reviewers improved the quality of this manuscript. SS was granted by WWF– PCBM (PT37), Idea Wild, AMNH, Doctorado en Ciencias Biomédicas, UNAM, and CONACyT (93860).
Literature Cited
Aagaard, J. E., K. V. Krutovskii and S. H. Strauss. 1998. RAPD markers of mitochondrial origin exhibit lower population diversity and higher differentiation than RAPDs of nuclear origin in Douglas fir. Molecular Ecology 7:801–812. [ Links ]
Clark, A. G. and C. M. S. Lanigan. 1993. Prospects for estimating nucleotide divergence with RAPDs. Molecular Biology and Evolution 10:1096–1111. [ Links ]
Eken, G., L. Bennun, T. M. Brooks, W. Darwall, L. D. C. Fishpool, M. Foster, D. Knox, P. Langhammer; P. Matiku, E. Radford, P. Salaman, W. Echrest, M. L. Smith, S. Spector and A. Tordoff. 2004. Key biodiversity areas as site conservation targets. Bioscience 54:1110–1118. [ Links ]
Excoffier, L. 2006. Arlequin: Computational and Molecular Population Genetics Lab CMPG. Version 3.01. Zoological Institute, University of Berne, Switzerland. [ Links ]
Facey, P. D., P. L. M. Lee, M. N. E. Smith and C. R. Hipkin. 2007. Conservation of genetic diversity in British populations of the diploid endemic Coincya monensis ssp monensis (Isle of Man Cabbage): the risk of hybridization with the tetraploid alien, Coincya monensis ssp cheiranthos. Conservation Genetics 8:1029–1042. [ Links ]
Ferreyra, L. I., C. Bessega, J. C. Vilardi and B. O. Saidman. 2007. Consistency of population genetic parameters estimated from isozyme and RAPD dataset in species of genus Prosopis (Leguminosae, Mimosoidae) .Genetica 131:217–230. [ Links ]
Frankham, R., J. D. Ballou and D. A. Briscoe. 2002. Introduction to conservation genetics. Cambridge University Press, Cambridge. 617 p. [ Links ]
Haig, S. M., M. Bowman and T. D. Mullins. 1996. Population structure of red–cockaded woodpeckers in south Florida: RAPD's revisited. Molecular Ecology 5:725–734. [ Links ]
Haig, S. M., R. S. Wagner, E. D. Forsman and T. D. Mullins. 2001. Geographic variation and genetic structure in spotted owls. Conservation Genetics 2:25–40. [ Links ]
Hillis, D. M., C. Moritz and B. K. Mable. 1996. Molecular systematics. 2nd ed. Sinauer Associates Inc. Sunderland, Massachusetts. 655 p. [ Links ]
Huei–Mei, C, L. Chien–An, C. George Kuo, C. Ching–Mei, S. Horn–Chi, H. Chung–Chu, L. Yu–Chung and K. Hsin–Mei. 2007. Development of a molecular marker for a bruchid (Callosobruchus chinensis L.) resitance gen in mungbean. Euphytica 157:113–122. [ Links ]
IUCN (International Union for Conservation of Nature and Natural Resources). 2008. 2008 IUCN Red List of Threatened Species. www.iucnredlist.org (August 24th, 2008). [ Links ]
Juutinen, A., S. Luque, M. Mönkkönen, N. Vainikainen and E. Tomppo. 2008. Cost–effective forest conservation and criteria for potential conservation targets: a Finnish case study. Environmental Science and Policy 11:613–626. [ Links ]
Keigwin L. D. 1982. Isotopic paleoceanography of the Caribbean and east Pacific: role of Panama uplift on late neogene time. Science 217:350–353. [ Links ]
King, T. L. and T. Burke. 1999. Special issue on gene conservation: identification and management of genetic diversity. Molecular Ecology 8: S1–S3. [ Links ]
McCune, B. and M. J. Mefford. 1999. PC–Ord multivariate analysis of ecologic data. V. 4. MjM Software design, Gleneden, Oregon. [ Links ]
Milne, R. I. and R. J. Abbott. 2008. Reproductive isolation among two infertile Rhododendron species: low frequency of post–F1 hybrid genotypes in alpine hybrid zones. Molecular Ecology 17:1108–1121. [ Links ]
Moritz, C. 1994a. Applications of mitochondrial DNA analysis in conservation: a critical review. Molecular Ecology 3:401–411. [ Links ]
Moritz, C. 1994b. Defining evolutionary significant units for conservation. Trends in Ecology and Evolution 9:373–375. [ Links ]
Nei, M. 1973. Analysis of gene diversity in subdivided populations. Proceedings of the National Academy of Sciences, USA 70:3321–3323. [ Links ]
Nei, M. 1978. Estimation of average heterozygosity and genetic distance from a small number of individuals. Genetics 89:583–590. [ Links ]
Nusser, J.A., R. M. Goto, D. B. Ledig , R. C. Fleischer and M. M. Miller. 1996. RAPD analysis reveals low genetic variability in the endangered light–footed clapper rail. Molecular Ecology 5:463–472. [ Links ]
Parker, P. G., A. A. Snow, M. D. Schug, G. C. Booton and P. A. Fuerst. 1998. What molecules can tell us about populations: choosing and using a molecular marker. Ecology 79:61–382. [ Links ]
Poulin, J. F., M. A. Villard, M. Edman, P. J. Goulet and A. M. Erikson. 2008. Thresholds in nesting habitat requirements of an old forests specialist, the Brown Creeper (Certhia americana), as conservation targets. Biological Conservation 141:1129–1137. [ Links ]
Qui–Hong, W. W. Hua, F. Tsutomu and F. Sheng–Guo.2004. Which genetic marker for which conservation genetics issue? Electrophoresis 25:2165–2176. [ Links ]
Rhymer, J. M., D. G. McAuley and H. L. Ziel. 2005. Phylogeography of the American woodcock (Scolopax minor): are management units based on band recovery data reflected in genetically based management units? Auk 122:1149–1160. [ Links ]
Ryder, O. A. 1986. Species conservation and systematics: the dilemma of subspecies. Trends in Ecology and Evolution 1:9–10. [ Links ]
Sambrook, J., E. F. Fritsch and T. Maniatis. 1989. Molecular cloning. A laboratory manual. 2nd edition. Cold Spring Harbor Laboratory Press, Cold Spring Harbor, New York. 2100 p. [ Links ]
Schlüter, P. M., M. A. Soto–Arenas and S. A. Harris. 2007. Genetic variation in Vanilla planifolia (Orchidaceae). Economic Botany 61:328–336. [ Links ]
Semagn, K., A. Bjornstad, B. Stedje and E. Bekele. 2000. Comparison of multivariate methods for the analysis of genetic resources and adaptation in Phytolacca dodecandra using RAPD. Theoretical and Applied Genetics 101:1145–1154. [ Links ]
Semerikov, V. L., G. G. Vendramin, F. Sebastiani and M. Lascoux. 2005. RAPD–derived, PCR–based mitochondrial markers for Larix species and their usefulness in phylogeny. Conservation Genetics 7:621–625. [ Links ]
Solórzano, S., A. J. Baker and K. Oyama. 2004. Conservation priorities for resplendent quetzals based on analysis of mitochondrial DNA control region sequences. Condor 106:449–456. [ Links ]
Solórzano, S., M. A. Castillo–Santiago, D. A. Navarrete–Gutiérrez and K. Oyama. 2003. Impacts of the loss of Neotropical highland forests on the species distribution: a case study using resplendent quetzal an endangered bird species. Biological Conservation 114:341–349. [ Links ]
Solórzano, S., S. Castillo, T. Valverde and L. Avila. 2000. Quetzal abundance in relation to fruit availability in a cloud forest in Southeastern Mexico. Biotropica 32:523–532. [ Links ]
Susini, M. L., T. Thibaut, A. Meinesz and D. Forcioli. 2007. A preliminary study of genetic diversity in Cystoseira amentaceae (C. Agardh) Bory var. stricta montagne (Fucales, Phaeophyaceae) using random amplified polymorphic DNA. Phycologia 46:605–611. [ Links ]
Wei, Z., W. Liuvang, M. Liua and L. Jianguan. 2008. Genetic variation in the endangered Anisodus tanguticus (Solanaceae) an alpine perennial endemic to the Qinghai–Tibetan Plateau. Genetica 132:123–129. [ Links ]
Williams, C. E. and D. A. Clair. 1993. Phenetic relationships and levels of variability detected by restriction fragment length polymorphism and random amplified polymorphic DNA analysis of cultivated and wild accessions of Lycopersicon esculentum. Genome 36:619–630. [ Links ]
Williams, J. G. K., A. R. Kubelik, K. J. Livak, J. A. Rafalski and S. V. Tingey. 1990. DNA polymorphism amplified by arbitrary primers are useful as genetic markers. Nucleic Acid Research 8:6531–6535. [ Links ]
Wolfe, A. D. and A. Liston. 1998. Contributions of PCR–based methods to plants and evolutionary biology. In Molecular Systematics of Plants II: DNA sequencing, D. E. Soltis, P. S. Soltis and J. J. Doyle (eds.). Kluwer, New York. p. 43–86. [ Links ]
Wood, A. R. and J. P. A. Gardner. 2007. Small spatial scale population genetic structure in two limpet species endemic to the Kermadec Islands, New Zealand. Marine Ecology Progress Series 349:159–170. [ Links ]
Yeh, F. C. and R. C. Yang. 2000. POPGENE (Population Genetic Analysis). University of Alberta. V. 1.32. Molecular Biology and Biotechnology Centre and Center for International Forestry Research. Alberta, Canada. [ Links ]
Young, K. A. 2001. Defining units for conservation for intraspecific biodiversity: reply to Dimmick et al. Conservation Biology 15:784–787. [ Links ]

