


 nova página do texto(beta)
 Inglês (pdf)
 Artigo em XML
 Referências do artigo
 Enviar este artigo por email
 Citado por SciELO
  Similares em
SciELO
Similares em
SciELO 
 Permalink
Introduction
The use of herbicides is frequently related to an improvement in the productivity of crops, which is necessary because the current worldwide population is around 8 billion people requiring quality food [1-4]. However, herbicides have been found in the water, air, soil, and urban systems at levels exceeding the permissible limits [4-7], which generates a high potential of harmful effects on the health of humans and the environment [8].
A review of the literature reveals an increasing interest in the study and development of electrochemical alternatives for the mineralization and biocompatibilization of agrochemicals like bentazon (Bn) [9], 2-4D [10], glyphosate [11], fipronil [12], chlorpyrifos [13], and atrazine [14]. The degree of attainable mineralization/removal in a process depends on characteristics like the configuration of the electrochemical system, the support electrolyte, and the energy consumption [10,11,15]. Operational costs are linked to prices established for the available electricity sources (hydroelectrical, thermal, wind, solar, nuclear) and the subsidies implemented in each country [11].
Bentazon (3-isopropyl-1H-2,1,3-benzothiadiazin-4(3H)-one-2,2-dioxide) is a post-emergence herbicide used to control broad-leaf weeds in alfalfa, corn, rice, sorghum, and soy crops, as well as in horticulture [16, 17]. Bentazon (Bn) is classified within the group of thiadiazine [18] (Fig. 1). Some Bn physicochemical properties are shown in Table 1. According to the US environmental protection agency (EPA) and the World Health Organization (WHO), the permissible limit of Bn in drinking water is 300 µg L-1 [19]; therefore, it is crucial to count upon efficient and sustainable treatments.
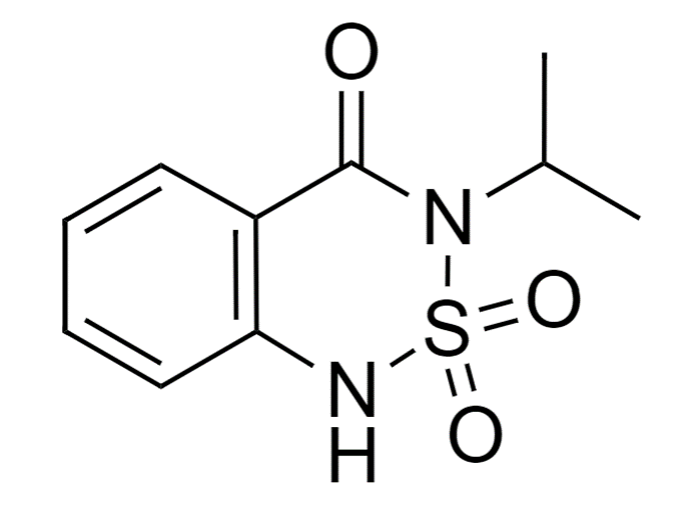
Table 1 Features and physicochemical properties of Bn [50].
| Common name | Bentazon |
| Chemical name (IUPAC) | 3-isopropyl-1H-2, 1,3-benzo-thiadiazine-4(3H)-one-2,2-dioxide |
| Chemical Abstract Services Registry number: | 25057-89-0 |
| Solubility in water | 570 mg L-1 |
| Mean KD value | 0.6 cm3 g-1 (from 0.18 to 3.06 cm3 g-1) |
| Mean KOC value: | 42 cm3 g-1 (from 13.3 to 175.6 cm3 g-1) |
| Mean log Pow value: | -0.456 at pH 7, 22 °C |
| Vapor pressure: | 1.7 x 10⁻⁶ HPa at 20 °C |
| pKa: | 3.3 at 24 °C |
Bentazon-contaminated waters have been treated satisfactorily with advanced oxidation (AOP), biological, and adsorption processes. The use of heterogeneous photocatalytic processes (TiO2) has been efficacious to eliminate Bn (100 %) in relatively short times (2 h) [20]. Likewise, the use of Cu nanoparticles impregnated on chitosan have provided satisfactory results (100 %) but long times are required (3-8 days) dependent on the working pH [21]. Recently, the use of nanostructures (e.g., nanowires of γ-MnOOH in rGo nanosheets) has evidenced the possibility of treating this pollutant with close to 96 % efficiency [22].
Among the biological processes, Trametes versicolor fungi have been used, obtaining an average Bn removal of 49 % after 30 operating days [23]. Otherwise, using microalgae in a pilot-scale tubular photobioreactor yielded results indicating that Bn is a recalcitrant compound and practically no removal of the pollutant was obtained [24]. On the other hand, Bn has been treated with adsorption processes using functionalized silicon materials, yielding results between 50 and 70 % of efficiency [25].
Anodic oxidation processes (AOPs) where organic compounds can be oxidized directly or indirectly are part of electrochemical advanced oxidation processes (EAOPs) [26]. Table 2 presents different EAOPs that have been used for Bn contaminated-water treatments. As can be seen, the current densities are between 5-100 mA cm-2 with a Bn concentration range from 30 to 300 mg L-1. The results indicated that % TOC removed was from 44 to 77 %.
Table 2 Electrochemical oxidation of Bn and operating conditions.
| Process | Wastewater characteristics | Electrodes | Cell type and operating conditions | Results | References |
|---|---|---|---|---|---|
| Electro-Fenton | Bn: 0.125 mM (30 mg L-1) Na2SO4: 50 mM pH: 3 | Anode: BDD (13.95 cm2) Cathode: carbon felt (60 cm2) | Cylindrical cell of 500 mL (two electrodes) Stirring by magnetic bar j: 21.5 mA cm-2 T: 23 ± 2°C | Bn removed: 100% (t: 90 min) | [51] |
| Anodic oxidation | Bn: 0.125 mM (30 mg L-1) Na2SO4: 50 mM pH: 3 | Anode: BDD (13.95 cm2). Cathode: carbon felt (60 cm2) | Cylindrical cell of 500 mL with two electrodes, stirring by a magnetic bar janodic : 21.5 mA cm-2 T: 23±2°C. | Bn removed: 100% (t:150 min) | [51] |
| Anodic oxidation (AO) | Bn: 50 -100 mg L-1 Na2SO4 :100 mM, pH: 4.3-4.6 | Anodes: BDD and nanocrystalline diamond (NCD). Area: 4.15 cm2 | Electrochemical cell of 400 mL with 3 electrodes janodic: 25 and 50 mA cm-2 t: 300 min Room temperature | TOC removed: 60.14 % (NCD anode, j: 50 mA cm-2) | [52] |
| Electro-Fenton | Bn: 0.208 mM (50 mg L-1) Na2SO4: 0.050 M pH: 3.0 | Anode: RuO2-based DSA® (3 cm2) | Undivided tank reactor (V: 130 mL) T: 30 °C j: 16.6, 33.3 and 100 mA cm-2 t: 360 min | TOC removed: 44 % (j: 100 mA cm-2, 360 min) | [53] |
| Anodic oxidation (AO) | Bn: 30 mg L-1 Na2SO4: 0.1 M, NaCl: 1, 5 and 10 mM pH: 6.8 | Anode: Ti/TiO2-RNTs/ Sb-SnO2/PbO2-ND, (9 cm2) RNTs: reduced Ti nanotubes, ND: nano-diamond Cathode: graphite plate, (9 cm2) | Cylindrical cell of 100 mL with two electrodes j: 30 mA cm-2 T: 25°C t: 120 and 360 min | COD removal (t:120 min): 48% (without Cl-, 59% (1 mM NaCl), 69% (10 mM NaCl) TOC removal (t: 360 min): 74 % (without Cl-) EC (t: 120 min): 0.63 kWh gCOD-1 (without Cl-) and 0.31 kWh gCOD-1 (10 mM NaCl) | [9] |
| Photoelectro- Fenton | Bn: 20 mg L-1 Na2SO4: 0.050M pH: 3 | Anode: BDD (20 cm2) Cathode: CoSP/MWCNTs air- diffusion | Pre-pilot filter-press cell with two parallel electrodes (V: 2.5 L, flow rate: 180 L min−1 T: 35°C j: 25 mA cm-2 t: 360 min. | TOC removed: 62.2% (90 min) and 77.0% (240 min) | [54] |
| Electrochemical oxidation (EO) | Bn: 300 mg L-1. Supporting electrolyte: Na2SO4: 5 and 10 mM pH: 6.3 | Anode: BDD (18.5 cm2) Cathode: BDD (18.5 cm2) | Electrochemical cell with two electrodes (V: 600 mL) Room temperature j: 5, 10, 15, and 20 mA cm-2 t: 80 min | COD removed: 91.18 % (t: 80 min, j: 20 mA cm-2) EC: 68.54 kWh m-3 (j: 20 mA cm-2) | [55] |
The BDD electrodes have been used to degrade different persistent organic pollutants, including herbicides like methyl parathion [27], diquat [28], and glyphosate [11], obtaining removals of 70-90 % of the herbicide, 80-95 % total organic carbon (TOC), and 75-95 % of the chemical oxygen demand (COD). BDD characteristics include a good resistance to corrosion and a wide potential window in aqueous and non-aqueous solutions, which allows working at potentials higher than the thermodynamic potential for oxygen evolution. (The overpotential (η) for the release of oxygen is ∼1.3 V) [29]. The degradation process of pollutants on the BDD surface is presented in equations 1-3. Initially, water oxidation generates hydroxyl radicals (•OH) adsorbed on the BDD (Eq. 1); then, the •OH can react to degrade the organic matter (Eq. 2) or to generate diatomic oxygen (Eq. 3) [30]. The efficiency of this electrochemical incineration is determined by reactions 2 and 3.
Herbicide degradation with AOP shows that by increasing the current density from 10 to 50 mA cm-2, the COD degradation increases; however, the efficiency of ICE decreases because at high current densities there is greater competition between reactions 2 and 3 [31].
In this work, we evaluated the performance of an electrochemical process using boron-doped diamond electrodes for the mineralization of bentazon. The studies considered key aspects for the analysis of operational and environmental costs of the process, like flow velocity, concentration of the pollutant, current density, electricity renewability, and electricity cost. Lastly, the study presents detailed information related to the figures of merit applicable to this type of processes aimed at pointing out their potential for the remediation of recalcitrant pollutants.
Experimental
Reagents
Analytical grade bentazon (PESTANAL®, 99 % pure, Sigma Aldrich®) was used. A buffer solution of 0.04 M Na2SO4 (99 % purity, Sigma Aldrich®) and 0.05 M NaHSO4 (95% purity, Sigma Aldrich®) was the supporting electrolyte with a pH value of 2 ± 0.1 [27, 28]. To prepare solutions, deionized H2O was used (Milli-Q®, ρ ≥ 18.2 MΩ cm).
Experimental setup
The electrochemical assays were performed in a modified Diachem®-type non-divided cell, modified with a parallel array of the BDD electrodes (cathode- anode-cathode) aimed at having homogeneity in the current lines and achieving a better Bn oxidation efficiency (Fig. 2) . The geometrical area of the anode was of 100 cm2 and the total cathode area was of 100 cm2 (50 cm2 side-1). BDD electrodes had the following characteristics: thickness of the diamond conducting layer (1-10 μm), resistivity (0.1 Ω cm), boron concentration (500 to 8000 ppm). The current was supplied to the system through an AMEL Model 2051 potentiostat-galvanostat (AMEL electrochemistry, Milan, Italy). The electro-oxidation process was performed in a closed flow system, with a peristaltic pump for electrolyte recirculation (Master Flex L/S, M- 77200-62, USA). Cell potentials, in both closed and open circuits, were measured with a Fluke model 113 digital multimeter (USA).

Experimental methods
Bn concentration was determined through UV-visible spectrophotometry (UV-visible spectrophotometer, Varian Cary: model 50-C, wavelength range = 190-1100 nm, bandwidth = 1 nm, scan rate = 4800 nm min-1). COD determination was performed according to the standard method 5220D (APHA, 2017). Total organic carbon content (TOC) was measured with a Shimadzu VCPH TOC analyzer (Japan), with a non-dispersive infrared sensor using the 53100 catalytic combustion method (APHA, 2017). pH was measured with a Conductronic® model pH120 potentiometer (Mexico). To determine the diffusion coefficients (D) of Bn in the buffer solution, chronoamperometry was used for measuring the current at different potentials (100-1300 mV vs. Ag/AgCl) using a BASi Epsilon® model E2 potentiostat-galvanostat (USA).
Methodology
Solutions with Bn concentrations of 10, 50, and 100 mg L-1 in a buffer solution of 0.04 M Na2SO4 and 0.05 M NaHSO4 at pH 2 ± 0.1 were prepared. To determine the initial Bn concentration the solutions were recirculated in the closed flow system (without applied current) during 5 min to obtain a well-mixed solution. Once the initial sample was taken, electrolysis was performed at current densities of 0.5, 1.0, and 1.5 mA cm-2. During the treatment process, samples were taken at 30, 90, 150, 210, 270, and 330 min to calculate Bn, TOC, and COD removals. Electrolysis lasted 5.5 h (330 min) with volumetric flows of 280, 500, and 750 mL min-1. All experiments were performed in triplicate at ambient temperature (avg. 24 °C). In this study relatively high Bn concentrations were selected. This is of practical interest since it aims to treat waters generated during the cleaning or reuse processes of the containers and of elements that have been in contact with the herbicide [32,33]. From an environmental point of view, high current densities may improve process efficiencies (Table 2), but they also increase the carbon footprint; for this reason, lower current densities than those reported in Table 2 were used. Regarding the volumetric flows, they were selected based on other works where high herbicide removal efficiencies were obtained [27,28].
Parameters and figures of merit in the electrolysis process
The parameters assessed to analyze the efficiency of the process were the normalized values of the Bn, TOC, and COD concentrations as a function of time, as well as the ICE vs. specific charge (Q), and the consumption of energy per gram of TOC removed (ECTOC). Additionally, we measured the diffusion coefficient (D) of Bn in the aqueous solution to determine whether this parameter was within the order of magnitude of the already reported pollutants because the reaction between the hydroxyl radicals generated on the BDD surface and the pollutant is mass transfer dependent [29, 30]. The equations that calculate the different parameters and figures of merit of the electrochemical process are the following:
Normalized Bn concentration ([Bn]) was calculated according to Eq. 4
where [B]o and [B]t are the initial concentration (mg L-1) and that at different electrolysis times, respectively.
The normalized TOC value (%TOC) was calculated according to Eq. 5.
where [TOC]t and [TOC]0 are the values of TOC (mg L-1) at different electrolysis times and at t = 0, respectively.
The COD normalized percentage (%COD) was calculated with Eq. 6.
where [COD]0 and [COD]t are the initial COD values (mg O2 L-1) and at different times of the electrolysis, respectively.
The efficiency of ICE was calculated with Eq. 7 [30].
where [COD]t and [COD]t+Δt represent the COD values (mg O2 L-1) at time t and t = t+Δt (s) respectively, F is the Faraday constant (96,487 C mol-1), 𝑖 is the applied current (A), and 𝑉 is the volume of the electrolyte (L).
The specific energy consumption, (ECTOC), is a figure of merit used to measure the performance of the process; this parameter determines the amount of energy (kWh) consumed by each gram of TOC removed (Eq. 8)
where EC is the potential of the cell (V), i is the applied current (A), t is the electrolysis time (h), Vs is the volume of the solution (L), and ΔTOC represents the amount of TOC removed during Bn electrolysis.
To determine the diffusion coefficient (D) of Bn in the aqueous solution the chronoamperometry technique and the Cottrell (Eq. 9) equation were used.
where D is the diffusion coefficient (cm2 s-1), id is the diffusion current (A), t 1/2 corresponds to the sampled chronoamperometry time (s), n is the number of exchanged electrons in the Bn oxidation reaction (n = 1 mol e-mol-1) [35], F is the Faraday constant (96,487 C mol-1), A is the active area of the electrode (cm2), and C ∞ is the concentration of the species in the bulk of the solution (mol cm-3).
Results and discussion
The sweeps of the samples at different concentrations of Bn are shown in Fig. 3. The results indicate that the best peak absorbance was at a wavelength of 304 nm, with which the calibration curve was constructed (insert of Fig. 3). There is another absorbance wavelength peak (at 210 nm), although when determining the concentration of Bn as a function of time, this wavelength was not clearly defined.

Fig. 3 Absorbance of the bentazon PESTANAL® at different concentrations in a buffer solution (0.04 M Na2SO4/ 0.05 M NaHSO24) at pH 2 ± 0.1. Insert: calibration curve (λ = 304 nm) with fixed equation y = 0.00806x - 0.00357 and R2= 0.99977.
Determination of the diffusion coefficient
The oxidation potential of Bn was determined through cyclic voltammetry, a three-electrode cell (working electrode, BDD; counter electrode, graphite bar; and reference electrode, Ag/AgCl). The Bn concentration peak was at 1.18 V vs. Ag/AgCl (Fig. 4). Once it was confirmed that Bn oxidized on the BDD surface, the chronoamperometries were performed in a potential range from 100 to 1300 mV vs. Ag/AgCl and Cottrell plot was obtained (insert of Fig. 4). The diffusion ∞coefficient was calculated with the Cottrell equation (Eq. 9), where: = 9.62 × 10⁻² cm2, = 2.36 × 10⁻⁵ A, and = 5.6 × 10⁻⁷ mol cm-3, obtaining D = 5.82 × 10⁻⁵ cm2 s-1. The value of the diffusion coefficient is on the order of magnitude reported for different organic compounds, including herbicides in aqueous medium [36, 28]. Calculating the values of the diffusion coefficient (a transport property) is relevant because Eq. 2 (mineralization of organic matter on BDD electrodes) depends on mass transfer.

Analysis of parameters and figures of merit in Bn electrolysis Effect of the initial Bn concentration
This part of the experiments was aimed at determining the effect of the initial Bn concentration (10, 50, and 100 mg L-1) on the efficiency of the treatment process. It must be noted that j (1.0 mA cm-2), v = 500 mL min-1, treatment time (330 min), and the pH 2 ±0.1 remained constant. The selection of the volumetric flow (500 mL min-1) was due to the fact that, as indicated in in volumetric section, when the flow increased from 500 to 750 mL min-1, the Bn degradation and the %TOC removal were not significant; in addition, increasing the volumetric flow causes higher energy consumption in the Bn oxidation process. As seen in Fig. 5(a), a high percentage of the Bn (74 to 86 %) present in the reaction medium was removed. However, TOC removal (i.e., mineralization) was only 43-64 % (Fig. 5(b)) because during Bn degradation, mono-hydroxylated intermediaries are formed that are hard to degrade through oxidative processes [23]. These results are encouraging since in other works with similar Bn concentrations, but higher current densities (25-100 mA cm-2), the mineralization range was 44-77 % [Table 2].

Fig. 5 (a) Normalized Bn concentration and (b) and normalized TOC as a function of time (min). j = 1.0 mA cm-2 and v = 500 mL min-1 in the used electrolyte, 0.04 M Na2SO4/0.05 M NaHSO4 , at ambient temperature.
Regarding ICE vs. Q (Fig. 6), at the beginning of the experiment (∼ 30 min) when the initial Bn concentration was 100 mg L-1, the efficiency was higher than 100 %. The latter is because other oxidizing agents are generated in the Bn degradation process aside from the hydroxyl radicals [37]. For the different initial Bn concentrations, starting with Q ∼ 0.2 AhL-1 values (t ∼ 90 min), the process is controlled by mass transfer because ICE undergoes an exponential decrease [29, 30], reaching low values at the end of the process (for example, ICE = 3.1 with an initial Bn concentration of 10 mg L-1), which coincides with the removal profile of COD (insert of Fig. 6). This behavior occurs because the interfacial Bn concentration gradient (i.e., the driving force for mass transport) is lower at low concentrations [38,39]. Similar ICE profiles have been found for the oxidation of other organic compounds on BDD anodes like 2-naphtol [39], 4-chlorophenol [40], phenol [41], methyl parathion [27], diquat [28], and commercial glyphosate [11].

Effect of current density
To determine the effect of current density (j = 0.5, 1.0, and 1.5 mA cm-2) on the efficiency of the treatment, the initial Bn concentration (50 mg L-1) and the volumetric flow (500 mL min-1) were kept constant. The electrolysis time was of 330 min at a pH 2 ± 0.1. As observed in Fig. 7(a) and Table 3, for j = 1.0 and 1.5 mA cm-2, ~83% of Bn was degraded, whereas at j = 0.5 mA cm-2, Bn removal reached around 73 %. Hence, by increasing the current density in 100 % (from 0.5 to 1.0 mA cm-2), Bn removal increased only ~10 % and, at current densities of 1.0 and 1.5 mA cm-2, Bn concentration remained almost constant. Hence, the degradation of this pollutant reached its highest value at j = 1.0 mA cm-2.

Fig.7. (a) Normalized Bn and (b) and normalized TOC as a function of time (min). Initial Bn concentration = 50 mg L-1 and v = 500 mL min-1 in the used electrolyte, 0.04 M Na2SO4/0.05 M NaHSO4 , at ambient temperature.
Table 3 Effect of the initial Bn concentration [Bn]0, current density (mA cm-2), and electrolyte volumetric flow (mL min-1,0.04 M Na2SO4/0.05 M NaHSO4 ) upon the normalized Bn, TOC, COD, and ECTOC parameters at ambient temperature.
| [Bn]0 | j | v | Bn | TOC | COD | ECTOC |
|---|---|---|---|---|---|---|
| mg mL-1 | mA cm-2 | mL min-1 | % | % | % | kWh gTOC-1 |
| 10 | 74 | 43 | 72 | 1.09 | ||
| 50 | 1.0 | 500 | 83 | 60 | 63 | 0.17 |
| 100 | 86 | 64 | 73 | 0.08 | ||
| 0.5 | 73 | 41 | 51 | 0.12 | ||
| 50 | 1.0 | 500 | 83 | 60 | 63 | 0.17 |
| 1.5 | 83 | 61 | 65 | 0.26 | ||
| 280 | 77 | 58 | 74 | 0.09 | ||
| 100 | 1.0 | 500 | 86 | 64 | 73 | 0.08 |
| 750 | 85 | 68 | 82 | 0.07 |
On the other hand, as observed in Table 3 and Fig. 7(b), maximal TOC removal (∼ 60 %) was reached at j = 1.0 mA cm-2. By increasing the current density to 1.5 mA cm-2, the mineralization percentage practically remained constant, which coincides with the degradation profile of Bn. As indicated, the intermediaries formed during the Bn oxidation process are hard to degrade [23, 42, 43]. The low Bn mineralization using different advanced electro-oxidation processes (44-77 %) has been reported even at high current densities (25-100 mA cm-2, Table 2) compared to the current density (1 mA cm-2) used in this work. Working with low current densities has the advantage that when escalating the treatment process, lower capital costs are obtained because the required rectifiers are of lower current and voltage.
Regarding ICE vs. Q (Fig. 8), when Q ∼ 0.2 AhL-1 (t ∼ 90 min) for the three current densities, the ICE values suggest that electrolysis is controlled by diffusion. Concerning COD (insert of Fig. 8), when j = 1.5 mA cm-2, values did not change any further after 210 min because ICE showed an exponential decrease.

Effect of the volumetric flow
To study the effect of the volumetric flow, v = 280, 500, and 750 mL min-1 were used. The initial Bn concentration (100 mg L-1) and current density (1.0 mA cm-2) were kept constant; these values were chosen because they yielded the best results of process efficiency in the corresponding assays. The treatment time was 330 min at pH 2 ± 0.1. As observed in Fig. 9(a) and Table 3, when increasing the volumetric flow from 280 to 500 mL min-1, the increase in Bn removal was of 9 % (77 and 86 % of Bn removal, respectively). However, when increasing the volumetric flow to 750 mL min-1, the Bn removal did not increase. Regarding the TOC values, a similar behavior to that shown by Bn removal was obtained, because at 500 and 750 mL min-1 the TOC removal was almost constant (64 and 68 %, respectively) (Fig. 9(b)).

Fig. 9 (a) Normalized Bn concentration and (b) and normalized TOC as a function of time (min). Initial Bn concentration = 100 mg L-1 and j = 1.0 mA cm-2 in the used electrolyte, 0.04 M Na2SO4/0.05 M NaHSO4 , at ambient temperature.
The profiles obtained for ICE vs. Q and COD are depicted in Fig. 10. As observed for the three flows, when Q < ∼ 0.2 Ah L-1 the process is charge transfer controlled and, thereafter, when Q > ∼ 0.2 Ah L-1 it changes to a diffusional control [29, 30]. There is an agreement of the COD and ICE profiles, because the COD values are practically the same until 30 min. However, despite the ICE decrease for the three flow velocities, the highest COD removal (82 %) was achieved at 750 mL min-1.

Fig.10. ICE as a function of the specific charge Q (mA L-1). Inset: COD as a function of time (min). Initial Bn concentration = 100 mg L-1 and j = 1.0 mA cm-2 in the used electrolyte, 0.04 M Na2SO4/0.05 M NaHSO4, at ambient temperature.
The analysis of the results of the influence of current density and flow velocity on Bn degradation reveals that the best operational conditions in the cell used in this work were j = 1.0 mA cm-2 and v = 750 mL min-1. The initial Bn concentration cannot be included within the operational conditions because this variable depends on the effluent to be treated.
Environmental and economic analysis of the Bn treatment process
ECTOC is a figure of merit used for measuring process performance. In this study, the treatment of 50 mg L-1 of Bn consumed 0.12 kWh gTOC-1 (j = 0.5 mA cm-2), 0.17 kWh gTOC-1 (j = 1.0 mA cm -2), and 0.26 kWh gTOC-1 ( j = 1.5 mA cm-2). An increase in the current density from 0.5 to 1.0 mA cm-2 exerted a positive impact on Bn, TOC, and COD removal (Table 3). Any additional increase became counterproductive because it did not improve performance but increased the energy consumption. Taking as reference the Mexican energy mix, which is dominated by non-renewable sources, increasing from 1.0 to1.5 mA cm-2 will increase ECTOC in 54 %, the emissions of carbon dioxide (kg CO2 gTOC-1), and the costs of treatment (US$ gTOC-1).
Emissions of pollutants and, particularly, of greenhouse gases depend on the energy consumed by the process and the degree of renewability of the energy matrix of a country or region [10,11,15]. As seen in Fig. 11(a), in countries like Brazil, Colombia, Canada, and Norway, where electricity is generated through renewable sources (60 - 90 %), emissions are below 0.05 kg CO2 Eqv. for each gram of TOC. When non-renewable sources, like coal and oil, predominate in the energy matrix (45-90 %), emissions can exceed 0.17 kg CO2 gTOC-1. In Mexico, USA, UK, and China, the emissions can vary between 0.07 and 0.14 kg CO2 gTOC-1.

Fig. 11 Performance of the Bn treatment process through electrochemistry. (a) Economic and environmental costs; (b) evolution of the economic cost from 2010 to 2021. Notes: Bn concentration = 50 (mg L-1), j = 1 mA cm-2. The costs of the processes were taken from IRENA [49].
The environmental performances observed in countries with a more sustainable energy mix contrast with the low treatment costs calculated for economies that use non-renewable sources (coal, oil, natural gas) to produce electricity (Fig. 11(a)). The low generation costs are due to subsidies established locally and to the low costs of the used raw materials. The pressure exerted by society and international organizations has motivated the use of green energies and the development of coupled electrochemical processes to reduce the impact of the local energy mix. The success reached in the last 10 years evidenced the potential of renewable energy sources and electrochemical technologies to degrade recalcitrant wastewaters [44]. In 2014, Valero et al. developed an electrochemical treatment system (Ti/RuO2, j = 50 mA cm-2, pH = 9, t = 330 min) coupled to a system of solar panels capable of eliminating 80 % of the chemical oxygen demand from an agroindustrial wastewater [45]. Souza et al. (2015) evidenced the feasibility of coupling an electrochemical process (BDD) and a renewable energy source (wind turbine) to mineralize the 2,4 -D1 herbicide [46]. Millan et al. (2019) introduced an electrochemical (BDD)-photovoltaic system for the degradation of the herbicide clopyralid; the proposed system evidenced the technical feasibility to mineralize complex substances and the possible impact of the incident radiation variability in the efficiency of the treatment process (i.e., reaction time, degradation byproducts, mineralization degree velocity) [47]. Likewise, Montiel at al. (2018) pointed out that the use of electrochemical systems coupled to solar panels and wind turbines reduce between 12 % and 17 % the treatment costs, respectively [48]. Finally, taking as reference 2,4-D, the use of renewable energy, like solar or wind-power, entails an 85 % reduction (from 0.14 to 0.02 kgCO2-Eqv.) in the emissions of greenhouse gases for each liter of treated water [10].
Energy sources like coal and oil are quite negative when considering environmental aspects. Nuclear energy exhibits good economic and environmental indicators (0.002 kg CO2 gTOC-1, 0.005 US$ g TOC-1), but the risks associated with the production of raw materials, operation, and dismantling make them less attractive due to the pressure exerted by society in general (Fig. 11(b)). The generation costs for renewable energy sources diminished notably from 2010 to 2021; for example, the cost of production of solar photovoltaic, wind-power (onshore) and wind-power (offshore) energy was reduced ca. 88, 68, and 60 %. It should be noted that only hydraulic energy had a 24 % increment. The latter is advantageous for the development of treatment systems considered previously as inviable due to their high economic costs (Fig. 11(b)).
Conclusions
In this work, mineralization of Bn was achieved through advanced electro-oxidation using a non-divided Diachem® cell modified with BDD electrodes. Bn removal percentages amounted to up to 86 % at low current densities (1 mA cm-2) and 330 min of treatment. With this same current density, removals of TOC and COD of 68 and 82 %, respectively, were obtained. The best conditions (1 mA cm-2 and 750 mL min-1) for the mineralization of Bn in this system indicate that the specific energy consumption was of 0.07 kWh gTOC-1 and, according to the energy mix reported for Mexico (0.068 kWh gTOC-1), this process is a promising option to treat Bn-contaminated waters.

