


 nueva página del texto (beta)
 Inglés (pdf)
 Artículo en XML
 Referencias del artículo
 Enviar artículo por email
 Citado por SciELO
  Similares en
SciELO
Similares en
SciELO 
 Permalink
Introduction
Pseudomonas aeruginosa (P. aeruginosa) is an opportunistic bacterial nosocomial pathogen-multi-drug resistance pathogen that causes severe infections to cystic fibrosis (CF) patients [1], hospitalized, and immunocompromised patients [2]. These P. aeruginosa oftentimes colonize similar destinations, including the urinary lot, burn and surgical wounds, bacteremia, septicemia (blood poisoning), pneumonia, bronchitis, diarrhea, keratitis, skin and wound infections, and the upper respiratory tract [3,4]. P. aeruginosa is the most pervasive bacterial microbe that colonizes the lung, and their co-colonization is related to helpless patient outcomes, i.e., patients with cystic fibrosis [5]. The virulence nature of this pathogen in the cystic fibrosis patient’s lung and severity of cystic fibrosis lung disease is closely linked to iron homeostasis [6]. The Centers for Disease Control and Prevention in 2019, has considered P. aeruginosa as a serious health threat (https://www.cdc.gov/drugresistance/biggest_threats.html). P. aeruginosa is related to an expanded bounty of other bacterial and viral pathogens, for example, Covid-19 (SARS-CoV-2), HIV and AIDs, STIs, diabetes, etc. Lysozymes are the significant cell divider polymer in the microorganisms [7], it provides resistance against turgor and its cleavage by hydrolases [8]. Lysozyme is an old bactericidal protein that is important for the antibacterial protection arrangement of vertebrate and invertebrate creatures [9]. Several studies support a role for these lysozyme inhibitors in bacteria-host interactions [10]. SARS-CoV-2 is the most recent coronavirus to be discovered, and it mostly affects the respiratory tract (nose and lungs), causing colds, bronchitis, and pneumonia [11]. The connection of the viral spike protein and the host angiotensin-converting enzyme 2 (ACE2) causes an underlying passage and ensuing replication in the upper respiratory tract [12]. Due to higher amounts of ACE2 expression [13] and viral RNA (vRNA) at this region [14], the nasal cavity is believed to be the main site of viral replication rather than the oral cavity [15]. Speedy and uncontrolled propagation can bring about contamination of the lower respiratory tract and serious ailments. This virus is very contagious and has a high fatality rate [16]. It takes 2-14 days to incubate SARS-CoV-2 after exposure [17]. Dry cough, fever, shortness of breath, loss of taste or smell, skin rashes, conjunctivitis, exhaustion, muscle soreness, diarrhea, and fatigue are the first symptoms of SARS-CoV-2 infection, which are joined by other biological indicators such as lymphopenia [18]. The World Health Organization (WHO) listed severe acute respiratory syndrome-related (SARS) out of the nine (9) as one of the highly pathogenic viruses likely to cause epidemics. Under 90 days later its underlying rise in Wuhan, China WHO proclaimed serious intense respiratory disorder related to Covid-19 (SARS-CoV-2) a pandemic [19] and at present no drugs are available to address this dangerous pathogen [20]. Older and an individual with prior ailments or comorbidities (cardiovascular sickness, diabetes, lungs infection, gram-positive or negative bacterial, and cancer) are bound to foster serious ailments. The spike glycoprotein creates a homotrimer that allows the virus to enter host cells. The spike glycoprotein is of tremendous relevance in the development of SARS-CoV-2 treatment techniques since it is the key component that the virus employs to bind to receptors on the host cell surface. If humans are infected with SARS-CoV-2, the spike protein could be used as a target for therapeutic and vaccine development [21,22]. P. aeruginosa and SARS-CoV-2 are dangerous diseases considering their negative consequences for human health and their ability to transmit from one person to another [23]. To avoid these infection relapses, new anti- P. aeruginosa and anti-SARS-CoV-2 drugs are needed.
Iminoguanidine is a key chemical class in drug discovery owing to its broad range of therapeutic potential, which include, antibacterial [24-26], antiviral [25,26], ability to recognize and separate anions from competitive aqueous environments [27], and biomass-based direct air capture [28]. This beneficial property of iminoguanidine sparks our interest in creating a tool for identifying novel iminoguanidine analogs that have potential as antibacterial agents.
There is an immediate need for ways to combat the disease's increased prevalence, and counteraction seems a legitimate methodology. This computer-aided drug design (CADD) approach can contribute to many stages of the drug discovery process, notably to performing a search for active compounds by virtual screening [29]. Computational methods, i.e., computer-aided drug design (CADD) has been successfully applied in pharmacy, pharmaceutical chemistry, molecular biology, and biochemical researcher for years to fight the problems related to drug design, drug discovery, and drug development [30]. The current work examines the use of grounded quantitative structure-activity relationship (QSAR) modeling in conjunction with genetic approximation-multiple linear regression (GA-MLR), docking simulations, molecular dynamics simulations (MDs), and ADME as relevant to iminoguanidine derivatives to investigate their role as a negative catalyst against P. aeruginosa and SARS-CoV-2. Accordingly, this research may be practicable for the design and development of persisting multi-drug resistance pathogen activity.
Experimental
Methods
A total number of 25 iminoguanidine derivatives reported by PubChem with the accession number AID_1315713 were collected to perform this study. The MIC50 values (minimum inhibitory concentrations) were converted to pMIC50 (-logMIC50) values that were utilized in the QSAR investigation as dependent variables. The compound's pMIC50 values are within the QSAR prerequisite range according to Shirvania and Fassihi [31]. The 3D structures of all the compounds including the reference compounds were prepared using MarvinView Europium.6 (http://www.chemaxon.com) and their energies were minimized with the Spartan’14 V1.1.4 PM6. The energy minimized molecules were subjected to optimization via DFT (density functional theory) method with B3LYP function [32,33] and 6-31G+ basic set [34] with the GAUSSIAN 09 package [35]. The optimized structures were imported into PaDEL-Descriptors v2.20 [36], which calculated the molecular descriptors for each molecule. The calculated descriptors from the PaDEL software saved in an excel spreadsheet were pre-treated using NEW_V-WSP version 1.2 (DTC) laboratory software to sequester highly correlated descriptors from the distantly related ones, thus reducing redundancy in the calculated values. The pre-treated descriptors saved in the text file were transferred into the QSARINS software for further analysis [37]. The chemical structure of the molecules and their pMIC50 values are available in Table 1. The QSARIN v2.2.4 software was adopted to perform a Genetic algorithm (GA) and model development. GA approach allows the proper selection of some exceptionally good descriptors to improve a model’s quality and predictive accuracy and by doing so, a multiple linear regression (MLR) is curated to obtain the additive relationship between biological endpoints and molecular descriptors [38]. Thus, the technique is referred to as GA-MLR. Before developing the 2D-QSAR model, the data set were divided into 70 % training and 30 % test by applying the random selection implemented in QSARINS software.
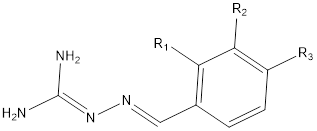
Table 1 Chemical structures of iminoguanidine compounds as well as their activity levels.
| Compound No. |
|
||||
| R1 | R2 | R3 | MIC50 (ug/Ml) | pMIC50 | |
| 1 | H | H | Cl | 10.7 | 1.0294 |
| 2 | H | H | N(CH3)2 | 32.5 | 1.5119 |
| 3 | OH | H | H | 58.5 | 1.7672 |
| 4 | OCH3 | H | H | 38.4 | 1.5843 |
| 5 | H | H | NO2 | 61.4 | 1.7882 |
| 6 | F | H | H | 28.6 | 1.4564 |
| 7 | H | Naphc | Naphc | 31.7 | 1.5011 |
| 8 | H | Cl | H | 19.2 | 1.2833 |
| 9 | Cl | H | H | 16.3 | 1.2122 |
| 10 | H | H | CH(CH3)2 | 20.6 | 1.3139 |
| 11 | H | H | OCH3 | 30.5 | 1.4843 |
| 12 | Naphc | Naphc | H | 30.4 | 1.4829 |
| 13 | H | H | F | 87.4 | 1.9415 |
| 14 | H | H | Br | 19.7 | 1.2945 |
| 15 | H | OCH2C6H6 | H | 25.5 | 1.4065 |
| 16 | Br | H | H | 62.9 | 1.7987 |
| 17 | OH | Br | H | 145 | 2.1614 |
| 18 | H | H | C6H6 | 34.6 | 1.5391 |
| 19 | H | OH, OHa | H | 338 | 2.5289 |
| 20 | H | H | OH | 443 | 2.6464 |
| 21 | H | OH | H | 391 | 2.5922 |
| 22 | H | OCH3 | H | 48.6 | 1.6866 |
| 23 | H | F | H | 70 | 1.8451 |
| 24 | H | Br | H | 23 | 1.3617 |
| 25 | H | Cl | Cl | 24.1 | 1.3820 |
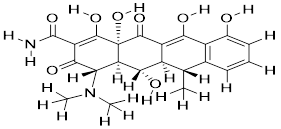
| Reference compounds | |||||
| Doxycycline (Vibramycin) |
|
||||
| Chloroquine |
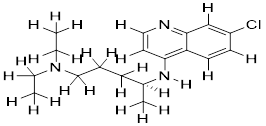
|
||||
| Ruxolitnib |
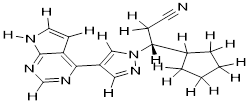
|
||||
| Ampicillin |
|
||||
2D-QSAR Model validation
Internal and external validations of the QSAR model are carried out by using the model to forecast training and test data. To assess the model's validity, we calculate several parameters. To begin, the coefficients of determination (
Where, Y and
Protein generation and preparation
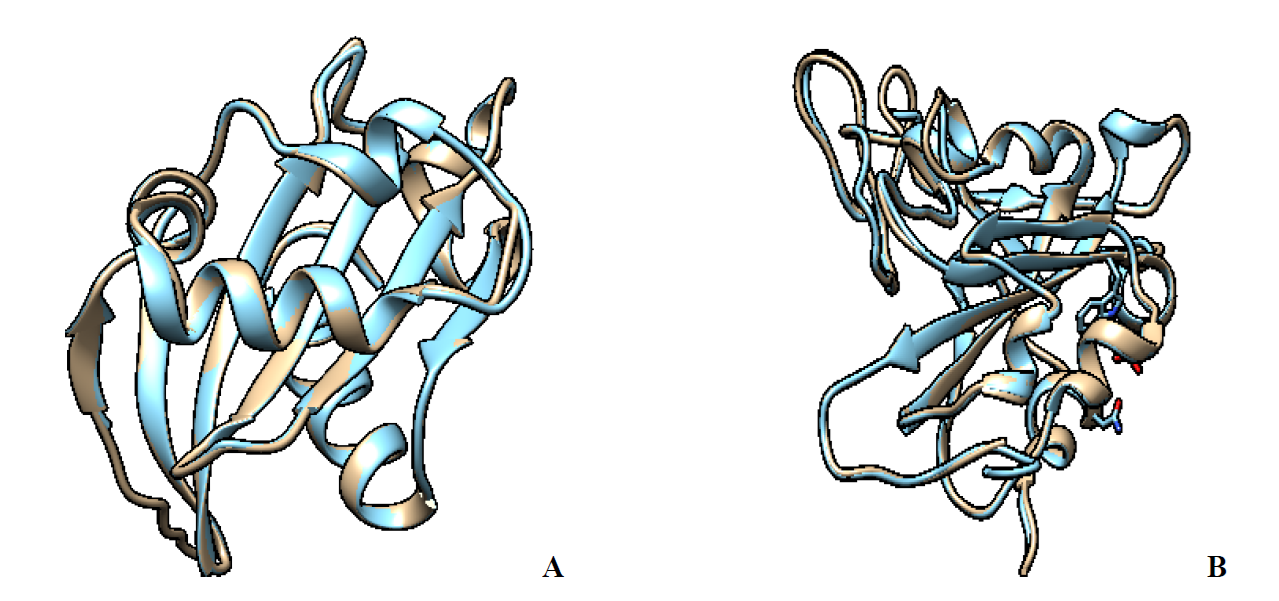
Pseudomonas aeruginosa and the 2019 novel coronavirus protein sequence were downloaded from the NCBI database (https://www.ncbi.nlm.nih.gov/) with accession number KJJ19201 and PDB: 7E23, respectively. A BLAST exploration was carried out to find appropriate templates. The UPGMA algorithm [42] was used to infer the evolutionary history. The evolutionary distances were calculated using the Poisson correction method [43] and are measured in amino acid substitutions per site. Each descending clade's proportion of sites with at least one unambiguous base in at least one sequence is shown next to each internal node in the tree. This study looked at five and six different amino acid sequences of P. aeruginosa and SARS-CoV-2 spike proteins, respectively. For each sequence pair, all unclear locations were deleted (pairwise deletion option). In total, there were 215 and 239 positions in the final dataset, respectively. MEGA X was used to undertake evolutionary analyses [44]. Pair-wise alignment of the template and query sequences were constructed using MODELLER v10.1 to check the results of the phylogenetic tree analysis [45-47]. For query and template sequences, BioEdit [48] was used to build a sequence alignment file in PIR format. Python Scripts were used to construct the Multiple Template Modeling (MTM) protocol from module 5 structures. With the help of Swiss-Pdb Viewer [49], for energy minimization, the model with the most reduced DOPE score (Discrete Optimized Protein Energy) was chosen. For P. aeruginosa and SARS-CoV-2 spike, the template and the predicted modelled structures were superimposed with RMSD values of 0.176 and 0.261, respectively (Fig. 1).
Equipment and programming
Molegro Virtual Docker 6.0 2013 [50] and Autodock Vina with PyRx v0.8 [51] were used for docking simulations with core i3 windows processors. The molecular docking simulations of all compounds were performed with the predicted modelled crystal structure of P. aeruginosa and SARS-CoV-2. Molegro Virtual Docker (MVD) which was considered as one of the best and accurate docking packages were used to study the interactions energies between the stationary modelled proteins and the ligands. The design of the demonstrated proteins was created by pressing icons, and the amino acid flaws that presented as a warning were repaired. The protein surface and binding cavity have both been identified. After resetting the icon, the design of the demonstrated proteins is ready for docking simulation. The docking wizard was used to perform interactions of the protein-ligand and the parameters for the docking interactions were set as ten (10) runs, 50 population size, 1500 iterations, and lastly, the maximum number of poses is 4. Next was the PyRx [51] docking simulations setup. The modelled proteins were prepared using PyRx v0.8 software and the docking experiments were subsequently accomplished using the AutoDock Vina package [52]. The network place for docking of the ligands against the displayed protein of P. aeruginosa was set as exhaustiveness = 8, center_x = 16.8669, center_y = 53.3921, center_z = -4.3156, size_x = 55.3409311867, size_y = 155.016245728, size_z = 141.969700775, and against the modelled SARS-CoV-2 spike protein was set as center (x = -1.5643, y = 12.818, and, z = 12.3015), size (x = 49.2203297997, y = 44.6869613934, and, z = 51.2521103764), respectively. The Discovery studio 2020 client was used to visualize the outcomes of the docking simulation.
Molecular Dynamics Simulations
Utilizing the CHARMM-GUI web server [53], a cubic box of TIP3 water particles with an edge distance of 10 Å was utilized to submerge the docked complex. A 0.15M KCl counterion was utilized to neutralize the system. To deliver the inner strain energies of the whole system, the whole framework or system was exposed to 5,000 run steps of energy minimization utilizing the steepest drop integrator. The NVT equilibration was then performed at 303.15 K for 0.01 ns. 500,000 runs i.e., 1 ns of unrestrained isothermal isobar group (NPT) were performed for the production and were completed at 303.15 K, utilizing 1 atm (1.01325 bar) with 2 fs time steps. All computations were performed using the CHARMM36m force field [54], NAMD [55], and VMD [56] for representation.
Results and discussion
The QSAR study was carried out to explain the multiple linear relationships between the 2D descriptors and the bioactivity. To explain the diversity in the bioactivity of iminoguanidine derivatives, the molecular descriptors (Centered Broto-Moreau autocorrelation - lag 1 / weighted by I-state (ATSC1s) and Sum of E-State descriptors of strength for potential hydrogen bonds of path length 7 (SHBint7) were chosen. The GA-MLR equation for the prediction of the bioactivity is given in equation 6:
The following are the mathematical parameters/ values of the 2D QSAR model:
The developed model represents a linear combination of two descriptors. One of them belongs to autocorrelation descriptor (ATSC1s) and electro-topological state atom type descriptor (SHBint7). The model in (equation 6) indicates that the inhibitory activity of compounds against the strain of P. aeruginosa depends on autocorrelation and topological state properties. Table 2 shows the p-values, variance inflation factor (VIF), and the mean effect (MF) for the variables used in the model proposed.
Table 2 The validation parameters, variance inflation factor, and mean effect.
| Variable | Coeff. | Std. coeff. | Std. err. | (+/-) Co. int. 95% | p-value | VIF | MF |
|---|---|---|---|---|---|---|---|
| Intercept | 0.4444 | 0.1373 | 0.2926 | 0.0052 | |||
| ATSC1s | -0.1470 | -1.0263 | 0.0163 | 0.0347 | 0.0000 | 1.25 | 1.068 |
| SHBint7 | -0.0332 | -0.4710 | 0.0080 | 0.0171 | 0.0008 | 1.25 | -0.068 |
Internal and external validation was used to estimate the significance and to ensure the validity of the models [57]. The model disclosed a cross-validation coefficient (
Table 3 Observed, predicted biological activity, and HAT of the training and predicted set of compounds against P. aeruginosa.
| ID | Name | Status | Observed act. | Pred. by model eq. | HAT i/i (h*=0.5000) |
|---|---|---|---|---|---|
| 1 | 2 | Prediction | 1.5119 | 1.3261 | 0.1013 |
| 2 | 3 | Training | 1.7672 | 1.7977 | 0.5221 |
| 3 | 4 | Training | 1.5843 | 1.2615 | 0.1377 |
| 4 | 5 | Training | 1.7882 | 2.012 | 0.1304 |
| 5 | 6 | Training | 1.4564 | 1.5377 | 0.4325 |
| 6 | 7 | Training | 1.5011 | 1.4094 | 0.0839 |
| 7 | 8 | Training | 1.2833 | 1.4373 | 0.0793 |
| 8 | 9 | Training | 1.2122 | 1.3869 | 0.081 |
| 9 | 10 | Training | 1.3139 | 1.2556 | 0.1206 |
| 10 | 11 | Training | 1.4843 | 1.4962 | 0.0718 |
| 11 | 12 | Training | 1.4829 | 1.3931 | 0.0868 |
| 12 | 13 | Prediction | 1.9415 | 2.1189 | 0.1704 |
| 13 | 14 | Training | 1.2945 | 1.4085 | 0.084 |
| 14 | 15 | Training | 1.4065 | 1.4088 | 0.0839 |
| 15 | 16 | Prediction | 1.7987 | 1.3922 | 0.087 |
| 16 | 17 | Prediction | 2.1614 | 1.7301 | 0.4965 |
| 17 | 18 | Prediction | 1.5391 | 1.3749 | 0.0904 |
| 18 | 19 | Prediction | 2.5289 | 3.5361 | 1.6041 |
| 19 | 20 | Training | 2.6464 | 2.4252 | 0.3379 |
| 20 | 21 | Training | 2.5922 | 2.4252 | 0.3379 |
| 21 | 22 | Training | 1.6866 | 1.4962 | 0.0718 |
| 22 | 23 | Training | 1.8451 | 2.1189 | 0.1704 |
| 23 | 24 | Training | 1.3617 | 1.4085 | 0.084 |
| 24 | 25 | Training | 1.382 | 1.4102 | 0.0837 |
To additionally affirm whether or not there is a multicollinearity issue in the revealed model as remarked by Bolboac and Lorentz [58], the VIF values of these descriptors in the preparation (training) set were registered and gotten to be under 5 demonstrating the wellness of the announced model. The descriptors in the revealed model were measurably huge and the symmetrical idea of the descriptors was affirmed, i.e., the model is great, liberated from multicollinearity issue, and satisfactory since no descriptor has its VIF values more noteworthy than 5 (If a model has a descriptor with VIF esteem more prominent than 5, the model isn't acknowledged, thusly, should be re-evaluated) [59]. The importance and commitment of a descriptor concerning other descriptors in the model were determined by the mean effect (MF) values. The positive sign of Centered Broto-Moreau autocorrelation - lag 1 / weighted by I-state (ATSC1s), indicates that the molecule of the compound should have larger electronic properties (polarizability and charges as weights) in the molecule will increase the biological activity. This descriptor showed the highest significance than the other descriptors according to their p-value. The negative sign of the Sum of E-State descriptors of strength for potential hydrogen bonds of path length 7 (SHBint7) that account for the intrinsic electronic state of the atom as perturbed by the electronic influence of all other atoms in the molecule, shows that, the lesser values of these descriptor attributed to the compounds with greater bioactivity values.
The fitting criteria
Phylogenetic tree and Homology modeling
The sequence of P. aeruginosa and SARS-CoV-2 spike glycoproteins were obtained from the NCBI (National Center for Biotechnology Information) database (http://www.ncbi.nlm.nih.gov/) with accession number KJJ19201.1 and PDB 7E23, respectively, were used to BLASTp search against the protein data bank to select the template structures. The query sequence and the BLAST template structures were first analyzed through the MEGA-X [63] software to investigate the phylogenetic relationship based on the test UPGMA (Unweighted pair-group method with arithmetic) method as shown in Fig. 2. The phylogenetic tree which is obtained by MUSCLE [64] shows the evolutionary relationship between the proteins sequences as it was a rooted tree. Phylogenetic analysis demonstrated clear sequestration of P. aeruginosa and SARS-CoV-2 in two different biological groups and these biological groups were also divided into subgroups. All the biological groups are grouped according to their protein sequence similarity. The P. aeruginosa query sequence (accession number KJJ19201.1) shows high similarity to PDB 4PS6 and 1UUZ, respectively as shown in Fig. 2(A). The phylogenetic sequence analysis of the spike protein of SARS-CoV-2 (PDB: 7E23) and the other five templates shows a close similarity (Fig. 2(B)). Concerning overall sequence similarity PDB 7MZF spike protein S1 has the highest similarity to PDB 7E23. The chain A inhibitors of vertebrate lysozyme (PDB 4PS6 and PDB 1UUZ) and spike protein S1 (PDB 7MZF) have very close relationships to the query sequence, respectively.
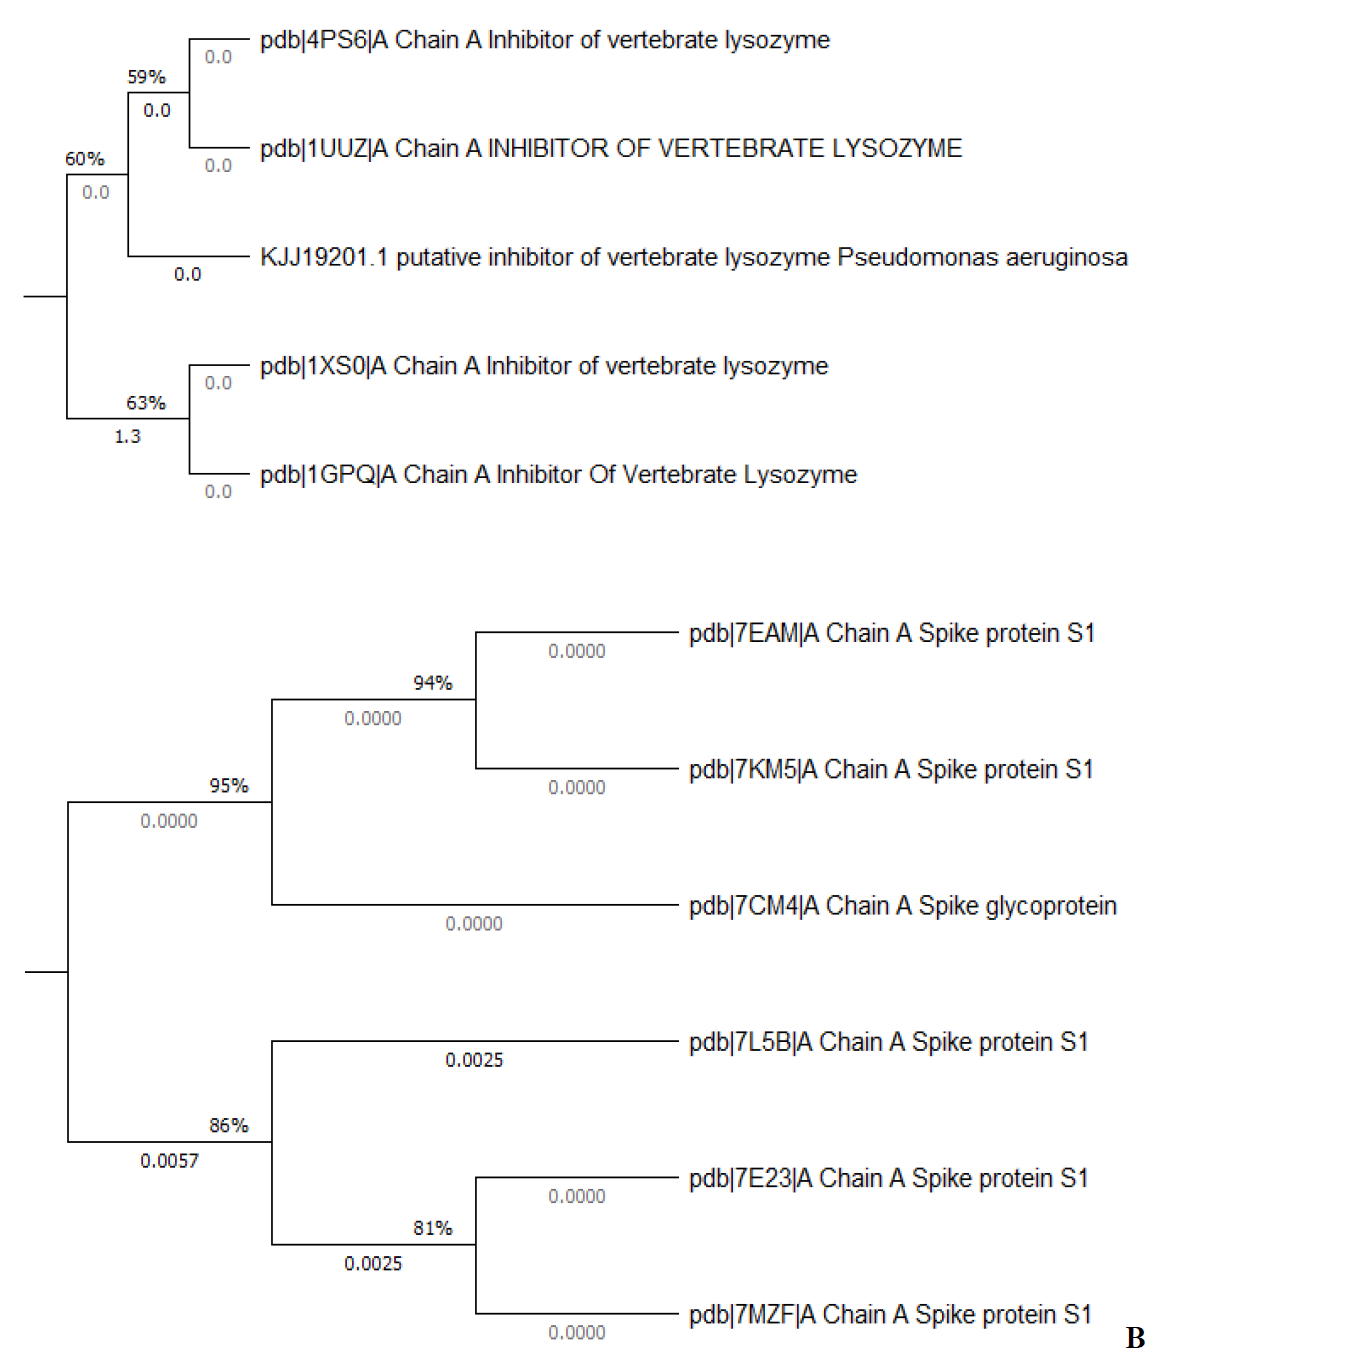
Fig. 2 Phylogenetic analysis of (A) P. aeruginosa and (B) SARS-CoV-2 spike protein homologs were constructed by the UPGMA method using the MEGA X program.
Further analysis using MODELLER 10.1 was performed on the query sequence and the template sequences structures to confirm the phylogenetic tree analysis and a better insight into their protein structure similarity. According to the result malign3D command implemented in MODELLER 10.1, the tree diagram calculates a weight pair group average clustering on a distance matrix (Fig. 3). Out of the template structure, the best homologous structure belonged to an inhibitor of vertebrate lysozyme (PDB: 4PS6) (Fig. 3(A)) and spike protein S1 (PDB: 7mzf) (Fig. 3(B)) because of its similarity and high resolution with the query structure was selected for homology modeling. The results obtained thereof confound to the phylogenetic analysis. The selected PDB was used as a template structure for the construction of the P. aeruginosa and SARS-CoV-2 spike protein, respectively. Pseudomonas aeruginosa, with the accession number of KJJ19201.1, has 199 amino acids in its protein sequence, while SARS-CoV-2 spike protein S1with PDB code 7E23 has 196. The Pseudomonas aeruginosa (PDB 4PS6) and SARS-CoV-2 spike protein S1 (PDB code 7MZF) were selected as the template based on the phylogenetic tree analysis and dendrogram command using the align2d script implemented in MODELLER. An alignment of Pseudomonas aeruginosa (accession number of KJJ19201.1) and SARS-CoV-2 spike protein S1with PDB code 7E23 with the template sequences are presented in Fig. 4. The MODELLER constructed five (5) different structure modelled proteins. The receptor generated by MODELLER was ranked and scored using discrete optimized protein energy (DOPE) score (Data presented in Table 3 and 4). The top one out of 5 models with the lowest DOPE scores were selected and assessed using ERRAT, VERIFY3D, and Ramachandran plots.
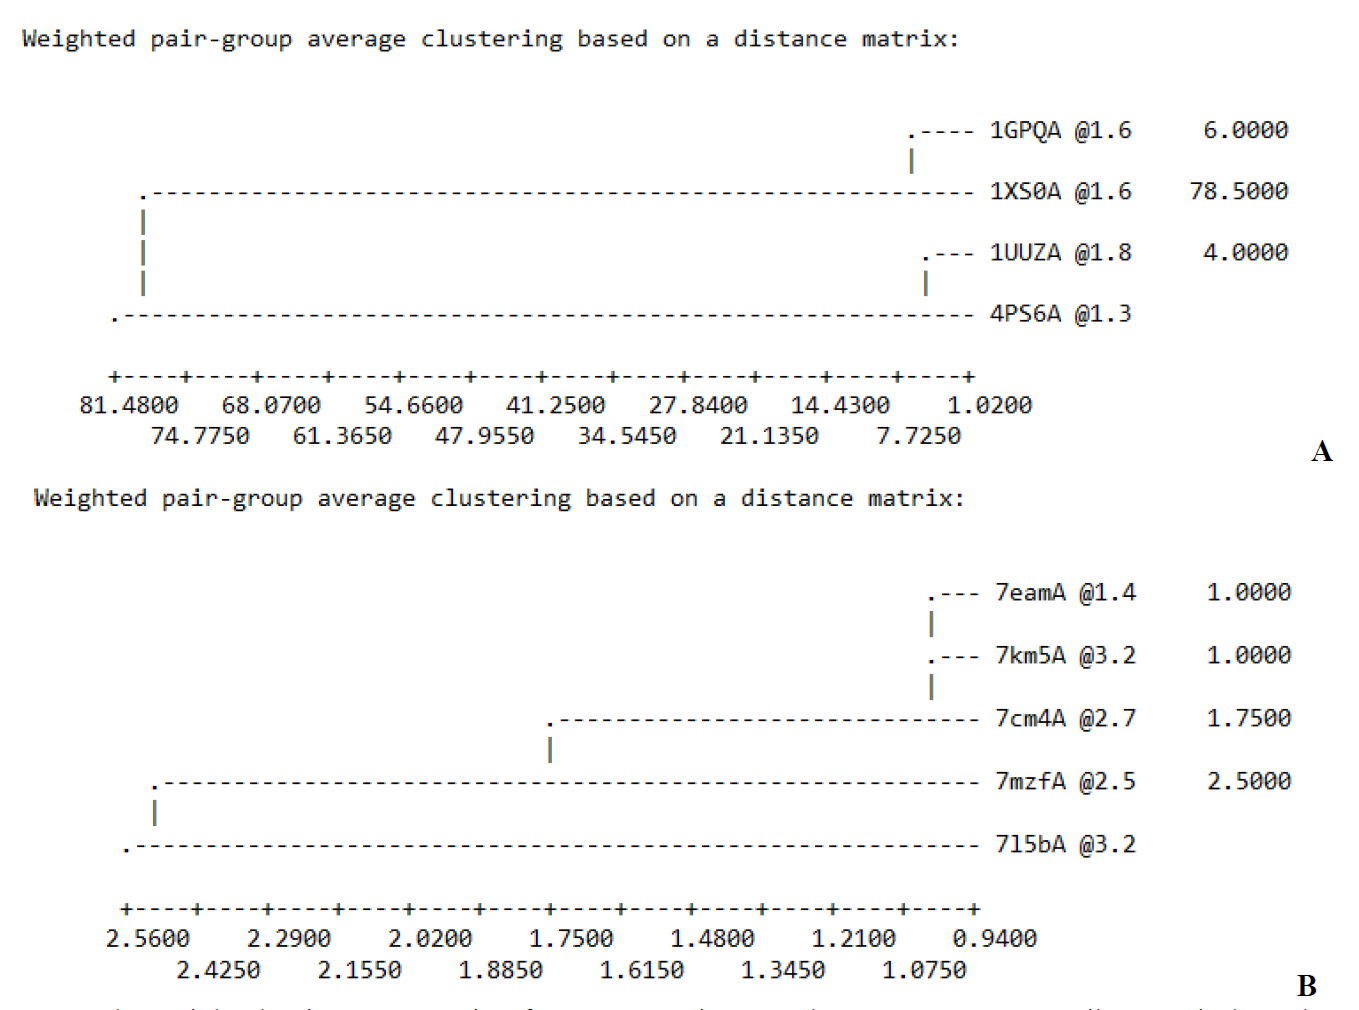
Fig. 3 The weighted pair-group matrix of (A) P. aeruginosa and (B) SARS-CoV-2 spike protein homologs were constructed by the modeller program.
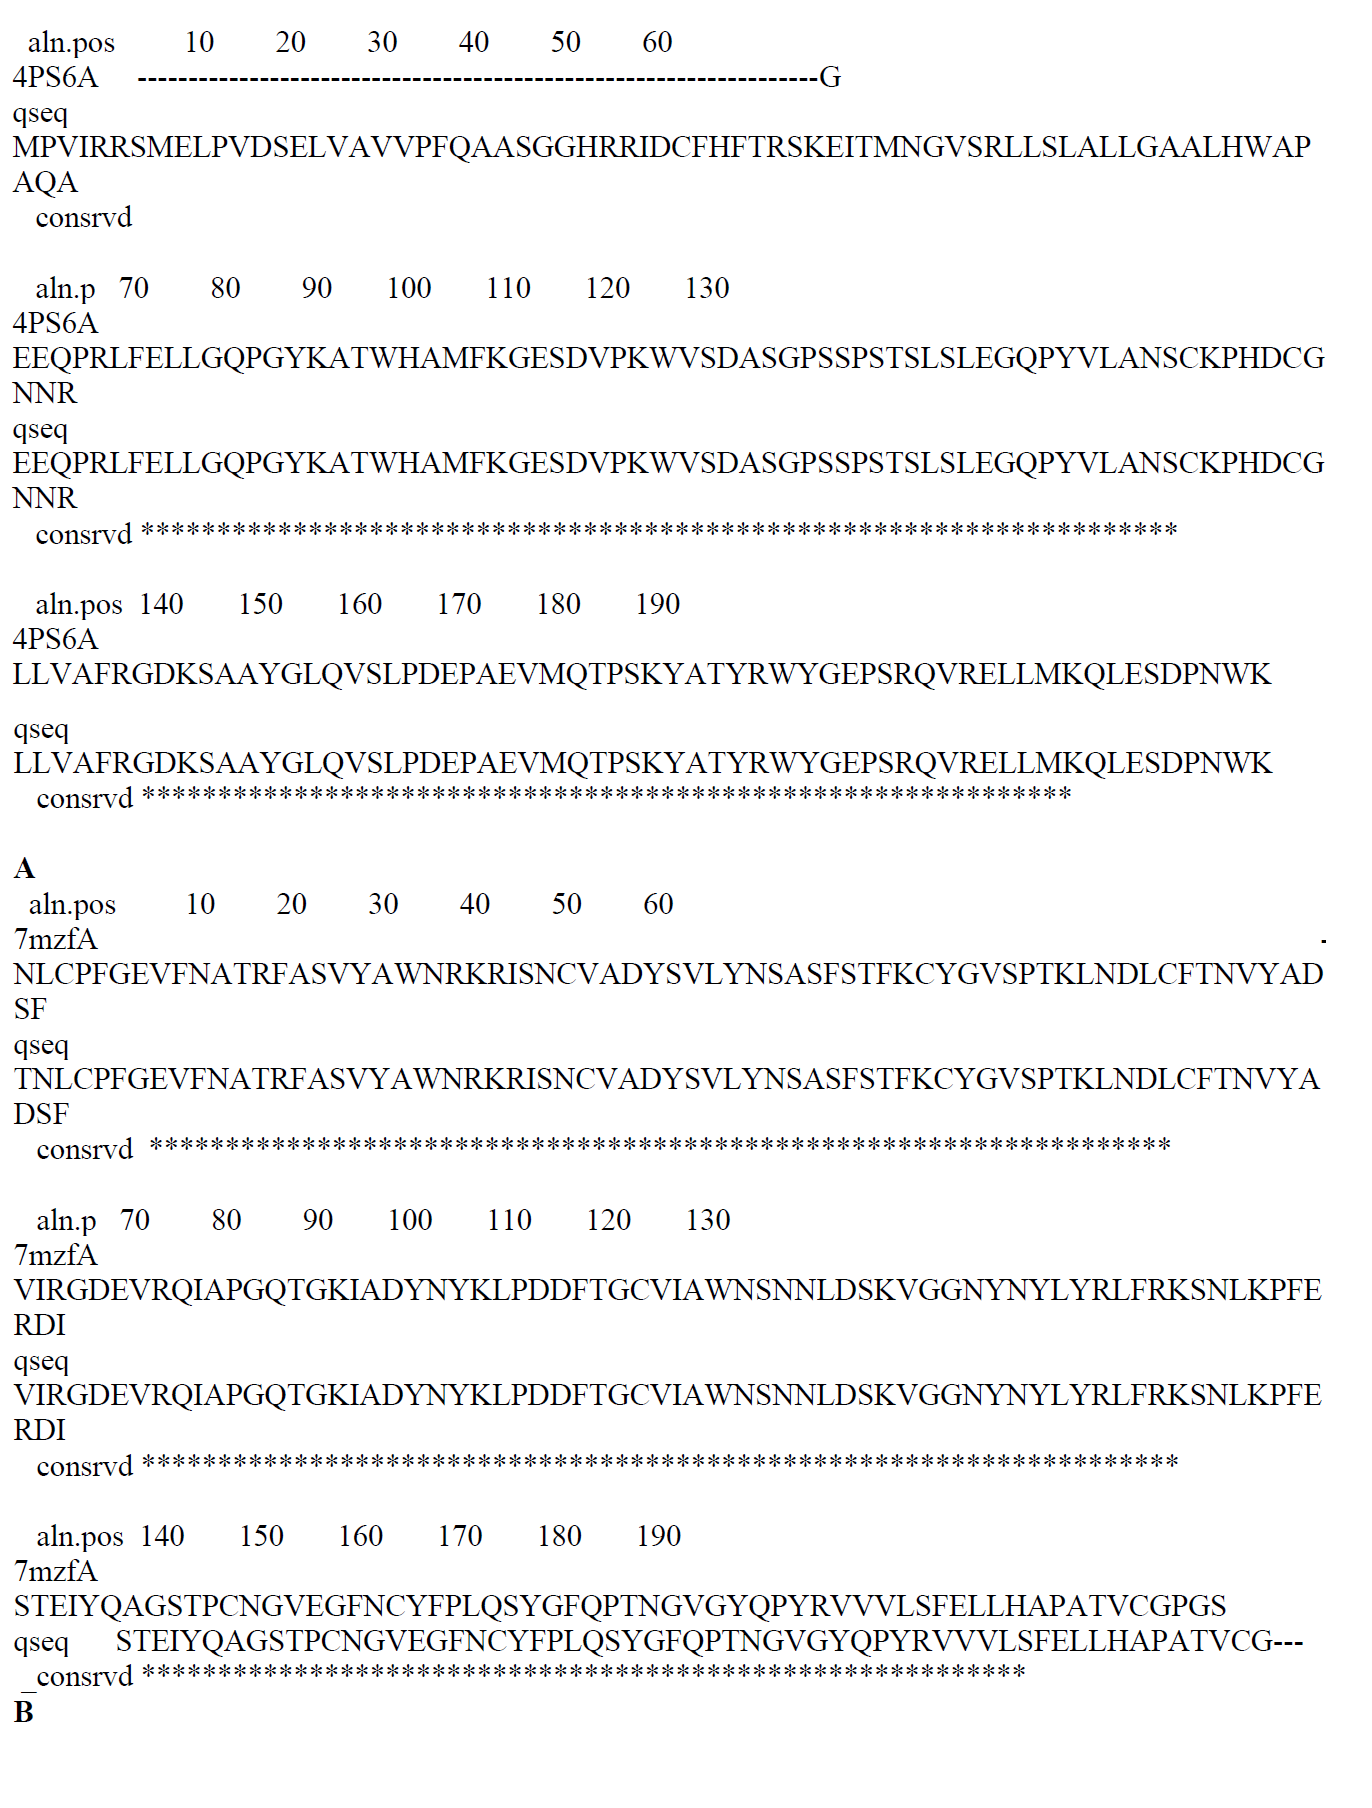
Fig. 4 Pairwise sequence alignment between the template and the query (A) and putative inhibitor of vertebrate lysozyme [Pseudomonas aeruginosa], (B) chain A, Spike protein S1 [severe acute respiratory syndrome coronavirus 2].
Table 4 Comparative analysis of five models' DOPE scores predicted by modeller.
| Filename | molpdf | DOPE score | GA341 score |
|---|---|---|---|
| PA-model01.pdb | 946.82159 | -15805.88770 | 1.00000 |
| PA-model02.pdb | 886.59521 | -15917.49902 | 1.00000 |
| PA-model03.pdb | 877.72742 | -15809.07910 | 1.00000 |
| PA-model04.pdb | 931.51996 | -15808.23438 | 1.00000 |
| PA-model05.pdb | 914.30719 | -15800.19141 | 1.00000 |
We perform energy minimization to the assessed receptors to remove side chains and later use it in the molecular docking and MD simulations.
Model number two (PA-model02.pdb) and model number one (CoV-model01.pdb) having lower DOPE scores as presented in Table 4 and Table 5, respectively were considered as the best model of P. aeruginosa and SARS-CoV-2.
Table 5 A study comparing the DOPE scores of five models predicted by the modeller.
| Filename | molpdf | DOPE score | GA341 score |
|---|---|---|---|
| CoV-model01.pdb | 1122.96790 | 22118.33008 | 1.00000 |
| CoV-model 02.pdb | 1048.29150 | -21991.14258 | 1.00000 |
| CoV-model 03.pdb | 978.01141 | -22080.57617 | 1.00000 |
| CoV-model 04.pdb | 1034.12805 | -22053.22070 | 1.00000 |
| CoV-model 05.pdb | 1049.48303 | -22097.23047 | 1.00000 |
The crystal structures of Pseudomonas aeruginosa and SARS-CoV-2 were predicted, polished, and validated. The final predicted structure of P. aeruginosa protein has a modeller objective (molpdf) score of 886.59521, genetic algorithm 342 (GA341) score of 1.0000, and the discrete optimized protein energy (DOPE) score of -15917.49902 was picked out. The modelled crystal structures SARS-CoV-2 spike protein S1 has a molpdf score of 1122.96790, GA341 score of 1.0000, and a DOPE score of -22118.33008 was also picked out. Following the sequence alignment, the DOPE score profile was generated using MODELLER's "assess dope" function to give an insight into the quality of input alignment (Fig. 5). Fig. 5 shows that the DOPE score profile of the modelled (query) and template proteins meet over a wide range of residues, and the results suggest no problematic locations.
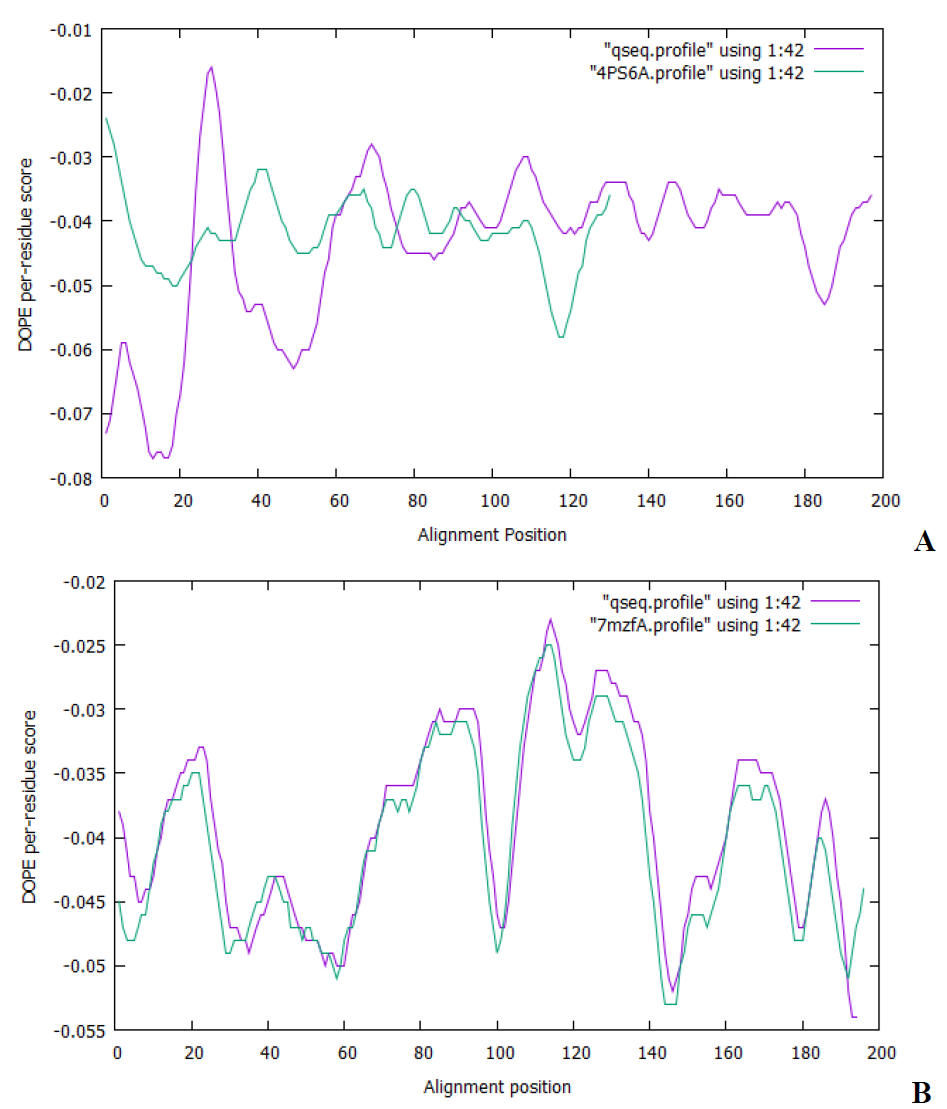
Fig. 5 The DOPE score visibility of (A) P. aeruginosa and (B) SARS-CoV-2 spike protein incurred from Modeller software.
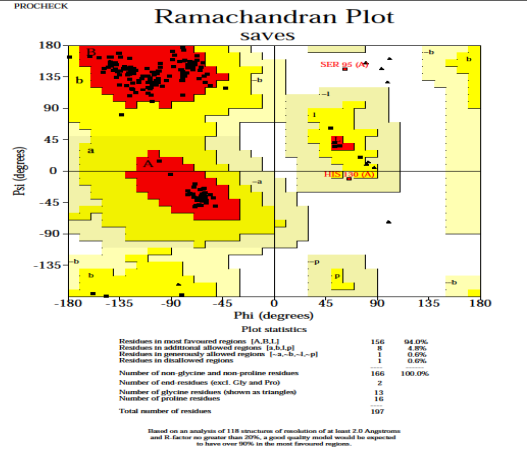
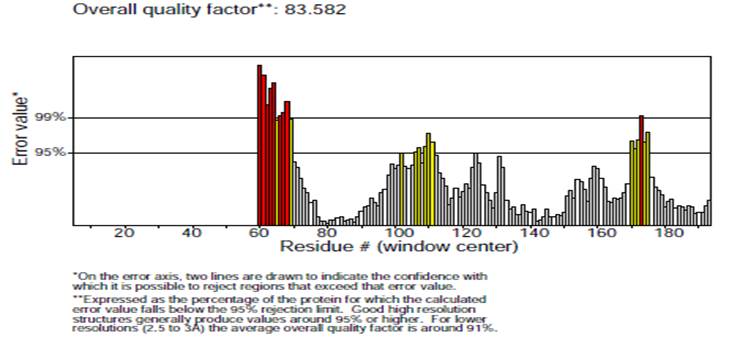
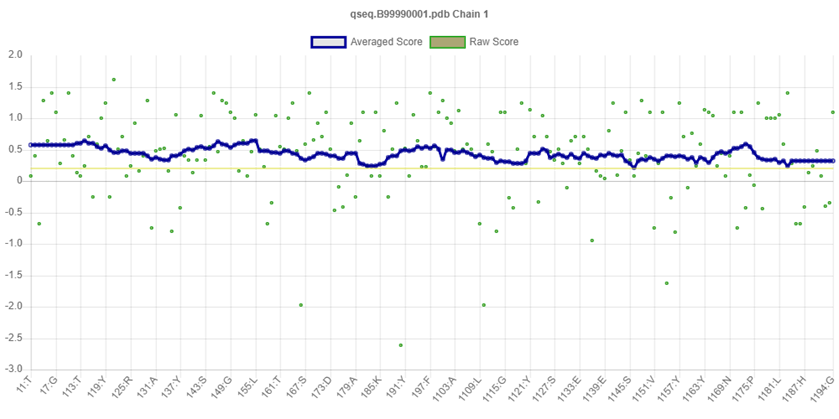
Validity of the structures analyzed for the P. aeruginosa receptor by the Ramachandran plot shows 94 % residues residing in most favored regions, 4.8 % in the additional allowed region, and 0.6 % in the generously allowed region. Only one residue was settled in the disallowed region, which constituted 0.6 % of the total protein, which constituted a good quality of the predicted model (Fig. 6). Other tests, such as Verify 3D and ERRAT also known as “overall quality factor”, were used to ensure the quality of the revised models. For non-bonded atomic interactions, the overall quality factor with larger scores indicates higher quality [65]. In general, a range of greater than 50 (> 50) indicates a high-quality model [66]. In this research, the ERRAT score for predicted modelled P. aeruginosa protein has an overall quality factor of 83.582 % (Fig. 7). Therefore, this confirmed that modelled putative inhibitor of vertebrate lysozyme pseudomonas aeruginosa protein has a high resolution and quality protein models. Verify-3D score profile access the model's quality. The Verify 3D profile of the modelled protein is shown in Fig. 8, and residues with an averaged 3D-1D score larger than zero are regarded as reliable. Some of the residues in the modelled protein have a computability score that is greater than zero. It was discovered that the structurally and functionally significant residues in the modelled potential inhibitor of vertebrate lysozyme pseudomonas aeruginosa protein had a score ranging from 0.30-0.60, indicating that the model's quality is comparable to that of high-resolution crystal structures.
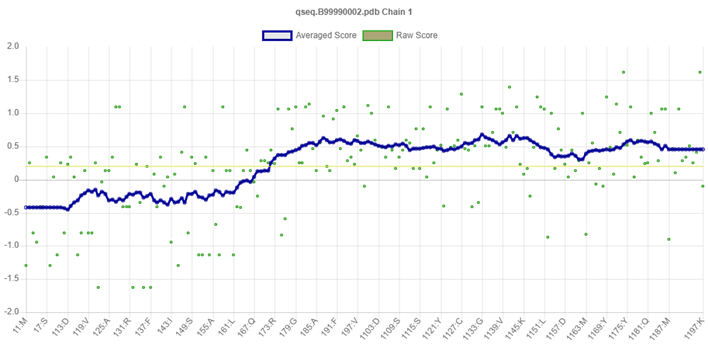
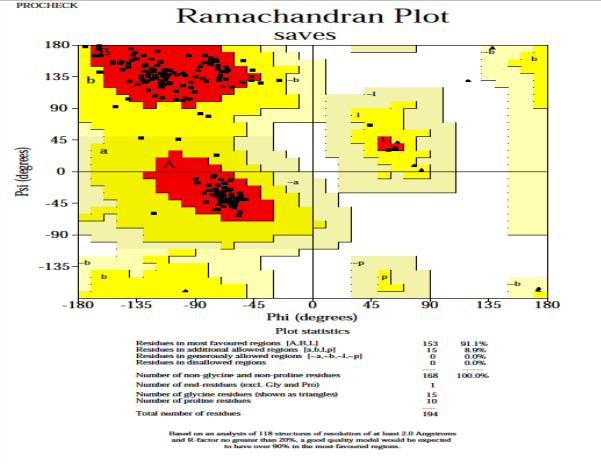
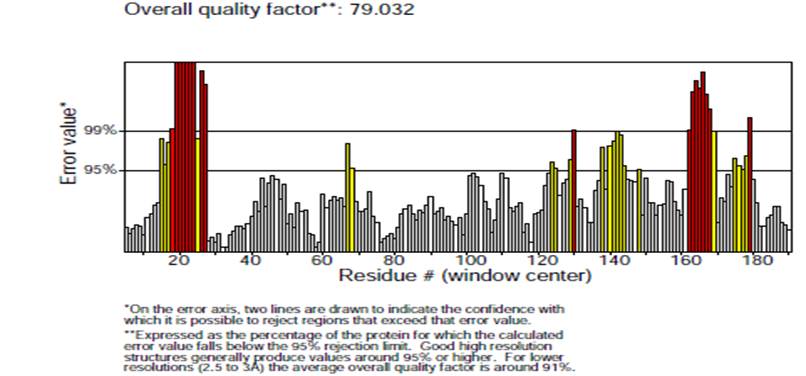
Ramachandran plot analysis was carried out on the modelled SARS-CoV-2 spike protein showed 91.1 % residues residing in highly favored regions, 8.9 % in additional allowed regions, 0.0 % residues in generously allowed and disallowed regions, respectively (Fig. 9). This also validates that the modelled crystal structure is a good quality model. The quantity of the structural error at each amino acid residue in the 3D structural model was given by the ERRAT plot. The overall quality factor of the computed model was 79.032 % (Fig. 10). Also, the Verify3D plot of the SARS-CoV-2 modelled spike protein (Fig. 11) was obtained for the structure validation and it showed as PASS. Verify-3D ratings near 1.0 correspond to scores that would be expected for a legitimate protein of similar size. It was also discovered that more than 90 % of the residues had a score of more than 0.2, implying that more than 90 % of the residues were complemented by the 1D-3D model, implying that the predicted model's quality is adequate.
Molecular Docking Results
Rating of docking simulation methodological analysis
At first, the Molegro virtual docker (MVD) and AutoDock Vina programs estimated with PyRx were selected to carry out a docking-based virtual screening approach. Both Scoring Functions were supplied to select the best ligand against P. aeruginosa and SARS-CoV-2.
Molecular docking simulation is of two types; namely the oriented docking simulation and the blind docking simulation [67,68]. Blind molecular docking simulation is a docking procedure in which the position of the enzyme's active site is unknown, and the grid center of attention used during grid box determination is not unique to a specific area but is applied throughout the entire enzyme area. The grid box was specifically resolved after orienting docking by establishing the position of the enzyme active site. Because the active site region has been established, oriented docking was used in this study (using Melogro Virtual Docker). In this case, an oriental docking simulation was carried out. The molecular docking simulation of 25 iminoguanidine derivatives, against modelled proteins Pseudomonas aeruginosa and SARS-CoV-2 Spike protein, were performed using MVD software. The modelled protein was taken as the substrate for molecular docking. The substrate had only three cavities. From the three (3) predicted cavities the one with the highest volume was picked for molecular docking simulations. The cavity with volumes 48.64 Å3 (Fig. 12) and 11.78 Å3 (Fig. 13) are used for docking against P. aeruginosa and SARS-CoV-2, respectively. The MolDock score [69] was picked out for rating the inhibitor poses, and for all the modelled proteins docking executed here, the poses picked out as the best were those with the most prominent MolDock score. The MolDock score of all the ligands including the reference drugs ranges from -125.553 kcal/mol to 7320.88 kcal/mol as presented in Table 6. The reference drug (Ruxolitinib) has the highest negative MolDock score of -125.553 kcal/mol and -117.237 kcal/mol, followed by compound 15 with -117.489 and -102.85 kcal/mol against P. aeruginosa and SARS-CoV-2 Spike protein, respectively.
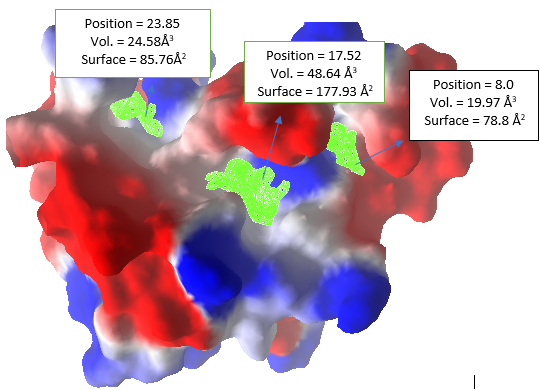
Fig. 12 Modelled protein of potential inhibitor of vertebrate lysozyme [Pseudomonas aeruginosa] with electrostatic surface and active site cavity (green grid).
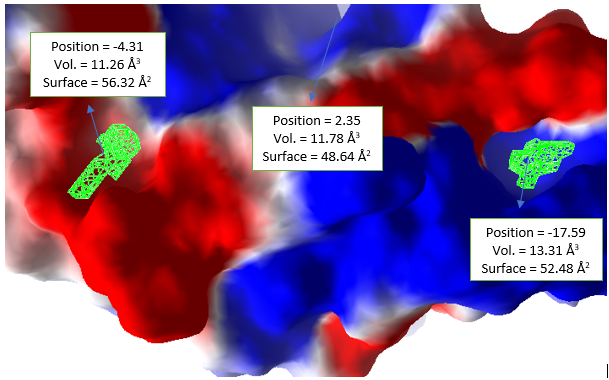
Fig. 13 The electrostatic surface and active site cavity (green grid) of modelled protein of SARS-CoV-2 Spike protein S1.
Table 6 The docking energies of Pseudomonas aeruginosa and SARS-CoV-2.
| Compound Number | Putative inhibitor of vertebrate lysozyme [Pseudomonas aeruginosa] | SARS-CoV-2 Spike protein S1 | ||||
|---|---|---|---|---|---|---|
| MolDock Score | Rerank Score | HBond | MolDock Score | Rerank Score | HBond | |
| 1 | -70.1638 | -61.8064 | -2.063 | -68.012 | -52.3464 | -6.938 |
| 2 | -78.6419 | -65.4992 | -0.1895 | -74.8674 | -63.0005 | -4.2532 |
| 3 | -78.0857 | -62.122 | -4.7344 | -70.0071 | -57.925 | -7.4733 |
| 4 | -74.7886 | -62.1973 | -1.0691 | -75.2023 | -63.9325 | -5.7075 |
| 5 | -75.7968 | -69.6859 | -2.2375 | -78.1734 | -71.7748 | -10.972 |
| 6 | -76.4574 | -65.8232 | -0.8352 | -74.2074 | -65.5021 | -6.5918 |
| 7 | -86.7011 | -76.9983 | -1.4985 | -78.6897 | -68.0336 | -0.4485 |
| 8 | -77.9807 | -66.1488 | -0.2075 | -63.489 | -42.3824 | -4.0915 |
| 9 | -77.39 | -63.7478 | -2.3958 | -76.7554 | -65.5159 | -7.1415 |
| 10 | -81.445 | -62.382 | -2.1289 | -78.2765 | -68.2709 | -1.1466 |
| 11 | -77.9612 | -65.2889 | 0 | -76.3297 | -66.2211 | -4.8914 |
| 12 | -87.3695 | -72.0002 | -1.0544 | -85.7218 | -74.148 | -6.5194 |
| 13 | -73.5418 | -63.5228 | -0.6091 | -65.7669 | -42.6207 | -4.1196 |
| 14 | -70.2995 | -62.085 | -1.7337 | -65.2352 | -41.5776 | -4.1817 |
| 15 | -117.489 | -94.1851 | -2.9057 | -102.85 | -89.8918 | -7.9081 |
| 16 | -74.9906 | -63.4911 | -3.4383 | -76.7682 | -65.6931 | -7.1996 |
| 17 | -76.9665 | -63.8531 | -1.178 | -67.7912 | -61.0345 | -8.9551 |
| 18 | -86.185 | -71.2461 | -0.1287 | -81.353 | -61.7442 | -2.5 |
| 19 | -82.6353 | -69.5908 | -6.5194 | -71.7263 | -49.8586 | -6.2159 |
| 20 | -73.5011 | -60.3293 | -4.3336 | -71.293 | -61.5842 | -6.1265 |
| 21 | -75.3018 | -62.8724 | -5.2574 | -77.3631 | -66.4571 | -7.1931 |
| 22 | -84.3353 | -71.885 | -0.5039 | -84.2272 | -71.6465 | -8.0651 |
| 23 | -77.2196 | -63.3773 | -1.2512 | -80.6143 | -68.8821 | -7.3401 |
| 24 | -75.1741 | -62.151 | -0.0435 | -80.6 | -68.6933 | -6.7389 |
| 25 | -74.903 | -64.3062 | -1.2884 | -68.427 | -43.4749 | -4.1837 |
| Chloroquine | -111.536 | -82.6976 | -1.1128 | -101.402 | -72.2266 | -4.5758 |
| Ampicillin | -114.864 | -95.187 | -8.8215 | -102.865 | -81.7504 | -4.5601 |
| Vibramycin | 3239.53 | 565.867 | -0.6755 | 3342.46 | 660.603 | -2.3881 |
| Ruxolitnib | -125.553 | -97.9409 | -2.3851 | -117.237 | -88.9727 | -6.1061 |
The reference drug (Ruxolitinib) against the protein of putative inhibitor of vertebrate lysozyme (Pseudomonas aeruginosa) formed two hydrogen bond interactions with Cys132 and Asp193 (Fig. 14(A)). Next is compound 15 which also formed two hydrogen bond interactions with the modelled protein first with Asn125, secondly with Gln189 (Fig. 14(B)). Against the modelled protein of SARS-CoV-2 Spike protein S1, the reference drug Ruxolitinib with the highest negative MolDock score of -117.237 kcal/mol formed hydrogen bond interactions with Lys126, Asn149, and Cys148, respectively (Fig. 15(A)). In Fig. 15(B), compound 15 formed five (5) hydrogen bond interactions with the same modelled proteins. The five hydrogen bond interactions of compound 15 are with Arg125, Lys126, and Ser127, respectively.
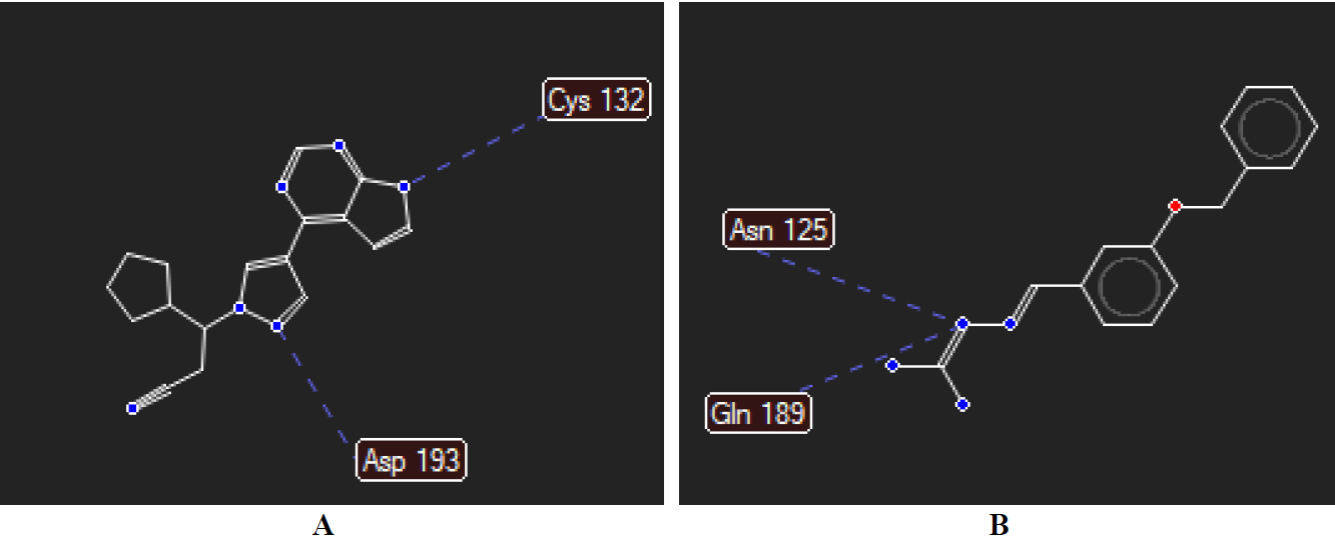
Fig. 14 Hydrogen bond interactions between (A) Ruxolitinib and (B) compound 15 with modelled protein of putative inhibitor of vertebrate lysozyme [Pseudomonas aeruginosa].
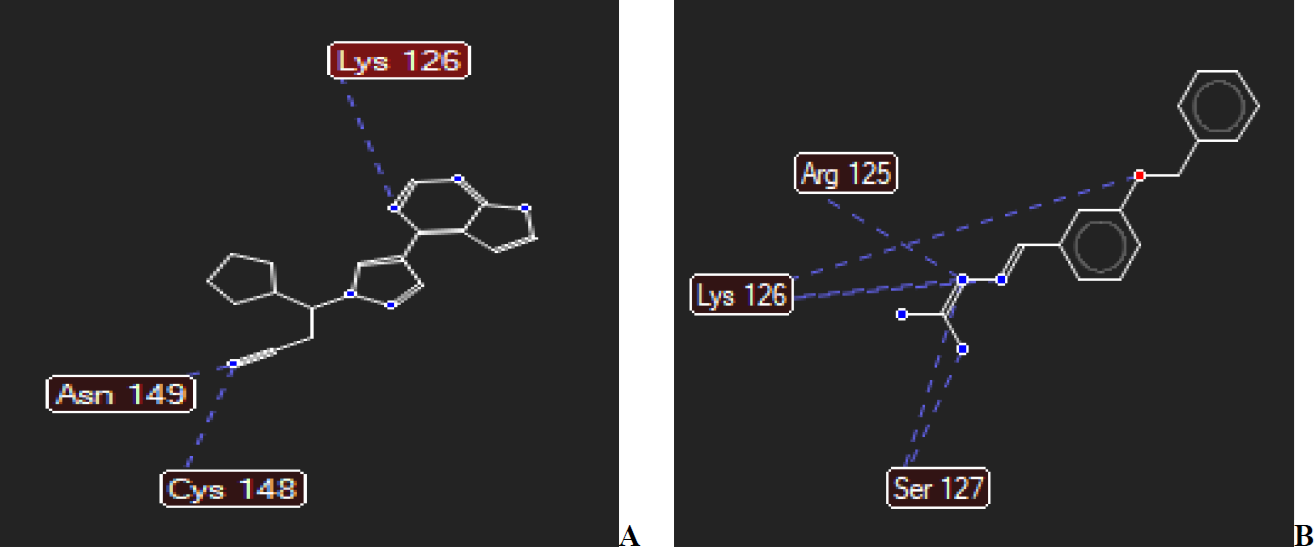
Fig. 15 Hydrogen bond interactions between (A) Ruxolitinib and (B) compound 15 with modelled protein of SARS-CoV-2 Spike protein S1.
Again, blind molecular docking simulations were carried out for all 25 compounds including the reference compounds with PyRx v0.8 software. In the molecular docking simulations with PyRx, we make use of the modelled proteins as the target. The binding affinity values obtained as a result of the molecular docking analyses are shown in Table 7. The negative value of binding affinity as presented in Table 6 suggests the stability of the protein-ligand complex. From the table, the reference compound “Vibramycin” has the highest binding affinity value of -7.4 kcal/mol for P. aeruginosa and SARS-CoV-2, respectively. The reference compound (Vibramycin) interacted with P. aeruginosa modelled protein structure (Fig. 16) showed the corresponding amino acids such as aspartic acid, phenylalanine, glycine, glutamine, tyrosine, and so on. The docking of Vibramycin forms some hydrogen bonds and electrostatic interactions with the modelled protein. Vibramycin is observed to show three (3) hydrogen bond interactions with Ser192 (3.87 Å), Gln189 (5.33 Å), and Gln189 (4.27 Å) against P. aeruginosa modelled protein (Fig. 16(A)). Vibramycin exhibits three electrostatic interactions, one unfavorable acceptor-acceptor interaction, one carbon-hydrogen bond with Pro131 (6.23 Å), and two conventional hydrogen bond interactions with Ser182 (3.87 Å) and Glu184 (4.79 Å), respectively against SARS-CoV-2 protein (Fig. 16(B)).
Table 7 Autodock-Vina predicted binding affinity (kcal/mol) of P. aeruginosa and SARS-CoV-2 spike protein.
| Ligand | P. aeruginosa | SARS-CoV-2 |
|---|---|---|
| Binding Affinity | Binding Affinity | |
| 1 | -5.4 | -5.8 |
| 2 | -5.7 | -6.3 |
| 3 | -6.2 | -6.2 |
| 4 | -6.4 | -6.2 |
| 5 | -5.6 | -6.2 |
| 6 | -6.2 | -6.1 |
| 7 | -6.9 | -6.9 |
| 8 | -5.5 | -6 |
| 9 | -6.3 | -6.1 |
| 10 | -5.7 | -6.2 |
| 11 | -5.4 | -6.4 |
| 12 | -6.3 | -6.6 |
| 13 | -5.6 | -6.3 |
| 14 | -5.2 | -5.9 |
| 15 | -5.9 | -7.2 |
| 16 | -6.1 | -6 |
| 17 | -5.9 | -6 |
| 18 | -6.6 | -7.1 |
| 19 | -5.8 | -6.3 |
| 20 | -5.6 | -6.3 |
| 21 | -6.8 | -6.2 |
| 22 | -6 | -6.3 |
| 23 | -5.6 | -5.9 |
| 24 | -5.3 | -6.4 |
| 25 | -5.7 | -6.1 |
| Chloroquine | -4.1 | -4.8 |
| Ruxolitnib | -5.9 | -7.0 |
| Vibramycin | -7.4 | -7.4 |
| Ampicillin | -5.9 | -6.7 |
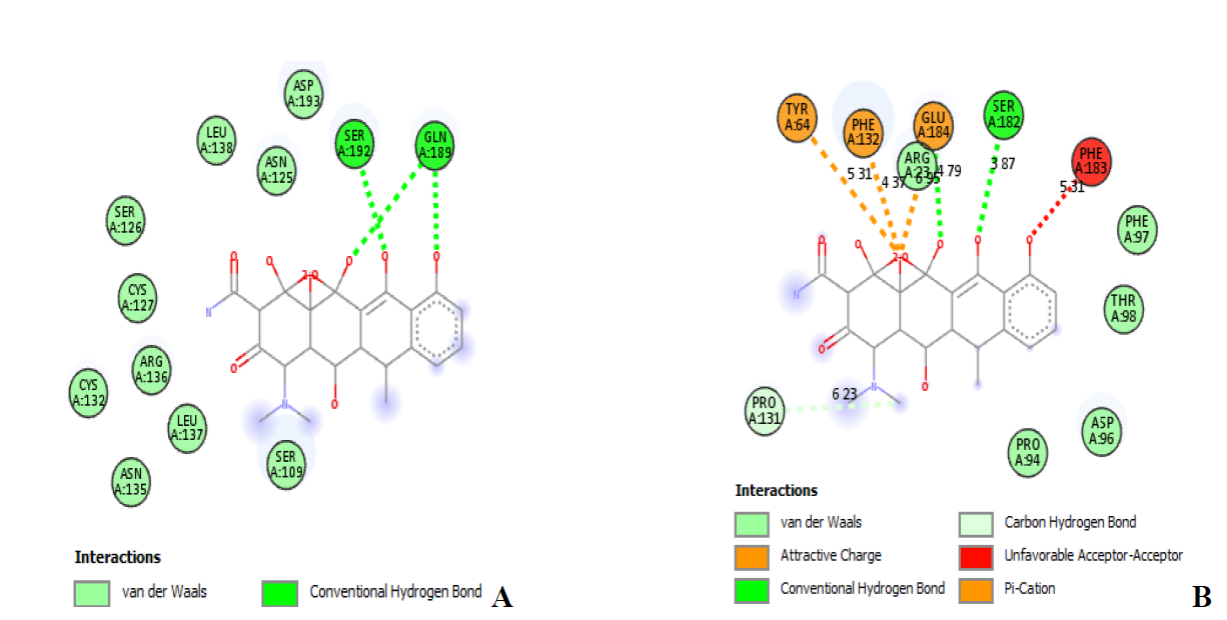
Fig. 16 The 2D illustrations of interactions between Vibramycin and the modelled (A) P. aeruginosa and (B) SARS-CoV-2 spike protein receptors.
Compounds 7 and 15 were selected based on their remarkable binding affinity of -6.9 and -7.2 kcal/mol for P. aeruginosa and SARS-CoV-2 spike protein receptors respectively compared to the reference compound’s -7.4 kcal/ mol. The molecular docking contact modes for compounds 7 and 15 are shown in Figures 17 and 18, respectively. The molecular docking interaction of compound 7 with the active site of modelled P. aeruginosa protein reveals two conventional hydrogen bonds between the hydrogen atoms of compound 7 and the amino acid Ser109 with distances of 3.45 and 4.04, respectively, and one carbon-hydrogen bond between the carbon atom and the amino acid Pro107 with a distance of 5.47. The hydrophobic interaction was performed between one of the naphthalene ring and amino acids Arg136 (5.84 Å) and Cys127 (5.04 Å). Moreover, the electrostatic interaction is observed between one of the naphthalene rings and the amino acids Asp193 (5.94 Å) and Arg136 (5.48 Å).
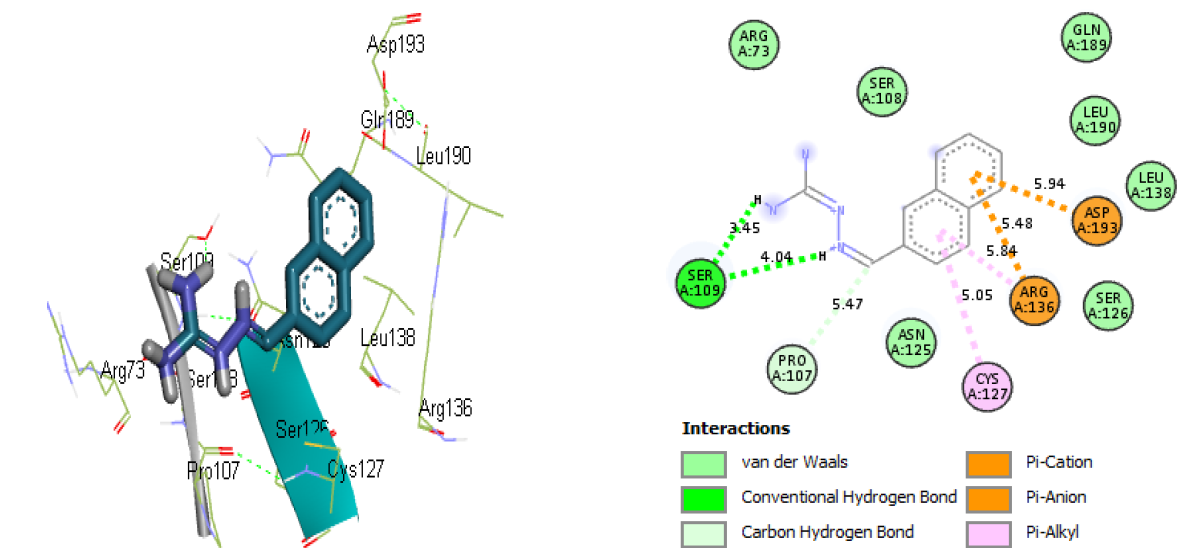
Fig. 17 The 3D and 2D representations of interactions between compound 7 and modelled P. aeruginosa receptor.
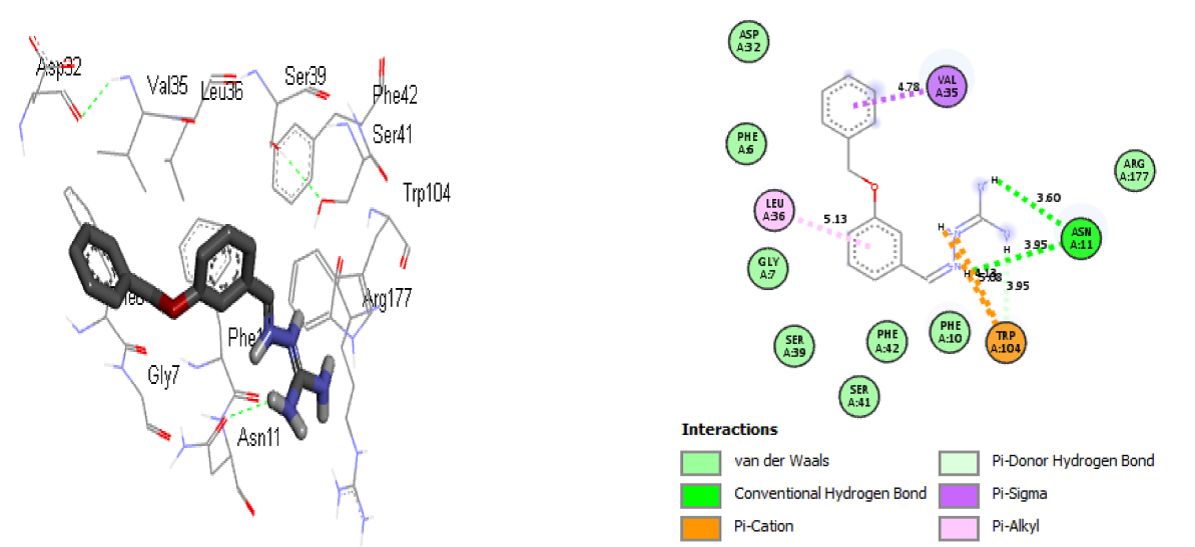
Fig. 18 The 3D and 2D representations of interactions between compound 15 and modelled SARS-CoV-2 spike protein receptor.
Nevertheless, compound 15 forms two conventional hydrogen bonds with amino acid Asn11 (3.60 and 3.95 Å), one pi-donor hydrogen bond with Trp104 (3.95 Å) with the active site of modelled SARS-CoV-2 spike protein. The hydrophobic interaction was performed between one of the benzyloxy and toluene rings with amino acids Leu36 (5.13 Å) and Val35 (4.78 Å), respectively. Furthermore, the electrostatic interaction is observed between hydrogen and the amino acid Trp104 (4.13 Å). The hydrogen bonds, the hydrophobic interactions, and the electrostatic interactions in the complexes showed that compounds 7 and 15 of iminoguanidine derivatives are most active against modelled P. aeruginosa receptor and modelled SARS-CoV-2 spike protein, respectively.
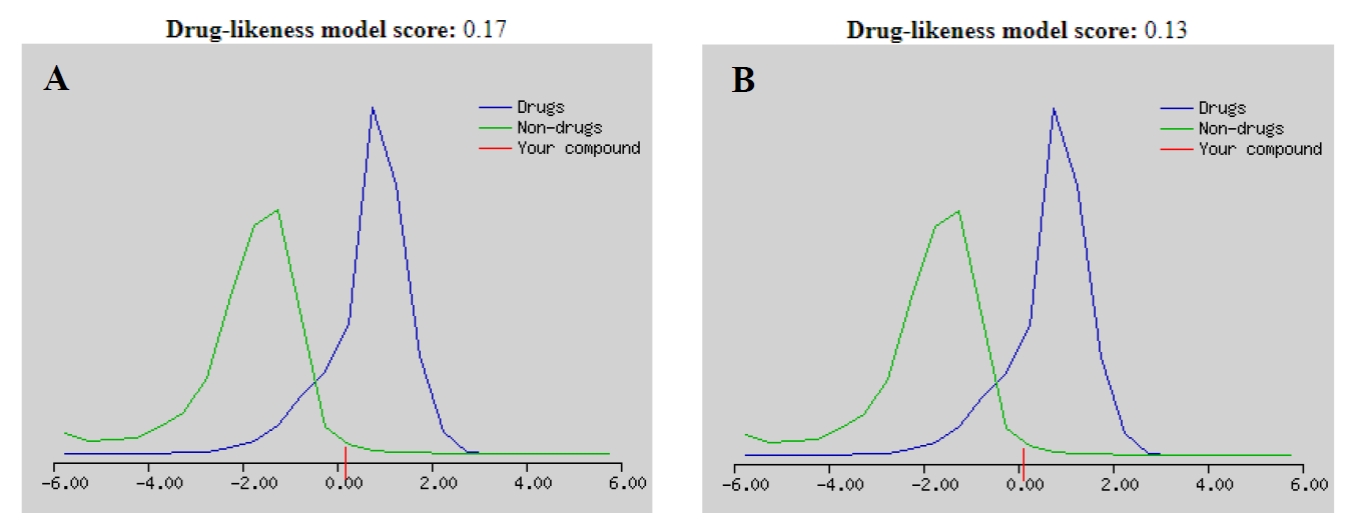
Lipinski's rule of five aids [70] in the differentiation of drug-like and non-drug-like compounds. It forecasts a high likelihood of success or failure due to drug-likeness for compounds that meet two or more of the rules stated in Table 7. The chemical structure of compounds 7 and 15 was submitted to the MolSoft server in SMILE format, to guess the in silico pharmacokinetic parameters. Based on these properties, we investigated how our lead ligands met the Lipinski rule of five (5). The table (Table 8) shows the properties of compounds 7 and 15 in which both of the compounds fulfilled the Lipinski rule of 5. The MollogS value is less than or equal to -4.0. These compounds have a low MolLogS value, indicating that they are difficult to dissolve in water [71]. The aromatic and non-polar fragments around the chemical structures are most likely to blame. Despite this, their intestinal absorption is high, exceeding 90 %.
Table 8 The pharmacokinetic parameter of compounds 7 and 15 using MolSoft server.
| Compound 7 | values | Compound 15 | values |
|---|---|---|---|
| Molecular formula | C12 H14 N4 | Molecular formula | C15 H18 N4 O |
| Mol. weight (≤ 500 D) | 214.12 | Mol. weight (≤ 500 D) | 270.15 |
| Number of HBA (≤10) | 2 | Number of HBA (≤10) | 3 |
| Number of HBD (≤ 5) | 5 | Number of HBD (≤ 5) | 5 |
| MolLogP (≤ 5) | 1.24 | MolLogP (≤ 5) | 1.42 |
| MolLogS | -1.96 | MolLogS | -1.48 |
| MolPSA (≤ 140) | 64.39 A2 | MolPSA (≤ 140) | 71.89 A2 |
| MolVol | 199.97 A3 | MolVol | 255.68 A3 |
| PKA of most Basic/Acidic group | 11.82 / 16.27 | PKA of most Basic/Acidic group | 11.82/ 16.29 |
| BBB score | 3.06 | BBB score | 3.00 |
The leads in Fig. 19(A) and 19(B) showed that these molecules display ADME profile within the desired range as presented in Table 7, and therefore the values of these parameters shed light on their drug-likeness features, which could set up an essential starting point to encourage experimental procedures.
Molecular dynamics (MD) simulations
The study of molecular dynamics simulation in the modelled SARS-CoV-2 spike protein was being used to figure out how flexible is docked compound 15, and this evaluation was lasted up to 1 ns. To compute these RMSD, RMSF, and SASA values we used the VMD plugin with a probe radius set to 1.4 Å. Other thermodynamic parameters investigated are the total energy, potential energy, and kinetic energy of the docked protein-ligand complex [71]. To understand the structural aberrations across the simulation track, the RMSD of the c-alpha atoms in the protein-ligand complex was analyzed. The RMSD value of the complex increased at the start of the simulation, as seen in Fig. 20(A). The protein-ligand complex then stabilized at 400 and 500 ps, before rapidly increasing from 600 to 800 ps. The protein-ligand complex remained stable until the simulation's final phase, 1 ns. To estimate the amino acid residue flexibility, the RMSF of the protein-ligand complex was calculated. The majority of residues had RMSF values < 2.0 Å, as seen in Fig. 20(B). The presence of peaks indicates the areas fluctuate the most during the simulation. The fluctuations observed are around 1.9 Å (600 ps) and less around 0.4 Å (1 ns) which signifies the stability of the system. This RMSF profile indicates a complex that is less flexible and inflexible. The surface area of a group that is accessible to a solvent probe is known as the solvent-accessible surface area (SASA) [or temporarily accessible surface area (ASA)]. Protein folding and stability have always been determined by the solvent-accessible surface area (SASA). The SASA trend in the predicted protein-ligand complex was higher, indicating an increase in surface volume. Nonetheless, this complex had a high number of SASA deviations, indicating that the protein's surface area was changing significantly. The SASA value for the un-simulated protein-ligand complex has a lower value in comparison with the simulated protein-ligand (Table 9) which indicates that the simulated protein-ligand complex is more exposed to water and also increases in cavities. The SASA profile in Fig. 20(C) confirmed the claim.
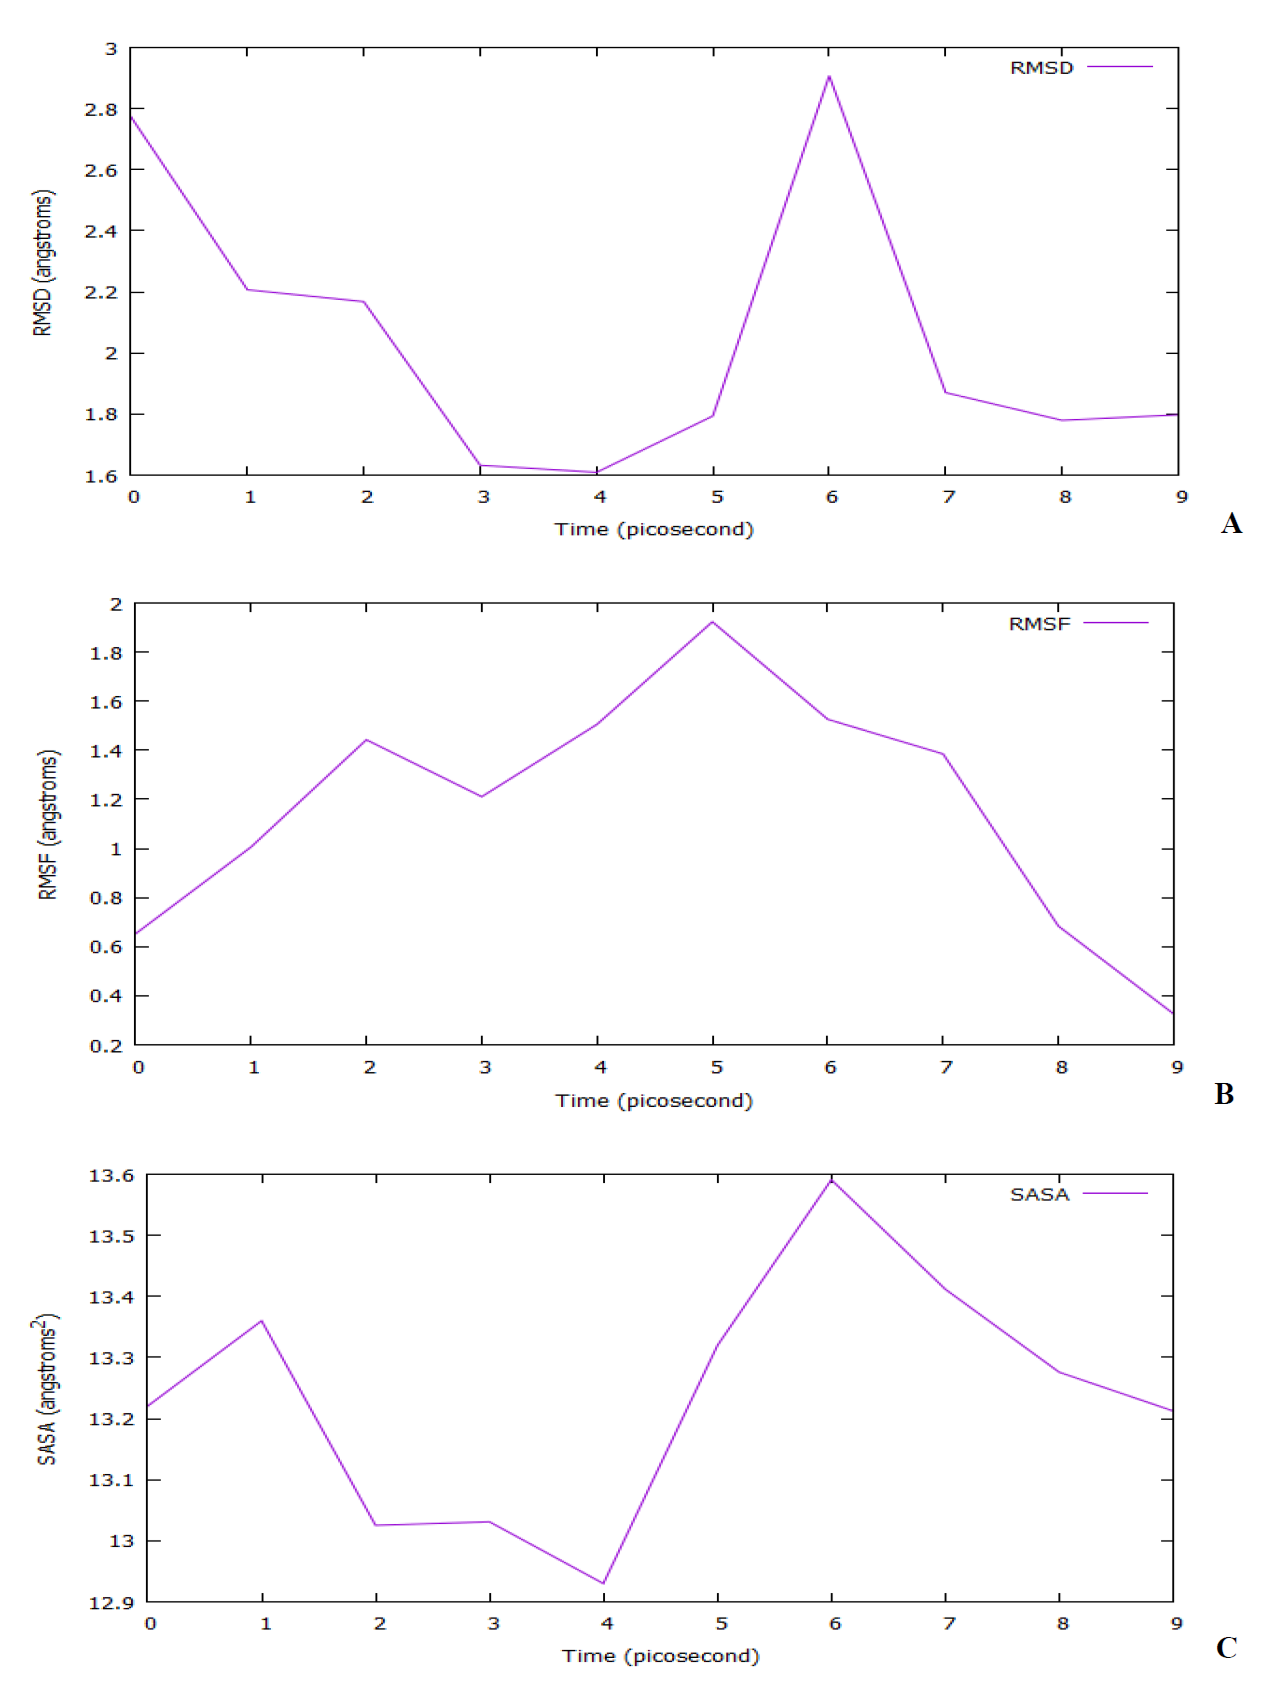
Fig. 20 The molecular dynamics simulation of the complexes. (A) Root mean square deviation (RMSD), (B) Root mean square fluctuations of the amino acid residues (RMSF), and (C) Solvent accessible surface area (SASA).
Table 9 The solvent-accessible surface area of un-simulated and simulated complexes.
| The surface area of SARS-CoV-2 spike protein | |
|---|---|
| Number of non-HOH | non-H atoms=1537 |
| Probe radius=1.40 | |
| TOTAL, ASA=10006.94 | TOTAL, MSA=8706.50 |
| Polar ASA=4481.68 | Non-polar ASA=5525.26 |
| Polar MSA=3401.84 | Non-polar MSA=5304.67 |
| Total backbone ASA=2134.02 | Total backbone MSA=2404.09 |
| Polar backbone ASA=1414.88 | Non-polar backbone ASA=719.14 |
| Polar backbone MSA=1449.43 | Non-polar backbone MSA=954.66 |
| Polar side chain ASA=3066.80 | Non-polar side chain ASA=4806.12 |
| Polar side chain MSA=1952.40 | Non-polar side chain MSA=4350.01 |
| +charge ASA=690.04 | -charge ASA=450.70 |
| +charge MSA=484.54 | -charge MSA=263.31 |
| Structure contains 10 cavities | A |
| The surface area of SARS-CoV-2 spike protein after 1 nanosecond | |
| Number of non-HOH | non-H atoms=1733 |
| Probe radius=1.40 | |
| TOTAL, ASA=11687.42 | TOTAL, MSA=0.00 |
| Polar ASA=6785.50 | Non-polar ASA=4901.92 |
| Polar MSA=0.00 | Non-polar MSA=0.00 |
| Total backbone ASA=2325.91 | Total backbone MSA=0.00 |
| Polar backbone ASA=1612.36 | Non-polar backbone ASA=713.55 |
| Polar backbone MSA=0.00 | Non-polar backbone MSA=0.00 |
| Polar side chain ASA=5173.14 | Non-polar side chain ASA=4188.37 |
| Polar side chain MSA=0.00 | Non-polar side chain MSA=0.00 |
| +charge ASA=831.32 | -charge ASA=575.06 |
| +charge MSA=0.00 | -charge MSA=0.00 |
| Structure contains 13 cavities | B |
A = the un-simulated protein-ligand complex; B = the simulated protein-ligand complex.
The MD simulations of the 10 frames and the hydrogen bond information of these 10 confirmations are listed in Fig. S6. From the figures, conformation 3, 5, 8, and 9 has 4, 2, 2, and 2 hydrogen bonds, respectively. The amino acids that appear more as conventional hydrogen bond and carbon-hydrogen bond interactions are Ser41 and Asp 32, respectively. From conformation 1 to 10, amino acid residue Ser41 appears in all the interactions either as hydrogen bond or van der Waals interactions to the ligand. After 1 ns MD simulation (the last confirmation “10”), the residue interactions and protein-ligand 2D contact contour map show that van der Waals and hydrophobic interactions were crucial contributions for the stability of the hit drug.
Fig. S7 depicts a change in total energy versus time in 1 ns of molecular dynamics simulation, which displays a slight fluctuation throughout the 1 ns. It also suggested that when the protein was simulated up to or beyond 1 ns, total energy (at or above -137713. 02 KJ/mol), and kinetic energy (at or beyond 31498.99 kJ/mol), compound 15 produced a stable combination with expected protein structure. Moreover, the examined system's potential energy in 1 ns of simulation at 303.15 K was -169212.01 KJ/mol (Fig. S7(C)). As a result, under stable temperature settings, the derived equilibrium structure of the expected spike protein S1 structure was obtained at 303.15 K. These findings reveal that in the MD simulation, energy conservation was met. At the end of the MD simulation, the coordinates of the ligand in the inserted binding site were changed (Fig. S6), demonstrating the utility of MD simulations after ligand docking in the binding site. Except for Asp32, Leu36, Phe42, Phe10, Phe6, Asn11, and Val35, the active site residues determined by docking were changed, and new residues such as Cys29, Val192, Tyr33, Val30, Ala31, Ile26, Leu181, and Val63 are positioned near ligands and could involve in the interaction, according to exploratory molecular dynamics simulations on the complex between the ligand.
Conclusion
In this paper, we outline how QSAR, homology modelling, docking, and molecular dynamic simulation were used to investigate numerous proteins, including a suspected inhibitor of vertebrate lysozyme [Pseudomonas aeruginosa] and chain A, spike protein S1 [SARS-CoV-2]. The 2D-QSAR was utilized to investigate iminoguanidine derivatives as a negative catalyst against P. aeruginosa. The GA-MLR results revealed that ATSC1s and SHBint7 are the most critical descriptors for predicting inhibitor activity. As a result, ATSC1s have a considerable beneficial effect on pMIC50 levels, but SHBint7 has a negative effect. The data gathered so far will aid in predicting the activity of novel P. aeruginosa inhibitor candidates. A protein structure was created with the use of various templates utilizing homology modelling techniques to explore the hit molecule's inhibitions, and validation investigations (ERRAT, VERIFY3D, and PROCHECK) indicated that the predicted protein structure was reliable and of high quality. The binding mechanism of these ligands is revealed by docking simulation studies of anticipated protein structures, as well as the amino acid involved in ligand recognition. After a successful docking simulation, exploratory molecular dynamics simulations on the ligand-protein complex disclosed that, except for Asp32, Leu36, Phe42, Phe10, Phe6, Asn11, and Val35, the rest of the residues in the active site ascertained by docking were altered, and some new residues such as Cys29, Val192, Tyr33, Val30, Ala31, Ile26, Leu181, and Val63 were positioned in the interaction. It appears reasonable to conclude that selected compound 15 could be a good option for treating P. aeruginosa and the SARS-CoV-2 virus and that it will hopefully have a long and interesting future in the identification and optimization of promising leads with high potential for developing new therapeutic agents. We expect that our findings should contribute to the development of effective antimicrobials for P. aeruginosa and the SARS-CoV-2 virus.

