


 nova página do texto(beta)
 Inglês (pdf)
 Artigo em XML
 Referências do artigo
 Enviar este artigo por email
 Citado por SciELO
  Similares em
SciELO
Similares em
SciELO 
 Permalink
Introduction
In the last decade, the search for antiviral drugs continued to attract worldwide scientists for the treatment of AIDS, hepatitis, avian, swine flu epidemics. Unlike antibiotics, which work against only bacteria by disrupting bacterial metabolism, these compounds traditionally terminate the pathway of viral replication by inhibiting proteins needed for virus propagation.
Tenofovir disoproxil (TEN), which has basic molecular structure with pKa value of 2.07, commonly formulated in the salt form of fumaric acid, is a prodrug prescribed for the treatment of HIV-1 and HIV-2 infection upon the approval of the US Food and Drug Administration in 2001 [1]. It pertains to a class of antiretroviral drugs also known as nucleoside/nucleotide reverse transcriptase inhibitors (NRTIs). Following its absorption, this drug undergoes diester hydrolysis and subsequent phosphorylation to form tenofovir diphosphate. The resultant tenofovir diphosphate can compete with the natural substrate deoxyadenosine 5´-triphosphate that blocks reverse transcriptase, an enzyme vital to viral DNA growth in HIV-infected people. Emtricitabine (EMT), which has basic molecular structure with pKa value of 2.65, is another NRTI [2] that inhibits HIV-1 reverse transcriptase by competing with deoxycytidine 5'-triphosphate when phosphorylated to emtricitabine 5'-triphosphate. As viral DNA strands are formed by HIV-1 reverse transcriptase incorporating EMT, the blockage of transcribing viral RNA into DNA occurs.
To overcome NRTI resistance, a combination of TEN and EMT was marketed in the USA in 2004 under the brand name Truvada®. This antiretroviral combination is specifically indicated for HIV-1 infected adults and adolescents as well as for pre-exposure prophylaxis to prevent HIV-1 sexual infection in people at high risk [3].
According to the International Pharmacopeia 9th Edition (Edition 2019), the content of TEN and EMT in their combined tablets can be quantified by using RP-HPLC equipped with a C18 column under 19 min-gradient elution. Other types of chromatographic separation were also investigated for the analysis of TEN-EMT mixtures and tablets such as HPTLC [4] and isocratic RP-HPLC [5-10]. Although the dominance of HPLC as a premier analytical tool is undeniable, it still has some perceived limitations such as being costly, using large quantities of organic solvents, time-consuming and arduous in particular for regulated testing, requiring scientific judgment and substantial experience for development of a new method and interpretation of unusual results or troubleshooting a problem [11]. As a result, several UV spectrophotometric studies were also carried out for simultaneous determination of TEN and EMT in their binary and ternary mixtures e.g., peak-to-peak ratio spectrophotometry [12], chemometrics-assisted and derivative spectrophotometry [13,14]. It is worth mentioning that derivative spectrophotometry cannot always guarantee spectral resolution for multicomponent mixtures due to the interference of main compounds’ signal with satellite peaks, undefined zero-crossing points, low-amplitude peaks in high-order derivative spectra. In such a case, it is appropriate to use spectrophotometric measurements together with chemometric tools to enable analysis of components in complex mixtures. Very recently, Dinç and Yazan recently pointed out in a review that continuous wavelet transform (CWT) would outperform derivative transform in resolving the above-mentioned UV spectral problems in binary and ternary mixtures [15].
The aim of this study was to develop and validate CWT-based UV spectrophotometric methods for the simultaneous quantification of TEN and EMT in binary mixtures, and for monitoring in vitro dissolution characteristics of TEN-EMT combined tablets. To the best of our knowledge, there has been no report on such analytical methods yet. For comparison, derivative transform of UV spectra was also used in our study as conventional signal processing algorithm. Consequently, it was concluded that the proposed signal processing tools generate higher intensity in signal amplitude as compared to derivative transform algorithm.
Experimental
Wavelet transform method
Wavelets and their applications have been widely used in chemistry and related fields of science. Wavelet transform (WT) methods in the signal analysis offers several advantageous over the classical frequency decomposition. Wavelets transform has been alternatively used instead of Fourier transform (FT) and Short time Fourier transform (STFT) to overcome the resolution of signals. Wavelet is based on frequency-scale decomposition of signals. A wavelet is defined as a family of functions obtained by scaling parameter and shifting parameter [16-18].
where a is related to the scaling parameter and b is related to the shifting parameter.
Continuous wavelets transform (CWT) of one-dimensional signal or data vector can be given as
or
Where, the superscript * represents the complex conjugate and is the inner product of function f(x) onto the wavelet function Ψa,b(x).
In the practical implementation of continuous wavelet transform methods, it is possible to analyze complex signals using different wavelet families [Haar (haar), Daubechies (db), BiorSplines (bior), reverseBior (rbio), Coiflets (coif), Symlets (sym), Morlet (morl), Mexican Hat (mexh), Meyer (meyr), Dmeyer (dmey), Gaussian (gaus) and Complex Wavelets]. In some cases, different families of wavelets, which have different waveforms with diverse mathematical algorithms, provide opportunities to solve complex signals that cannot be analyzed by traditional signal processing methods. In other words, not all wavelet families may provide an appropriate procedure to decompose raw signal into a subset of components. In such case, a suitable wavelet function would be applied for processing the raw signal data.
The appropriate type of wavelet can be selected from families of wavelets, which have diverse waveforms, to provide desirable signal assay of raw signals. In our case, Daubechies (db), Symlets (sym), Coiflets (coif) and BiorSplines (bior) were found to be suitable families to obtain higher recovery results of experiments [15,19].
Apparatus and software
A double-beam Shimadzu UV-2520 spectrophotometer (Shimadzu, Japan) with 2 nm spectral bandwidth and ± 0.5 nm wavelength accuracy, being connected to a computer loaded with UV Probe 2.32 software was used. The zero-order UV spectral registration was done in the wavelength range of 200 - 320nm with a pair of 1 cm matched quartz cuvettes. Spectral scanning speed was 0.76nm/min and data interval were 0.05 nm. Microsoft EXCEL and Wavelet toolbox in Matlab 2015a software (The MathWorks, Natick, MA, USA) were both used for spectral data processing and statistical calculations. In-vitro dissolution testing was carried out at 37 °C by utilizing a 6-vessel, bathless Distek Evolution 6100 Dissolution System (North Brunswick, Nj, USA). Each vessel contained 900 mL of hydrochloric acid 0.1M as the dissolution medium and stirred with a paddle attached to the shaft set at 50 rpm.
Materials and reagents
Analytical reference standards of tenofovir disoproxil fumarate (≥ 98 %) and emtricitabine (≥ 98 %) were obtained from Merck (Darmstadt, Germany). TRUVADA® film-coated tablet (produced by Gilead Sciences, USA) - was the commercial solid dosage form under study. Each tablet contains 245 mg of TEN (equivalent to 300 mg of tenofovir disoproxil fumarate), 200 mg of EMT, and excipients (for tablet core: lactose monohydrate, croscarmellose sodium, magnesium stearate, microcrystalline cellulose, pregelatinized starch (gluten free); for film-coating: glycerol triacetate, hypromellose, indigo carmine aluminium lake, lactose monohydrate, titanium dioxide).
Standard solutions
Stock solutions of TEN and EMT (100 µg/mL) in hydrochloric acid 0.1 M were freshly prepared in 50 mL volumetric flasks for further dilution with the same solvent to get a concentration set of individual or mixture standard solutions. By using these stock solutions, 5-point calibration curves were constructed and ten laboratory-made synthetic mixture samples (containing both TEN and EMT) were prepared in the range of 4.0-52.0 µg/mL. Throughout the experimental work, all solutions were freshly made at ambient temperature.
Sample solutions
For assay, ten TRUVADA® tablets were accurately weighed, pulverized and thoroughly mixed in a mortar. An accurate mass corresponding to one tablet was then taken and dissolved in a 100 mL calibrated flask with hydrochloric acid 0.1 M after 25 min sonication. This solution was filtered through a 0.20 μm membrane and was further diluted with hydrochloric acid 0.1 M to get the working concentration solution of TEN and EMT. Unless stated otherwise, this procedure was repeated ten times. The dissolution profile of TEN-EMT tablets was monitored using the USP Apparatus II (peddle method). For in vitro dissolution testing, the collection of 3 mL aliquots was done by using an injector with membrane filter (0.20 µm, Millipore) at pre-scheduled intervals for 90 minutes; a corresponding volume of hydrochloric acid 0.1 M kept at 37 °C was added to the dissolution system for replacement of the liquid removed. All samples were appropriately diluted with hydrochloric acid 0.1 M before spectral measurement.
Results and discussion
The zero-order UV spectra of TEN 24.5 µg/mL, EMT 20 µg/mL, a mixture of TEN 24.5 µg/mL and EMT 20 µg/mL, and a corresponding sample were recorded and presented in Fig. 1. The analysis of the binary mixture of the related drugs was not possible by traditional spectrophotometric measurements due to the overlapping spectral bands of TEN and EMT in the same wavelength region (200-330 nm).

Fig. 1 UV absorption spectra of 24.5 µg/mL TEN, 20 µg/mL EMT, the corresponding TEN-EMT mixture and sample in 0.1 M HCl.
In order to solve this problem, new signal processing method based on wavelets were tested for simultaneous quantification and dissolution test of tablets containing TEN and EMT drugs without requiring a preliminary separation step.
Application of CWT methods
In resolving the overlapping UV spectral bands with continuous wavelet transforms, the main challenge is to find out which wavelet family provides desirable results to quantify the drugs of interest in samples. In our case, various wavelet families with different scaling factors were applied to the overlapping spectral bands of TEN and EMT. To do this, the recorded absorbance data vectors were transferred into Microsoft Excel for being subjected to wavelet transform using the Wavelet toolbox in MATLAB. From CWT applications, db6-CWT (a= 576), sym3-CWT (a= 1408), bior1.5-CWT (a=694) and coif5-CWT (a= 1350) were found to be optimal wavelet families to get precise, accurate and reliable results to analyze and to monitor the dissolution profiles of TEN- EMT tablets. The CWT spectra of TEN and EMT, obtained by applying the CWT signal processing methods to the absorbance data vectors were indicated in Fig. 2. It was observed that CWT spectra has much higher intensity in signal amplitude than corresponding derivative spectra, meaning that CWT can enhance the sensitivity of the UV spectrophotometric assay of both drugs in binary mixtures.

Fig. 2 CWT-spectra of EMT and TEN in the concentration range of 4, 16, 28, 40, 52 µg/mL, and sample: (A) db6; (B) sym3; (C) bior1.5; (D) coif5.
For the quantitative estimation and multicomponent dissolution profiles of the related substances, the calibration curves were obtained by regression of the signal intensity on concentration i.e., db6-CWT signals at 245.0 and 260.7 nm, sym3-CWT signals at 241.3 and 278.5 nm, bior1.5- CWT signals at 250.6 and 297.9 nm and coif5-CWT signals at 237.0 and 277.0 nm for TEN and EMT, respectively. The statistical results related to the linear regression analyses for the analyzed active compounds were listed in Table 1. TEN and EMT were determined by means of the computed calibration curves.
Application of derivative spectrophotometry
For comparison, in this study, first derivative spectrophotometry (1DS) was applied to the overlapping UV absorption spectra for the quantification and in-vitro dissolution testing of the TEN-EMT tablets. From the UV absorption spectra of the calibration samples, first derivative spectra of TEN and EMT in the linear working concentration range of 4.0-52.0 µg/mL were computed by using the intervals of ∆λ=10 nm and scaling factor of 10. Similar derivative calculations were subjected to the UV absorption spectra of synthetic binary mixtures, commercial tablet and dissolution samples. Fig. 3 shows the first derivative spectra for the calibration solutions of the analyzed compounds. As can be seen from the first derivative spectra in this figure, the concentration of TEN in the binary mixture was proportional to the values of dA/d at 246.0 nm, which corresponds to a zero-crossing point for EMT). The concentration of EMT in its samples was proportional to the values of dA/d at 300.0 nm, which corresponds to a zero-crossing point for TEN). Calibration curves and their statistical data were given in Table 1. TEN and EMT in their commercial tablets were analyzed by means of the computed calibration equations. In the same way, same calibration curves were also used to plot the dissolution profiles of TEN-EMT tablets.
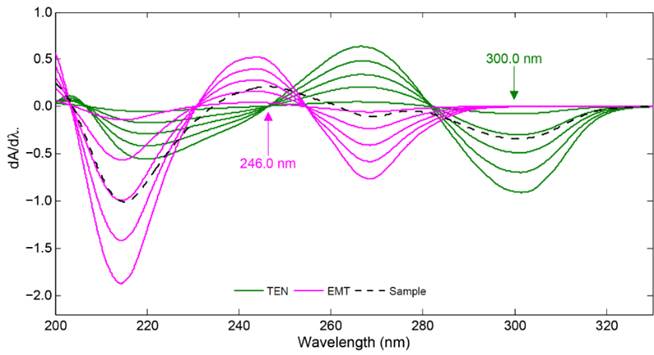
Fig. 3 First derivative spectra of EMT and TEN in the concentration range of 4, 16, 28, 40, 52 µg/mL, and sample.
Table 1 Statistical analysis of the calibration curves for TEN and EMT in the concentration range 4.0-52.0 (µg/mL).
| Compound | TEN | ||||
| Method | db6 | sym3 | bior1.5 | coif5 | 1DS |
| Wavelength (nm) | 245.0 | 241.3 | 250.6 | 237.0 | 246.0 |
| m | 0.1876 | -0.228 | -0.2284 | 0.1721 | 0.0095 |
| n | -0.0385 | -0.337 | -0.0556 | 0.1792 | 0.0022 |
| r | 0.9999 | -1.0000 | -0.9999 | 0.9999 | 0.9999 |
| SE(m) | 8.85x10⁻⁴ | 1.65x10⁻³ | 1.37 x10⁻³ | 1.05 x10⁻³ | 6.26 x10⁻⁵ |
| SE(n) | 2.90x10⁻² | 5.40 x10⁻² | 4.48 x10⁻² | 3.42 x10⁻² | 2.05 x10⁻³ |
| SE(r) | 3.36 x10⁻² | 6.25 x10⁻² | 5.20 x10⁻² | 3.97 x10⁻² | 2.37 x10⁻³ |
| LOD | 3.16 x10⁻² | 4.84 x10⁻² | 4.02 x10⁻² | 4.07 x10⁻² | 4.41 x10⁻² |
| LOQ | 1.05x10⁻¹ | 1.61 x10⁻¹ | 1.34 x10⁻¹ | 1.36 x10⁻¹ | 1.47 x10⁻¹ |
| Compound | EMT | ||||
| Method | db6 | sym3 | bior1.5 | coif5 | 1DS |
| Wavelength (nm) | 260.7 | 278.5 | 297.9 | 277.0 | 300.0 |
| m | 0.1500 | -0.3613 | 0.3064 | 0.2353 | -0.0171 |
| n | 0.0360 | -0.4985 | 0.1410 | 0.2989 | -0.0116 |
| r | 0.9990 | -0.9995 | 0.9997 | 0.9995 | -0.9994 |
| SE(m) | 3.59×10⁻³ | 4.63×10⁻³ | 2.98×10⁻³ | 3.00×10⁻³ | 2.05×10⁻⁴ |
| SE(n) | 1.17×10⁻¹ | 1.52×10⁻¹ | 9.75×10⁻² | 9.83×10⁻² | 6.71×10⁻³ |
| SE(r) | 1.36×10⁻¹ | 1.76×10⁻¹ | 1.13×10⁻¹ | 1.14×10⁻¹ | 7.78×10⁻³ |
| LOD | 1.61×10⁻¹ | 8.61×10⁻² | 6.52×10⁻² | 8.56×10⁻² | 8.06×10⁻² |
| LOQ | 5.36×10⁻¹ | 2.87×10⁻¹ | 2.17×10⁻¹ | 2.85×10⁻¹ | 2.69×10⁻¹ |
m: slope of the regression equation
n: intercept of the regression equation
r: correlation coefficient of the regression equation
SE (m): standard error of the straight-line slope
SE (n): standard error of the straight-line intercept
SE (r): standard error of the correlation coefficient of the regression equation
LOD: limit of detection (µg/mL)
LOQ: limit of quantification (µg/mL)
Analytical validity of the applied methods
In this research paper, the analytical validity of the applied methods, db6-CWT, sym3-CWT, bior1.5-CWT and coif5-CWT and 1DS was performed in terms of range, linearity, accuracy, precision, selectivity, limit of detection (LOD) and limit of quantitation (LOQ) etc. for the quantification of TEN and EMT in tablets. It was reported that the concentration range for both compounds was found to be linear in the range of 4.0-52.0 µg/mL. Then, correlation coefficients higher than 0.9990 by application of db6-CWT, sym3-CWT, bior1.5-CWT and coif5-CWT and 1DS were obtained for the calibration curves of TEN and EMT as indicated in Table 1. In another validation process, the limit of detection (LOD) and the limit of quantitation (LOQ) were computed by using standard deviation and slope values of calibration curves. Their numerical results were also presented in Table 1.
The validity of the proposed algorithms was confirmed by assessing the precision and accuracy of the assay of TEN and EMT in ten synthetic mixture samples. In these studies, percent mean recoveries and their relative standard deviations were computed (Tables 2 and 3). It was concluded that the results of experiments in the application of the proposed signal processing wavelet and derivative methods gave satisfactory accuracy and precision without using a preliminary separation step. CWT methods were proved to be more precise (i.e., lower RSD values for recovery studies) than 1DS method.
Table 2 Results of recovery studies for TEN and EMT in lab-made TEN-EMT binary mixtures.
| % recovery | ||||||||||||
|---|---|---|---|---|---|---|---|---|---|---|---|---|
| TEN | EMT | |||||||||||
| No. | Added (µg/mL) | db6 | sym3 | bior1.5 | coif5 | 1DS | db6 | sym3 | bior1.5 | coif5 | 1DS | |
| TEN | EMT | |||||||||||
| 1 | 4 | 20 | 104.3 | 98.1 | 101.2 | 97.1 | 94.0 | 97.8 | 99.3 | 98.5 | 99.7 | 98.5 |
| 2 | 16 | 20 | 102.6 | 96.9 | 101.7 | 96.2 | 98.9 | 97.8 | 98.7 | 99.9 | 98.9 | 99.9 |
| 3 | 28 | 20 | 100.8 | 97.9 | 100.3 | 97.0 | 98.2 | 99.7 | 99.8 | 98.7 | 97.4 | 98.4 |
| 4 | 40 | 20 | 101.2 | 99.3 | 100.9 | 98.6 | 99.7 | 97.8 | 100.3 | 100.8 | 97.7 | 100.3 |
| 5 | 52 | 20 | 101.5 | 100.2 | 101.1 | 99.7 | 100.2 | 98.3 | 97.5 | 100.3 | 97.7 | 99.6 |
| 6 | 24.5 | 4 | 102.2 | 101.3 | 101.8 | 101.4 | 100.9 | 100.7 | 100.5 | 99.5 | 97.3 | 93.6 |
| 7 | 24.5 | 16 | 101.0 | 96.6 | 100.2 | 95.7 | 98.5 | 101.4 | 99.3 | 103.8 | 101.1 | 96.4 |
| 8 | 24.5 | 28 | 101.1 | 97.7 | 99.5 | 97.0 | 97.1 | 97.3 | 99 | 100 | 97.4 | 99.9 |
| 9 | 24.5 | 40 | 101.4 | 95.9 | 100.2 | 96.7 | 96.0 | 97.2 | 97.7 | 99.6 | 98.7 | 99.3 |
| 10 | 24.5 | 52 | 101.7 | 99.9 | 100.3 | 99.4 | 94.7 | 101.8 | 99.5 | 100.6 | 99.9 | 100.9 |
| Mean | 101.8 | 98.4 | 100.7 | 97.9 | 97.8 | 99 | 99.2 | 100.2 | 98.6 | 98.7 | ||
| SD | 1.0 | 1.7 | 0.8 | 1.8 | 2.3 | 1.8 | 1.0 | 1.5 | 1.3 | 2.2 | ||
Table 3 Results of quantitative determination of TEN and EMT in their combined tablets.
| mg per tablet* | ||||||||||
|---|---|---|---|---|---|---|---|---|---|---|
| TEN | EMT | |||||||||
| No. | db6 | sym3 | bior1.5 | coif5 | DS | db6 | sym3 | bior1.5 | coif5 | DS |
| 1 | 251.0 | 245.9 | 243.5 | 246.6 | 242.2 | 205.3 | 197.3 | 205.2 | 200.5 | 208.3 |
| 2 | 247.1 | 243.7 | 244.7 | 245.0 | 243.6 | 200.3 | 201.4 | 201.6 | 205.0 | 201.4 |
| 3 | 245.7 | 248.1 | 246.6 | 247.7 | 242.3 | 201.8 | 199.0 | 202.6 | 203.3 | 203.2 |
| 4 | 246.3 | 250.8 | 243.5 | 242.9 | 238.2 | 200.2 | 204.0 | 207.8 | 201.0 | 204.1 |
| 5 | 243.9 | 245.0 | 248.6 | 249.1 | 246.1 | 201.9 | 200.1 | 197.3 | 203.3 | 201.6 |
| Mean | 246.8 | 246.7 | 245.4 | 246.2 | 242.5 | 201.9 | 200.4 | 202.9 | 202.6 | 203.7 |
| SD | 2.6 | 2.8 | 2.2 | 2.4 | 2.9 | 2.1 | 2.5 | 3.9 | 1.8 | 2.8 |
*Claimed label: 245 mg of TEN ad 200 mg of EMT per tablet.
In order to show the presence or absence of the effect of tablet’s excipients on the determination of active compounds (TEN and EMT), standard addition samples at three different concentration levels (4, 28 and 52 µg/mL) for both drugs were prepared and analyzed by the proposed analytical methods. Their added recoveries and relative standard deviations for TEN were found to be 100.2 % and 1.81; 98.7 % and 1.29; 100.9 % and 0.49; 97.9 % and 1.56; 97.5 % and 2.25 for db6, sym3, bior1.5, coif5 and 1DS methods, respectively. Similarly, in the analysis of the standard addition samples for EMT, the added recovery and relative standard deviation results were calculated as 99.9 % and 2.35; 99.7 % and 0.77; 102.0 % and 1.55; 98.2 % and 1.50; 98.1 % and 2.48 using db6, sym3, bior1.5, coif5 and 1DS methods, respectively. These results also show the selectivity of the analytical methods proposed.
Analysis of commercial tablets
Four different CWT methods, db6-CWT, sym3-CWT, bior1.5-CWT and coif5-CWT were used for simultaneous quantitation of commercial pharmaceutical tablets containing TEN and EMT. Table 3 displays the assay results when applying these spectrophotometric methods to quantify TEN and EMT in TRUVADA® tablets, showing that our data were precise (RSD < 2 %) and the content of both compounds was about 97.7 ÷ 100.7 % for TEN and 99.5 ÷ 102.8 % for EMT as compared to the label claim. It means that this batch of TRUVADA® tablets satisfies the assay limit set as 90 ÷ 110 % by the International Pharmacopeia 9th Edition Successful results in the quantification of TEN and EMT in commercial pharmaceutical tablets clearly indicate the capability and applicability of our methods.
Statistical evaluation of these assay data indicates that these spectrophotometric methods are equally precise (Bartlett test: x2 calculated < x2 tabulated) and accurate (ANOVA test: F calculated < F tabulated) when statistically tested at the level of significance α = 0.05 (Table 4).
Table 4 Statistical evaluation of UV spectrophotometric assay results by One-way ANOVA and Bartlett tests at the level of significance α = 0.05.
| One-way ANOVA test | ||||
|---|---|---|---|---|
| Source of variation | Compound | Between-groups | Within-groups | Total |
| Sum of squares | TEN | 63.140 | 134.44 | 197.58 |
| EMT | 30.900 | 147.80 | 178.70 | |
| Degree of freedom | 4 | 20 | 24 | |
| Calculated F value | TEN | 2.348 | ||
| EMT | 1.045 | |||
| Tabulated F value | 2.866 | |||
| Bartlett test | ||||
| Degree of freedom | 4 | |||
| Calculated x2 value | TEN | 0.361 | ||
| EMT | 2.645 | |||
| Tabulated x2 value | 9.488 | |||
Dissolution testing of commercial tablets
In this study, the assessment of the applicability of these spectrophotometric methods was also evaluated by monitoring the in vitro dissolution profiles of TEN and EMT from commercial tablets were performed by the proposed db6-CWT, sym3- CWT, bior1.5-CWT and coif5-CWT and 1DS1 approaches.
The UV spectra of the analyzed samples were processed by using the proposed signal processing methods to obtain the quantitative estimation and dissolution rate profiles of TEN and EMT in tablets as shown in Figures 4 and 5. It was reported that 80 % of the TEN and EMT content released within the first five minutes from commercial tablets and it meets the International Pharmacopoeia 9th Edition’s specification for in vitro dissolution testing of TEN-EMT combined tablets (Edition 2019).
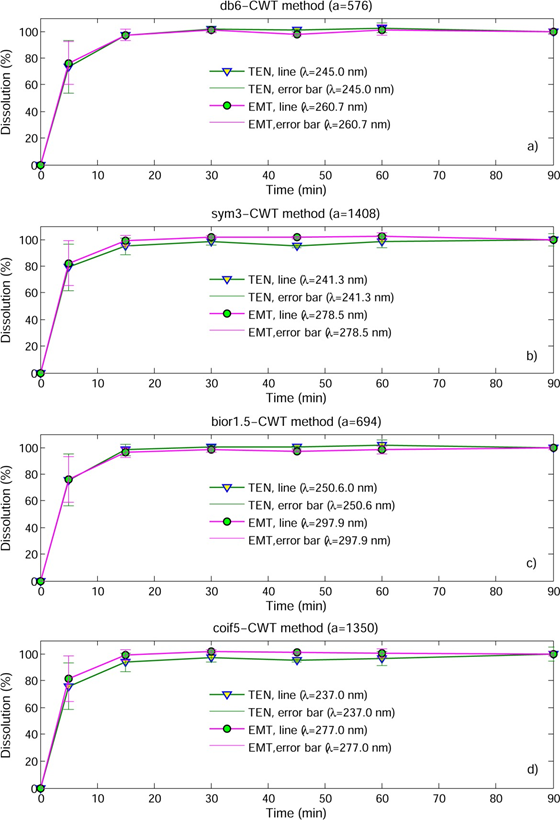
Fig. 4 In vitro dissolution profiles of EMT and TEN in their combined tablet determined by CWT methods (n = 6, mean ( SD).

Conclusion
Despite the strong overlapping UV spectra of the analyzed drugs, new signal analysis approaches, db6-CWT, sym3-CWT, bior1.5-CWT and coif5-CWT were successfully applied to the quantitation and in-vitro dissolution testing of TEN and EMT in commercial tablets. For a comparison with the wavelet analysis results, the conventional first derivative spectrophotometric technique was used for the analysis and dissolution test of commercial tablets containing the related drug substances. Interestingly, the CWT signal processing methods were better than the derivative method in terms of precision (i.e., slightly lower RSD values) and sensitivity (i.e., much higher intensity in signal amplitude). Another advantage of wavelets was that ability to solve complex signals using many wavelet families to get alternative signal waveforms, this is the superiority of continuous wavelet transform methods over classical differentiation spectrophotometry using first order to fourth order derivative of spectra.
This research paper indicates that the CWT methods have higher potential power and rich alternatives for the resolution of overlapping UV spectra for the analysis and in-vitro dissolution testing of TEN-EMT tablets compared to conventional spectral analysis. Wavelet methods give four different resolution ways for the problem while conventional derivative spectrophotometry provides only one solution for the same problem. This is advantage of the wavelet approaches over conventional derivative method. Finally, we successfully applied the proposed db6-CWT, sym3-CWT, bior1.5-CWT, coif5-CWT and 1DS approaches to the quantification and dissolution testing of TEN and EMT in tablets.

