


 nueva página del texto (beta)
 Inglés (pdf)
 Artículo en XML
 Referencias del artículo
 Enviar artículo por email
 Citado por SciELO
  Similares en
SciELO
Similares en
SciELO 
 Permalink
Introduction
Tecoma genus is one of the medicinally-valuable members in Bignoniaceae family, embracing fourteen species of shrubs and small trees, of which twelve are native to America and two to Africa. This genus has a noticeably wide geographical distribution with Tecoma capensis Lindl. being the most widely cultivated species [1]. Tecoma leaves were traditionally used by people in Latin America for diabetes management [2]. Later on, several Tecoma species were reported to possess a wide variety of pharmacological actions, viz. anti-inflammatory, antipyretic, analgesic, antimicrobial, antioxidant, hepatoprotective and cytotoxic actions [3].
The safety of using traditional herbal medicines has recently received a considerable attention with many issues raised by herbal practitioners as the surge for precise authentication and efficient delimitation of either morphologically-similar or taxonomically-relevant plant species. Accordingly, the botanical and chemical characterization as well as genetic profiling is considered essential procedure for the rigorous plant identification and authentication [4].
Taxonomic examination of Tecoma genus is regarded as a cumbersome task due to the existence of poorly demarcated species and hybrids that possess complex overlapping vegetative characters [5]. Besides, the African species are treated as members of Tecomaria, due to the lack of supporting morphological, phytochemical or molecular evidence [6].
Tecoma capensis (Thunb.) Lindl., an ornamental plant known as ‘Cape-honey suckle’, is a climbing shrub showing brightly coloured corolla and scented flowers. The leaves were traditionally used to treat pneumonia, enteritis, diarrhea and reported to exhibit antipyretic, antimicrobial, antifungal and antioxidant actions [7]. There are also two species of another closely related-genus growing in Egypt, namely Campsis viz. Campsis grandiflora syn. T. grandiflora and Campsis radicans syn. T. radicans that also belong to Bignoniaceae family and are sometimes classified as Tecoma. The trumpet creeper “T. radicans (L.) Juss.”, a woody liana with aerial roots, large pinnate leaves, and bright-orange or scarlet flower, is cultivated in the Crimea and other southern regions of former Union of Soviet Socialist Republics (USSR), in Middle Asia and the Caucasus region. The Chinese trumpet creeper “T. grandiflora Loisel.” is cultivated less frequently than the trumpet creeper “T. radicans (L.) Juss.” [8].
Interspecific hybridization in Tecoma was reported to have been conducted for over a century. Tecoma × smithii Hort. is an example of interspecific cross between T. velutina (syn. T. stans var. velutina (A. DC. Fabris) × T. capensis. Tecoma ×smithii Will. Watson is a hybrid plant between the South African T. capensis and the central Mexican T. stans (var. velutina DC.) and combines the morphological features of both plants [9]. Hybrids were traditionally identified morphologically which is in many cases proved to be difficult due to their overlapping parental morphological features [10]. This warrants a more thorough investigation to be carried out to explore chemical, botanical and genetic diversity among the different Tecoma species, cultivars and hybrids. Further, the analysis of the genetic makeup of the plants, i.e. DNA fingerprinting, provides a complementary tool to morphological and phytochemical characterization for the sake of authentication and quality control of different medicinal plant species and even varieties within the same species because it is based on the unique complement of nucleotide sequences. This genetic profile is independent of the plant part, age or agronomic conditions, such as temperature, soil, humidity or rainfall, and thus can facilitate identification at any developmental stage of the plants [11].
Reviewing the literature, there was scarce data available about the botanical characterization of Tecoma genus and no previous studies reported for the macro-and micro-morphological characters and genetic analysis of four varieties of Tecoma capensis Lindl. i.e. harmony, red, pink and yellow, and T. radicans (L.) Juss and T. grandiflora Loisel. The morphological characterization and DNA profiling was achieved only for Tecoma ×smithii W. Watson[12].
Multivariate analysis is extensively employed nowadays for processing data sets obtained from different analytical and genetic profiling techniques. The similarity/heterogeneity among multidimensional datasets can be evaluated using two types of pattern recognition methods viz. unsupervised and supervised [13, 14]. Unsupervised pattern recognition methods i.e. principle component analysis (PCA) and hierarchical clustering analysis (HCA) are initially used to explore patterns/trends in chemical or biological data matrices, however, supervised classification methods viz. orthogonal projections to latent structures discriminant analysis (OPLS-DA) are commonly employed to extract information about the discriminatory variables in data matrix associated with predefined sample groups[15,16].
Therefore, we aimed in the current study to propose micro-morphometric discriminatory features, and the phytochemical and molecular descriptors of the eight studied Tecoma plants, viz. Tecoma capensis Lindl. and its four varieties (harmony, red, pink and yellow), and T. radicans (L.) Juss, T. grandiflora Loisel. and one hybrid plant i.e. Tecoma ×smithii W. Watson, aided by pattern recognition analysis.
Experimental
Plant material
Fresh samples of the eight Tecoma plants cultivated in Egypt were collected during the years 2016 and 2017 (as listed in Supplementary Table S1 along with their geographical location and voucher specimen codes). They were identified by Professor Selim Zidan, head of Botany Department, Faculty of Science, Alexandria University, Egypt, and Mrs. Therese Labib, Mazhar Botanical Garden and Mr. Mohamed El- Gebaly, Plant Taxonomists in El-Orman Botanical Garden, Egypt.
Botanical characterization
Samples of the leaves and petioles of the eight Tecoma species and cultivars were separated and examined either fresh or after being stored in ethanol 70 %. The aerial parts of the plants under study were boiled with KOH for microscopical examination of the isolated elements. Photographs of macro and micro-morphological features were captured using Nikon D-3200 professional digital camera and Leica microscope model EMUC6 light microscope, respectively.
HPLC analysis of flavonoids and phenolic acids
HPLC analysis was performed on SHIMADZU (Japan) model LC20 AT and separation was achieved by a reverse-phase column (150 x 4.6 mm, C18 intersil ODS) and online UV-Diode Array Detector (UV-DAD) at 300 nm. The apparatus was equipped with auto-sampling inject. The mobile phase consisted of water (A) and acetonitrile (B) each containing 2 % acetic acid. Samples were eluted with the following gradient: 90 % A from 0 to 27 min, from 90 to 60 % A in 28 min, 60 % A for 5 min, from 60 to 56 % A in 2 min, 56 % A for 8 min, from 56 to 90 % A in 1 min and 4 min 90 % A to re-establish the initial conditions, before the injection of another sample. All gradients were linear. The flow rate was 1 mL/min and the injection volume was 5 µL. Column temperature was maintained at 20 °C.
Qualitative fingerprint analysis
The methanolic extracts of eight Tecoma species and cultivars were weighed and dissolved in 10 ml HPLC grade methanol: water (1:1) mixture. A 5 µL volume of each extract was injected into the chromatographic system.
Identification and calibration
The identification of the peaks was performed by comparison of their retention times and UV spectra with six reference standards i.e. gallic acid, chlorogenic acid, rutin, sinapic acid, quercetrin and catechin (Sigma-Aldrich, St. Louis, MO, USA) which were dissolved in HPLC grade methanol (1 µg/ml) and injected into the chromatographic system. The peak areas of the selected standards were calculated in each plant extract.
Computation of the concentration of each standard in the eight samples was done through constructing a calibration curve of concentration i.e. 0.05, 0.1, 0.2, 0.4 and 0.5 µg/ml, versus detector response (peak area) using different concentrations of the standard solutions as described by [17].
Multivariate analysis
The micro-morphometric and phytochemical variabilities among the studied plants were explored by two unsupervised pattern recognition analyses i.e. hierarchical cluster analysis (HCA) and principal component analysis (PCA). Species-specific features were then revealed using supervised recognition analysis i.e. orthogonal projections to latent structures discriminant analysis (OPLS-DA) using the program SIMCA-P Version 13.0 (Umetrics, Umeå, Sweden).
DNA extraction and random amplified polymorphic DNA (RAPD) analysis
The fresh aerial parts of the eight Tecoma plants were air-dried, and then ground to fine powder under liquid nitrogen. DNA was extracted from 10 g of leaf tissue using the DNA extraction method described by[18]. Ten primers (Operon® Technologies Inc. Almeda, California, USA), were used for Random Amplified Polymorphic DNA (RAPD) analysis, with the following sequences: OP-A07: 5´ GAA AGG GGT G 3`, OP-A10: 5` TTC GAG CCA G 3`, OP-B02: 5´ TCG GGG ATA G 3`, OP-B09: 5´ TGG GGG ACT C 3`, OP-C04: 5´ CCG CAT CTA C 3`, OP-C09: 5` CTC ACC GTC C 3`, OP-C12: 5` AAA GCT GCG G 3`, OP-K2: 5` GTG AGG CGT C 3`, OP-K3: 5`CCC TAC CGA C 3`, OP-O6: 5` CCA CGG GAA G 3`.
Polymerase Chain Reaction (PCR) was performed according to[18]. The DNA amplifications were performed in an automated thermal cycle (Model Techno 512). Each PCR reaction was carried out using the following thermal cycling conditions: one cycle of 5 min initial strand separation at 94 °C and for 40 cycles each, 1 min at 94 °C for denaturation, 1 min primer annealing at 36 °C, a 7 min primer elongation at 72 °C, followed by one cycle of final primer extension at 72 °C for 10 min.
Gel electrophoresis and staining
Amplified DNA fragments were resolved on 1.5 % agarose gel plate by electrophoresis. 15 µl of each PCR product was loaded onto the wells of the gel plates. The RAPD pattern was visualized by staining the gel with ethidium bromide (5 µl) then photographed under UV light using a gel documentation system (G:box). RAPD markers were scored as DNA fragments present in some lanes and absent in others. The bands were sized and matched directly on the photographic films and the presence or absence of bands was recorded. Similarity matrices were established using Gel works ID advanced software UVP-England Program. The relationships among genotypes as revealed by dendrograms were analyzed using SPSS program (Version 10).Amplified DNA fragments were resolved on 1.5 % agarose gel plate by electrophoresis. 15 µl of each PCR product was loaded onto the wells of the gel plates. The RAPD pattern was visualized by staining the gel with ethidium bromide (5 µl) then photographed under UV light using a gel documentation system (G:box). RAPD markers were scored as DNA fragments present in some lanes and absent in others. The bands were sized and matched directly on the photographic films and the presence or absence of bands was recorded. Similarity matrices were established using Gel works ID advanced software UVP-England Program. The relationships among genotypes as revealed by dendrograms were analyzed using SPSS program (Version 10).
Results and discussion
Examination of the micro-morphometric features of Tecoma spp.
Microscopical examination of the photographed micro-morphometric features of the eight Tecoma plants (Fig. 1) revealed some distinctive features that can be outlined as follows.
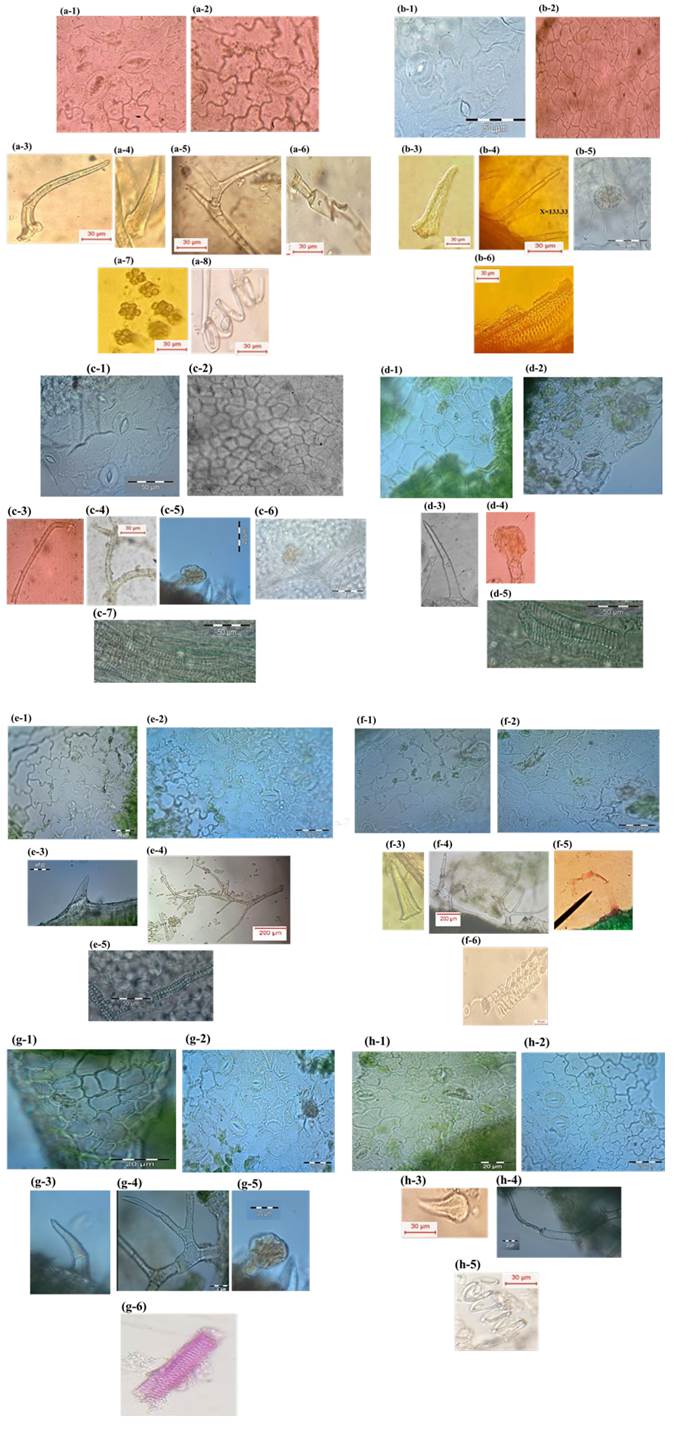
Fig. 1 Microscopical examination of the powdered Tecoma plants: (a) T. capensis Lindl. a-1 adaxial epidermis (X=280). a-2 abaxial epidermis (X=300). a-3 bent trichome (X=133.33). a-4 unicellular trichome (X=66.67). a-5 branched trichome (X=66.67). a-6 collapsed trichome (X=175). a-7 calcium oxalate clusters. a-8 spiral vessels (X=100), (b) T. grandiflora Loisel. b-1 adaxial epidermis (X= 315). b-2 abaxial epidermis (X=420). b-3 unicellular trichome (X=137). b-4 multicellular trichome (X=90). b-5 cicatrices (X=170). b-6 pitted vessels (X=230), (c) T. radicans (L.) Juss. c-1 adaxial epidermis (X=330). c-2 abaxial epidermis (X=600). c-3 multicellular trichome (X=70). c-4 branched trichome (X=80). c-5 glandular trichome (X=180). c-6 cicatrices (X=200). c-7 vessels (X=310), (d) Tecoma x smithii Wil. Wats. d-1 adaxial epidermis (X= 250). d-2 abaxial epidermis (X=420). d-3 unicellular trichome (X=193). d-4 glandular trichome (X=150). d-5 vessels (X=250), (e) T. capensis var. pink. e-1 adaxial epidermis (X=360). e-2 abaxial epidermis (X=270). e-3 unicellular trichome (X=175). e-4 branched trichome (X= 10). e-5 vessels. (X=50), (f) T. capensis var. yellow. f-1 adaxial epidermis (X= 250). f-2 abaxial epidermis (X=330). f-3 unicellular trichome (X=193). f-4 branched trichome (X=20). f-5 collapsed trichome (X=110). f-6 spiral xylem vessel (X=210), (g) T. capensis var. harmony g-1 adaxial epidermis (X=320). g-2 abaxial epidermis (X=270). g-3 unicellular trichome (X=50). g-4 branched trichome (X=140). g-5 glandular trichome (X-120). g-6 pitted vessels (X=80), (h) T. capensis var. red. h-1 adaxial epidermis (X=290). h-2 abaxial epidermis (X=370) h-3 unicellular trichome (X=50). h-4 collapsed trichome (X=97). h-5 helical vessels (X=100).
Both adaxial and abaxial epidermis showed anomocytic stomata, with four or five subsidiary cells. Non-glandular unicellular trichomes are present in all the studied plants. Branched non glandular multicellular trichomes are present in T. capensis Lindl. and its four cultivars as well as T. radicans (L.) Juss. Collapsed non-glandular multicellular trichomes are found in T. capensis var. yellow, T. capensis var. red and T. capensis Lindl. Bent non-glandular trichomes are found only in T. capensis Lindl. and T. capensis var. red. Glandular trichomes with unicellular head and stalk are found in T. capensis var. pink, T. capensis var. harmony, T. radicans (L.) Juss. and Tecoma x smithii W. Watson.
HPLC fingerprinting of flavonoids and phenolic acids in Tecoma spp.
Quantitative results (Table S2) revealed the presence of rutin and chlorogenic acid in all Tecoma species with the highest concentrations in Tecoma x smithii W. Watson (0.192 mg/g of chlorogenic acid and 0.828 mg/g of rutin). Phenolic acids were prevalent in all samples such as sinapic acid which was found in all species except Tecoma x smithii W. Watson. While, caffeic acid was absent in all species. Gallic acid was only found in Tecoma x smithii W. Watson. with a content of 0.28 mg/g. Among flavonoids, quercetrin was more abundant in T. capensis Lindl. and its four cultivars.
Multivariate analysis of micro-morphometric features of Tecoma spp.
For better revealing the discriminatory micro-morphometric features of the studied Tecoma plants, the measurements (length and width) of the isolated key elements viz. adaxial and abaxial epidermal cells, stomata, different types of trichomes (non-glandular unicellular, non-glandular multicellular, branched, collapsed non glandular, glandular and bent non glandular trichomes) were initially subjected to two unsupervised pattern recognition methods i.e. HCA and PCA.
A PCA algorithm was employed for dimensionality reduction, revealing the proximity and diversity regarding the micro-morphometric features among the eight studied plants. A PCA model (Fig. 2) was established and resulted in two orthogonal PCs, explaining 75.4 % of the total variability, i.e. PC1 accounting for 49.8% of the total morphological variability versus 25.6 % for PC2. The red and yellow varieties of T. capensis were grouped together in the right upper corner apart from the other two varieties i.e. harmony and pink being grouped in the left lower corner of the PCA score plot (Fig. 2(b)). This can be attributed to the similarity in micro-morphometric features among the members in each cluster, hence the botanical characters failed to differentiate between the closely related varieties of T. capensis Lindl.

Fig. 2 Micro-morphometric features-based unsupervised recognition analysis (a) Hierarchical clustering (HCA) plot. (b) PCA score plot of PC1 vs. PC2 scores. (c) Loading plot for PC1 & PC2 contributing variables, i.e. microscopical measurements of the isolated key elements of the powdered leaves of the 8 studied Tecoma plants, with the explained variance of principal component 1 (PC1) = 49.8 % and PC2 = 25.6 %.
The most discriminatory variables i.e. the microscopical elements, contributed for the observed sample segregation along PC1 were revealed from the PCA loading plot (Fig. 2(c)) as being the length of collapsed non-glandular trichomes and branched trichomes (having positive PC1 values) and the length and width of adaxial and abaxial epidermal cells (having negative PC1 values). However, both the length and width of glandular trichomes were the most differentiating variables along PC2.
The dimensions of the most discriminatory microscopical elements, as identified by PCA, were then subjected to one-way ANOVA analysis, shown in Table 1, to determine significant differences among the studied Tecoma plants. Length of the trichomes, i.e. branched, glandular and collapsed non glandular, exhibited the most significant variabilities among the studied plants at P ≤ 0.05. The powder of Tecoma ×smithii W. Watson and T. capensis var. pink contained the largest glandular trichomes as compared to the other plants at significance level ≤ 0.05. Among the four T. capensis cultivars, T. capensis var. harmony possessed abaxial epidermal cells which are significantly small in width and length as compared to the other three T. capensis varieties at P ≤ 0.05. T. capensis var. red possessed the longest collapsed non glandular and branched trichomes at P ≤ 0.05.
The HCA derived dendrogram (Fig. 2(a)) displayed two main clusters: cluster “I”, encompassed T. capensis Lindl. together with its four cultivars as well as the trumpet creeper “T. radicans (L.) Juss.”, while cluster “II” included the hybrid Tecoma species “Tecoma × smithii W. Watson” and the Chinese trumpet creeper “T. grandiflora Loisel”.
Multivariate analysis of HPLC fingerprints of flavonoids and phenolic acids in Tecoma spp.
The normalized areas of the HPLC peaks detected in all the studied Tecoma plants were subjected initially to PCA analysis to explore their compositional variabilities. The PCA score plot (Fig. 3(a)) showed a clear separation of Tecoma×smithii W. Watson from T. grandiflora Loisel. and T. radicans (L.) Juss. which were distributed to the left of the plot. However, T. capensis Lindl. and its four varieties are closely clustered to one another at the right side of PC1, which accounted for 44.5 % of the explained variance. The most influential phytochemicals for this separation were quercetin, catechin and gallic acid as implied by their high factor loadings regarding PC1 (Fig. 3(b)).

Fig. 3 HPLC fingerprints-based unsupervised recognition analysis (a) PCA score plot of PC1 vs. PC2 scores. (b) Loading plot for PC1 & PC2 contributing variables, i.e. content of phenolic metabolites, i.e. gallic acid, chlorogenic acid, rutin, sinapic acid, quercetrin and catechin, of the 8 studied Tecoma plants, with the explained variance of principal component 1 (PC1) = 44.5 % and PC2 = 35.7 %. (c) Hierarchical clustering (HCA) plot.
The undecoded similarities between the different samples were then worked out by HCA resulting in dendrogram (Fig. 3(c)), which exhibited a similar clustering pattern as shown in PCA score plot, sorting T. capensis Lindle. and its four varieties in one big cluster (I), whereas Tecoma×smithii W. Watson samples have been contained in one cluster closely located to T. radicans (L.) Juss. and T. grandiflora Loisel. in cluster “II”.
The HPLC fingerprints of Tecoma sp. (excluding the hybrid plant “Tecoma×smithii W. Watson”) were then modelled against one another in order to reveal the species-specific phytochemicals. OPLS-DA model (Fig. 4) was established with good performance parameters possessing goodness of model fit “R2” value of 0.908 and predicative power “Q2” value of 0.738. A biplot simultaneously showing the relationship among scores and loading (expressed using correlation scaling) revealed gallic acid, catechin and chlorogenic acid to be the most abundant in T. radicans (L.) Juss., T. grandiflora Loisel., T. capensis var. yellow, respectively. Sinapic acid was found to be enriched in T capensis Lindl. and its varieties i.e. pink, red and harmony.
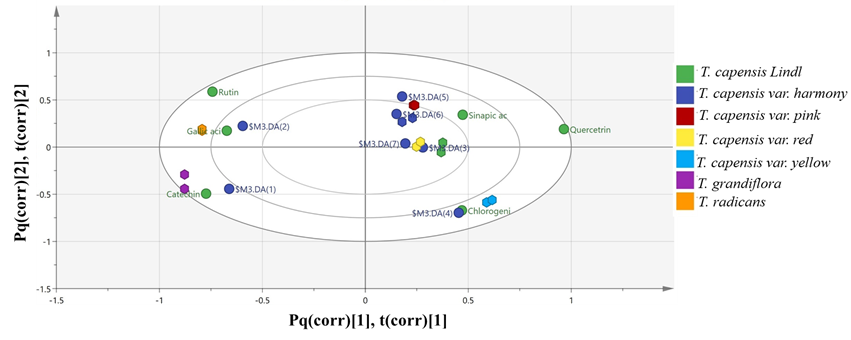
Fig. 4 OPLS-DA modeling of HPLC fingerprints of Tecoma sp. against one another (excluding T. smithii.) Biplot simultaneously showing the relationship among scores and loading (expressed using correlation scaling). Cut-off values of P<0.05 were used.
This model was more competent in discriminating one variety, i.e. yellow, of the T. capensis Lindl. from the other three i.e. pink, red and harmony., which could be better differentiated by analyzing their genetic make-up.
Genetic fingerprinting
The extracted DNA of the eight plants was amplified by RAPD technique using ten decamer primers to detect their genetic relatedness. Each of the oligonucleotide primers successfully resulted in the amplification of a genome-specific fingerprint of DNA fragments, and hence enabled recording the interspecific diversity among the studied Tecoma plants. The obtained photographs of RAPD-PCR as detected by gel electrophoresis are shown in Fig. 5(a).

Fig. 5 (a) RAPD electrophoretic profiles of the eight Tecoma species and cultivars (Lane1: Tecoma capensis Lindl.; Lane2: T. capensis var. Yellow; Lane3: T. capensis var. harmony; Lane4: T. capensis var. pink; Lane5: T. capensis var red; Lane6: T. grandiflora Loisel.; Lane7: T. radicans (L.) Juss.; Lane8: Tecoma ×smithii W. Watson., M: Marker) using ten primers (OP-A7, OP-A10, OP-B2, OP-B9, OP-C4, OP-C9, OP-C12, OP-K2, OP-K3 and OP-O6). (b) DNA markers data-derived dendrogram of the eight Tecoma species and cultivars (1-8) using average linkage (between groups) based on RAPD data.
The primers “OP-B02, OP-C04 and OP-K2” were found to be the most effective oligonucleotide primers in generating polymorphic bands in the eight Tecoma species as revealed by the RAPD results summarized in Table 2. Further, the three oligonucleotide primers i.e. OP-C04, OP-C12 and OP-K2 were competent in generating unique bands.
Table 2 The total number of RAPD bands, distribution of unique and polymorphic bands generated by each primer in the genetic profiling analysis of eight Tecoma plants as depicted in Fig.5(a).
| Primer | No. of bands | Monomorphic bands | Polymorphic bands | Unique Bands | Polymorphic percentage |
| OP-A07 | 6 | 3 | 3 | - | 50% |
| OP-A10 | 7 | 4 | 3 | - | 42.8% |
| OP-B02 | 5 | 1 | 4 | - | 80 % |
| OP-B09 | 3 | 1 | 2 | - | 66.6 % |
| OP-C04 | 9 | 3 | 6 | 1 | 66.6% |
| OP-C09 | 3 | 1 | 2 | - | 66.6 % |
| OP-C12 | 7 | 4 | 3 | 1 | 42.8% |
| OP-K2 | 7 | 3 | 4 | 2 | 57.1 % |
| OP-K3 | 5 | 2 | 3 | - | 60 % |
| OP-O06 | 5 | 2 | 3 | - | 60 % |
| Total | 57 | 24 | 33 | 4 | 59.96 % |
The OP-B02 primer produced the highest percentage of polymorphism recording 80 % polymorphism and resulted in 4 polymorphic bands, followed by the OP-C04 primer, which recorded 66.6 % polymorphism, and produced 10 bands, 6 of them were polymorphic bands and 1 unique band. Two oligonucleotide primers “OP-B02 and OP-C04” can be efficiently employed in discriminating between the eight Tecoma plants under study depending on their high level of polymorphism.
Multivariate analysis of RAPD-PCR derived genetic fingerprints of Tecoma spp.
The dendrogram derived from RAPD-PCR molecular data (Fig. 5(b)) revealed a high degree of genetic similarity between the three T. capensis cultivars, viz. T. capensis var. yellow, red and pink, indicating their genetic relatedness. The genetic fingerprint of T. grandiflora is found to possess more variable characteristics than the three previously mentioned T. capensis Lindle. plants. The plants “T. radicans (L.) Juss., Tecoma×smithii W. Watson, T. capensis. and T. capensis var. harmony” were observed to be genetically related to a lesser extent.
It is worth noting that the RAPD-PCR derived dendrogram (Fig. 5(b)) showed a different sample clustering than the micro-morphometric features-based clustering pattern (Fig. 2). Such discrepancy in clustering results could be ascribed to the adaptation behavior towards biotic stress and abiotic stress, variable agronomic conditions that indirectly might affect the plant physiological and morphological characteristics. However, the genetic makeup of the plants remains to be more reliable because it takes generations for the genetic makeup to be affected [19].
Conclusion
The current study presented, for the first time, a comparative assessment of micro morphometric features of the eight studied Tecoma plants. Unsupervised pattern recognition tools, i.e., HCA and PCA, were employed based on the measured micro-morphometric features of the powdered leaves of the plants, revealing that length of the trichomes, i.e., branched, glandular and collapsed non-glandular, are the most significant discriminatory microscopical elements among the eight Tecoma plants at P ≤ 0.05.
However, the most discriminatory genetic markers that can be employed for the authentication and differentiation between the studied plants were observed to be three RAPD oligonucleotide primers, i.e., OP-B02, OP-C04 and OP-K2, due to their highest polymorphism percentage (ca. 80, 66.6 and 57.1 %, respectively) as revealed from the genetic fingerprinting analysis. However, RAPD-PCR derived dendrogram produced a diverse classification output as compared to HCA based on micro-morphological features, with the genetic parameters being more reliable owing to genetic makeup stability other than the morphological changes that might be induced by plant adaptation.
To the best of our knowledge, this is the first report for the comparative morphometric, chemical and genetic profiling analysis to be performed on the eight Tecoma species and cultivars under study. The study also presents a new approach employing two pattern recognition methods which proved to be more competent and smarter in finding out the differential micromorphometric features among the eight Tecoma plants. Such approach can be applied over a wider range of plant species/cultivars, than our collection of Tecoma plants cultivated in Egypt, with a capacity of incorporating more variables in conducting the comparative analysis with merits of saving more time and efforts than relying only on visual traditional methods.

