


 nueva página del texto (beta)
 Inglés (pdf)
 Artículo en XML
 Referencias del artículo
 Enviar artículo por email
 Citado por SciELO
  Similares en
SciELO
Similares en
SciELO 
 Permalink
Introduction
Due to their good mechanical properties and low cost, steels and its alloys are materials that are widely used in industry. Their applications extend from buildings, to cans of food, including electronic compounds and hulls of certain ships. Cutting tools and commonly machined parts are also and for the most part made of steel alloys. The major disadvantage of steel alloys is that they react aggressively in acidic solutions. Acid solutions are conventionally employed for removal of unwanted scale and rust in many industrial systems. Hydrochloric acid is one of the most widely used agents in the industry. This acid causes the degradation of metals, either by chemical or electrochemical reactions. For well understanding, organic inhibitors constitute an original means of combating corrosion of metals in aggressive media. These compounds are adsorbed on the metal surface and block the active sites, reducing the corrosion rate considerably. Compounds containing unsaturated bonds and / or polar atoms like oxygen (O), nitrogen (N), sulfur (S), phosphor (P) and aromatic rings in their structures are often good inhibitors corrosion of metals and in particular of steel in an acidic solution. Most of well-known corrosion inhibitors are synthetic [1-3]. The action mode of these compounds has been the subject of several works and research [4-6]. Regardless their good inhibition efficiency their utilization is restricted because of their synthesis compounds are very expensive, non-biodegradable and harmful for human beings and the environment. To overcome these inconveniences, a recent research concentrates on the corrosion inhibition properties, and is increasingly directed towards the development of non-toxic, non-polluting and stable organic molecules.
In terms of protection, the use of products of natural origin that are biodegradable and less expensive is essential. Plant extracts are generally obtained by simple extraction methods and exhibit good inhibitory properties in acidic and alkaline environment [7-10].
During the last decade, there have been several scientific works and researches regarding the use of plant extracts as ecological inhibitors. Kaur et al. [11] studied the applications of new natural and eco-friendly corrosion inhibitors on steel in acidic medium. In Ref [12], the authors proposed Syzygium cuminileaf extract as an eco-friendly corrosion inhibitor for carbon steel in acidic medium. In another intriguing research study, the authors explored the effect of Ceratonia SiliquaL seeds extract as eco-friendly corrosion inhibitor for carbon steel in 1 M HCl [13].
In this study, we have proposed as a possible contribution in this area of science, the Ephedra major as a green inhibitor. This plant is extracted from natural resources with the aim of being used to prevent the harmful aggressions of the corrosion of metals and alloys without affecting the ecosystem of the environment.
Although Ephedra major has been implicated in other areas, there is no study investigating the corrosion inhibition of a Butanolic extract of Ephedra major on the corrosion inhibition of steel in acidic media. Therefore, this investigation describes for the first time the performance of a Butanolic extract of Ephedra major on mild steel corrosion in 1M HCl using weight loss measurements, potentiodynamic polarization, electrochemical impedance spectroscopy (EIS) , Fourier transform infrared spectroscopy (FT-IR) and scanning electron microscopy (SEM) methods.
Mathematical modeling has proven to be an effective and useful tool to reduce the time and costs of experiments. Recently, some scientists have been providing research contributions to the development and application of new mathematical and statistical models to support the experimental work. As in Ref. [14], where the authors provided a mathematical linear model describing the inhibitory effectiveness of phenolic compounds derived fromEchium italicumL. Khadom et al. [15] developed a suitable linear statistical model to approximate the corrosion inhibitory efficiency ofCitrus Aurantiumleaf extract, at quantum level.
In this prospect, the second part of this study was devoted to the development of two mathematical models based on linear and quadratic regression. The models were suggested to investigate effect concentration and temperature upon inhibition efficiency. Rather good results were obtained using these models; however, the polynomial model gives a better approximation of the evolution of the inhibition efficiency as a function of the temperature and the concentration of the inhibitor.
Experimental
Electrolyte Medium
The aggressive solutions were 1 M HCl prepared by dilution of 37 % w/w HCl (Merck) using double distilled water. All tests were performed in aerated medium at different temperatures 20 °C, 30 °C, 40 °C, 50 °C and 60 °C.
Plant extracts
Ephedra major is a plant whose species are widespread in countries and regions of the world characterized by temperate climates. Passing through North Africa, southwest and central Asia, China and southern Europe to North America, most ephedra species grow in coastal regions and in sandy soils exposed to direct sunlight. In this study, the plant was collected in the region of Bejaia located on the Algerian coast. Ephedra major leaves and stems extracts were collected, shade dried, this dry matter was cut into small parts and immersed in a hydroalcoholic solution (methanol/water, 7/3, V/V) for 24 h. Once the mixture has been filtered, the filtrate is immediately evaporated to dryness. Then boiled water is added to the acquired residue, everything is stored at room temperature. After overnight, the mixture is filtered by the use of ordinary filter paper and subjected to liquid-liquid extraction using several solvents separated in sequence of increasing polarity starting with methylene dichloride, ethyl acetate and n-butanol. At the end, the organic phase was collected for each solvent and the solutions obtained were evaporated to dryness by a rotary evaporator (Model RE52A, China, max capacity 2 L, speed range 0-150 rpm) in order to obtain the extracts of the plant.
Methods
Weight loss measurements
Gravimetric experiments were conducted in a glass vessel. 32CrMoV5 mild steel of with a composition (wt %): C 0.33 %, Cr 1.25 %, Mo 1.2%, Mn 0.9 %, Ni 0.75 %, V 0.3 %, Al 0,2 % and Fe balance, was used in this investigation. Specimens of dimension 1×1×1 cm were prepared and abraded successively with different grades of emery papers, washed with distilled water, cleaned with acetone, and dried at room temperature. After being weighed accurately with high sensitivity balance, the specimens were immersed in 100 mL 1 M HCl with and without various concentrations of the extract (200,400, 600 and 800 ppm) at different temperatures (20-60 °C) in aerated condition. After 5 h, three test pieces were taken out of the test solution, washed, dried, and weighed again. To confirm the reproducibility of the results, all tests were repeated three times.
Electrochemical measurements
The electrochemical measurements were conducted on a Voltalab-PGZ 301 potentiostat controlled by a computer using Voltamaster 4 software. All the electrochemical setups were carried out in a three-electrode cell, open to the atmosphere. The mild steel as the working electrode (WE), saturated calomel electrode: Hg/Hg2Cl2/KClsat (SCE) as reference electrode (RE) and platinum electrode as counter electrode (CE). The working electrode was protected by the epoxy resin leaving a working surface equal to 0.5 cm2.
Potentiodynamic polarization
The extrapolation of cathodic and anodic Tafel lines was carried out in a potential range starting from a cathodic potential of − 250 mV to an anodic potential of + 250 mV relative to the OCP at scan rate of 0.5 mV s-1. To obtain the corrosion current densities (Icorr), the linear segments of Tafel anodic and cathodic curves were extrapolated to the corrosion potential. Before starting the experiments, the working electrode was immersed in the test solution for 60 min to reach a state of stability. Electrochemical measurements were performed after open circuit potential (OCP) was measured.
Electrochemical impedance spectroscopy
Measurements by EIS are carried out at the OCP, over a frequency range from 100 kHz to 10 mHz with a perturbation using a signal of equal amplitude at 10 mV. As same as weight loss measurements, experiments were repeated at least three times to check the repeatability.
SEM analysis
The specimens for surface morphological examinations were immersed in 1 M HCl solution containing the optimum concentration of inhibitor (800 ppm) and test solution for 5 h at 20 °C. Then, they were removed, washed quickly with distilled water, and dried. The analyses were observed using SEM (JEOL JSM-6360 LV).
Results and discussion
Generally, the inhibitory effect of an organic substance depends on many factors, including adsorption centers, interaction mode, molecular size, molecular geometry, concentration, the nature and state of the metal, type of the medium and other experimental conditions, such as temperature and pH [16-19]. The effects of some of these parameters on mild steel corrosion was studied.
Phytochemical screening
Phytochemical analysis shows that Ephedra major plant extract contains saponins, tannins, flavonoids, alkaloids, heterosids and coumarins. The result of phytochemical analysis of Ephedra major plant extract is shown in Table 1 [20].
Table 1 Phytochemical analysis results of Ephedra major plant extract.
| Phytochemical analysis | Result |
|---|---|
| Alkaloids |
|
| Saponins |
|
| Flavonoids |
|
| Tannins |
|
| Reducing compound |
|
| Starch |
|
| Anthocyanin |
|
| Coumarin |
|
| Triterpene glycosides |
|
| Steroidal glycosides |
|
Notes:
Characterization of the prepared extract
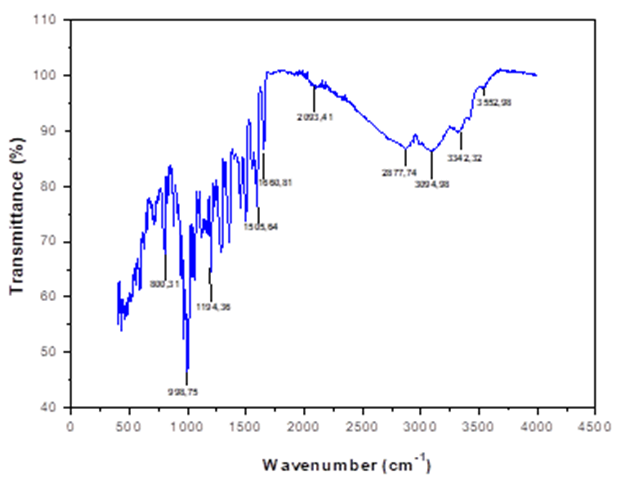
The FT-IR spectrum of the butanolic extract of Ephedra major is shown in Fig.1. The spectrum shows absorption peaks of 3552 and 3342 cm-1, which are assigned to the stretching vibrations of N-H. The wavenumbers around 1600-1200 cm-1 are due to stretching C=C, C=O, OH and C=N, while around 800-500 cm-1 they are attributed to the presence of C-C, C-O, =C-H and C-N. This shows that EBEM plant extract contains mixtures of compounds, i.e. amides, amines, aromatic and organic acids.
Weight loss measurements
The corrosion parameters obtained by conducting weight loss measurements for mild steel in the absence and presence of different concentration of Butanolic extract of Ephedra major (EBEM) in 1 M HCl solution after 5 h of immersion at different temperatures in the 20-60 °C range, were calculated are given in Table 2. The corrosion rate (CR) was calculated, in milligrams per square centimeter per hour (mg cm-2 h-1), from the following equation [21]:
Table 2 Corrosion parameters of 32CrMoV5 steel in 1M HCl medium in the absence and presence of EBEM at 20°C
| Cinb (ppm) | CR i (mg .cm-2.h-1) | CR 0 (mg .cm-2.h-1) | θ | IEW (() |
|---|---|---|---|---|
| 100 | 0.1707 | 0.3549 | 0.51905 | 51.91 |
| 200 | 0.1157 | 0.3549 | 0.67396 | 67.40 |
| 300 | 0.0986 | 0.3549 | 0.72217 | 72.22 |
| 400 | 0.0889 | 0.3549 | 0.74951 | 74.65 |
| 500 | 0.0651 | 0.3549 | 0.81657 | 81.66 |
| 600 | 0.0605 | 0.3549 | 0.82953 | 82.95 |
| 700 | 0.0599 | 0.3549 | 0.83122 | 83.12 |
| 800 | 0.0539 | 0.3549 | 0.84813 | 84.81 |
| 900 | 0.1074 | 0.3549 | 0.69738 | 69.74 |
| 1000 | 0.1081 | 0.3549 | 0.69541 | 69.54 |
Where, ∆W is the average weight loss (mg), S is the total surface area of the specimen (cm2) and t is the immersion time (h). The inhibition efficiency can be calculated using the equation reported in the literature [21]:
Where,
Fig.2 shows the evolution of inhibitory efficiency and corrosion rate of 32CrMoV5 steel immersed in 1M HCl for 5 hours at 20 °C as a function of the EBEM concentration. The curves show that the corrosion rate decreases and reaches a value of 0.0539 mg.cm-2.h-1 at 800 ppm while the inhibitory efficiency increases with increasing inhibitor concentration. Table 2 shows the values obtained for the corrosion rate CR (mg.cm-2.h-1), the inhibition efficiency values IEw (%) and surface coverage (θ) at 20 °C.

Fig. 2 Evolution of the corrosion rate and the inhibitory efficiency as a function of different concentrations of EBEM calculated from the weight loss method at 20 °C
According to Table 2, the following observations can be drawn:
The inhibitory efficiency and the surface coverage increase while the corrosion rate CR decreases with increasing EBEM concentration.
The inhibitory effect of EBEM increases with increasing inhibitor concentration and reaches the maximum value of 84.81 % in the presence of 800 ppm. This behavior can be explained by a large adsorption of the n-butanol extract of the plant Ephedra major on the surface of the metal and covers the active sites of the surface, which causes the formation of a barrier layer, which reduces the reactivity of the metal on the surface of mild steel 32CrMoV5.
An increase of inhibitor concentration beyond 800 ppm resulted in a diminished corrosion protection. This may be due to the withdrawal of adsorbate (EBEM) back into the bulk solution when the concentration of inhibitor closed to or beyond the critical concentration [22,23]. The above effect leads to the weakening of metal-inhibitor interactions, resulting in the replacement of inhibitor by water or chloride ions (Cl−) with a decrease in inhibition efficiency [23,24].
The extract has good inhibiting properties against corrosion of steel in 1 M HCl medium. Fig.3 shows the evolution of inhibitory efficiency for different extract concentrations in 1M HCl solution over the temperature range of 20-60 °C. The change of the corrosion rate with the temperature was studied in 1M HCl, both in the absence and presence of EBEM. It is observed that the rise in temperature accelerated the corrosion reaction, resulting in an increased corrosion rate. Generally, in acidic media, dissolution of metal is accompanied by evolution of hydrogen gas and a rise in temperature usually accelerates the corrosion reactions, resulting in higher dissolution of metal. However, the inhibition efficiency increases with increasing EBEM concentration, which can be attributed to some chemical changes occurring that phytochemical component of the extracts are absorbed onto the mild steel surface, resulting in blockage of reaction sites and protection of the mildsteel surface from attack by corrosion-active ions in the acid medium [25,26].
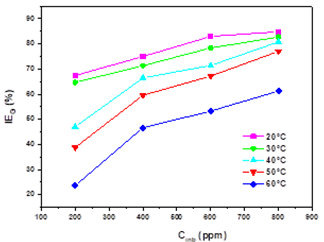
Fig. 3 Evolution of the inhibitory efficiency as a function of different concentrations of EBEM calculated from the weight loss method at different temperature
The further rise in temperature, decreased the inhibition efficiency showing a phenomenon of the quick desorption of adsorbed inhibitor molecules from the surface (Table 2), the protective layer formed on the surface of the steel by adsorption of the plant extract is destroyed and is no longer resistant. Generally, the effect of temperature on the inhibited acid-metal reaction is very complex, because many changes occur on the metal surface such as rapid etching and desorption of inhibitor and the inhibitor itself may undergo decomposition [27,28]. According to Ammar et al. [29], this phenomenon was explained by the high sensitivity of the Van Der Waals-type physical interactions between the iron surface and the inhibitor. Table 3 shows the obtained values of percentage inhibition (IEW), corrosion rate (CR) and surface coverage (θ) are summarized in Table 2 at different temperatures.
Table 3 Corrosion parameters of 32CrMoV5 steel in 1M HCl medium in the absence and presence of different concentrations of EBEM at different temperatures.
| T (°C) | Cinb (ppm) |
|
θ |
|
|---|---|---|---|---|
| 20°C | blank | 0.3549 | // | // |
| 200 | 0.1157 | 0.67399 | 67.40 | |
| 400 | 0.0888 | 0.74979 | 74.98 | |
| 600 | 0.0605 | 0.82953 | 82.95 | |
| 800 | 0.0539 | 0.84813 | 84.81 | |
| 30°C | blank | 0.8720 | // | // |
| 200 | 0.3080 | 0.64679 | 64.68 | |
| 400 | 0.2500 | 0.71330 | 71.33 | |
| 600 | 0.1887 | 0.78361 | 78.36 | |
| 800 | 0.1509 | 0.82695 | 82.70 | |
| 40°C | blank | 2.0499 | // | // |
| 200 | 1.0860 | 0.47022 | 47.02 | |
| 400 | 0.6880 | 0.66437 | 66.44 | |
| 600 | 0.5860 | 0.71413 | 71.41 | |
| 800 | 0.3939 | 0.80784 | 80.78 | |
| 50°C | blank | 6.0573 | // | // |
| 200 | 3.1070 | 0.38801 | 38.80 | |
| 400 | 2.4500 | 0.59553 | 59.55 | |
| 600 | 1.9870 | 0.67192 | 67.20 | |
| 800 | 1.3931 | 0.77001 | 77.00 | |
| 60°C | blank | 12.1567 | // | // |
| 200 | 9.2800 | 0.23663 | 23.66 | |
| 400 | 6.4828 | 0.46673 | 46.67 | |
| 600 | 5.6805 | 0.53273 | 53.27 | |
| 800 | 4.7068 | 0.61282 | 61.28 |
Electrochemical measurement
Potentiodynamic polarization
In order to know the kinetics of anodic and cathodic reactions, potentiodynamic polarization measurements were carried out to gain insight into the kind of corrosion protection supplied by EBEM. Experiments were performed in the absence and presence of different concentration of EBEM. Experiments were performed in the absence and presence of different concentration of EBEM. Fig.4 displays polarization plots of mild steel 32CrMoV5 immersed in 1M HCl at 20 °C, in the absence and presence of different concentrations of EBME. Electrochemical parameters such as corrosion potential (Ecorr, mV/SCE), cathodic and anodic Tafel slopes (βc, βa, mV/dec), the corrosion current density (icorr, mA.cm-2) and inhibition efficiency (IEp%) are given in Table 3. The (IEp %) is calculated according to the Equation bellow:

Fig. 4 Tafel curves of mild steel obtained at 20 °C in 1 M HCl solution containing different concentrations of EBEM.
Where
As reported by in Table 4, the following points can be raised:
Table 4 Polarization parameter values for the corrosion of mild steel in 1M HCl solution containing different concentrations of EBEM extract.
| Extract | Cinh (ppm) | -Ecorr (mV/SCE) | icorr (mA.cm-2) | βa. (mV/dec) | -βc (mV/dec) | IEp (%) |
|---|---|---|---|---|---|---|
| blank | 0 | 412.2 | 0.6140 | 93.8 | 111.5 | / |
| 200 | 422.1 | 0.2075 | 67.2 | 78.3 | 66.21 | |
| EBEM | 400 | 416.2 | 0.1437 | 70.9 | 181.8 | 76.60 |
| 600 | 410.0 | 0.1162 | 57.8 | 130.8 | 81.08 | |
| 800 | 425.4 | 0.1036 | 64.4 | 118.7 | 83.13 |
Ecorr was approximately constant ; the change in value of Ecorr with respect to the corrosion potential of the blank is lower than 85 mV reflect the mixed type of inhibition [30,31].
The addition of extract EBEM decreases the current densities anodic and cathodic current.
The parallel cathodic Tafel lines suggest that the addition of EBEM shows that the proton
reduction reaction on the surface of the steel is not modified, this indicates that the mechanism of hydrogen evolution mainly due to charge transfer [31,32]. This behavior was ascribed to adsorption of the extract molecules covering the active centers present ᴏn the steel surface [20,33].
The inhibition efficiency increases with increase in concentration for EBEM, while the corrosion current densities decreased. These results signify that the extract was good inhibitor for mild steel in acidic solution.
Electrochemical impedance spectroscopy (EIS)
EIS measurements were performed to study the impedance parameters to provide a deeper insight regarding the corrosion protection in 1 M HCl at various concentrations of EBEM at 20 °C. The working electrode was soaked in the test solution for 45 min before each experiment in order to achieve a quasi-stable condition. Nyquist and Bode plots of mild steel in uninhibited and inhibited acidic solutions containing various concentrations of Butanolic extracts of Ephedra major are shown in Fig.5.

Fig. 5 Nyquist (a), Bode and phase angle (b) plots for mild steel in 1.0 M HCl with and without different concentrations of EBEM at 20 °C.
As shown in Fig.5 (a), it can be observed that the impedance spectra data has significantly changed with the addition of the extract, but these diagrams have similar shape for all tested concentrations, indicating that there is almost no change in the corrosion mechanism whether the inhibitor is added or not [31,34]. From these plots, the impedance containing a depressed semicircle, whose diameter increases with increasing extract concentration, indicating a charge transfer process, mainly controlling the corrosion of mild steel [4,35,36]. In addition, these diagrams (Nyquist) contain a semicircle which is not a perfect, which is often referred to as frequency dispersion as a result of the inhomogeneity [23, 37] or the roughness, impurities and dislocations [38] of the solid surface. This finding is confirmed by the depiction of Bode diagrams where the existence of an equivalent circuit containing a single constant phase element in the steel/acid interface is observed. In addition, at low frequencies in the Bode diagram, the increase in absolute impedance confirms the the higher protection with the increase in the concentration of the inhibitor, which can be explained by the adsorption of the EBEM compound on the surface of the mild steel [39]. From Fig 5(b), the phase angle plots increase with the decrease of EBEM concentration, this increase is due to the formation of a protective film on the mild steel surface. While the increase in the |Z| modulus (Fig. 5(b)) indicates the good performance of the inhibitor with a constant time period for different concentrations of EBEM [40]. According to these results, adsorption takes place on the surface of mild steel leading to the formation of a protective thin film that inhibits the dissolution of mild steel in HCl medium. The phase angle values for the EBEM used were still higher than the blank but lower than -90 °, indicating a non-ideal capacitor. The inhibition efficiency was calculated from Nyquist plots, according to the following Equation:
Where,
Table 5 Electrochemical parameters of impedance and corresponding inhibition efficiency for the mild steel obtained at 20 °C in 1M HCl solution with and without different.
| Extract | Cinh (ppm) | Rs (Ω.cm2) | Rp (Ω.cm2) | Q.105 (SnΩ−1cm−2) | n | Cdl (µ.F.cm-2) | IEEIS (%) |
|---|---|---|---|---|---|---|---|
| blank | 0 | 1.442 | 91.61 ± 0.31 | 79.56 | 0.847 ± 0.52 | 496.5 | |
| EBEM | 200 | 0.113 | 227.8 ± 0.36 | 29.70 | 0.801 ± 0.51 | 152.1 | 59.79 |
| 400 | 0.211 | 377.0 ± 0.29 | 18.00 | 0.838 ± 0.50 | 107.0 | 75.70 | |
| 600 | 0.553 | 631.1 ± 0.30 | 16.25 | 0.832 ± 0.50 | 104.3 | 85.48 | |
| 800 | 0.168 | 711.7 ± 0.28 | 15.21 | 0.836 ± 0.50 | 98.24 | 87.13 |
The values of Cdl can be calculated from (CPE) parameter and Rp according to the following Equation [21]:
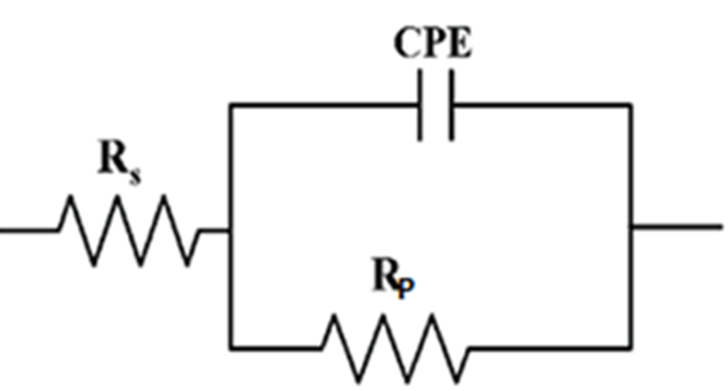
Where n is the deviation parameter of the CPE: 0 ≤ n ≤ 1. The electrochemical parameters including Rp, Q, and n, obtained from the fit and the calculated double-layer capacitance values are listed in Table 5. Simulations of Nyquist and Bode plots led to the equivalent circuit that fitted the experimental data established in 1.0 M HCl medium with and without the presence of the EBEM as shown in Fig.7.
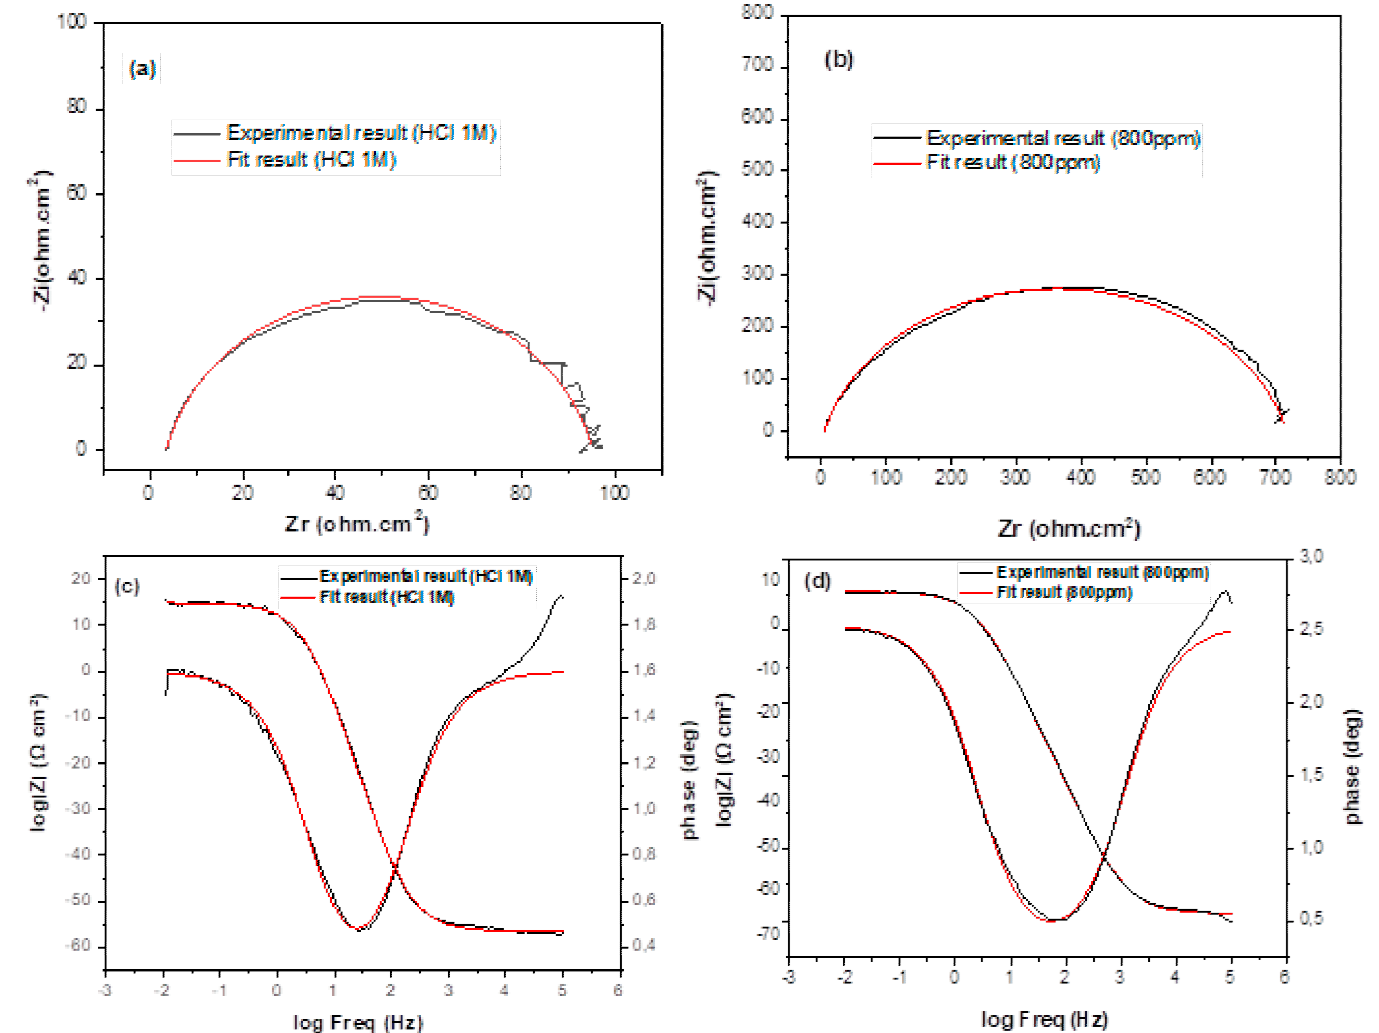
Fig. 7 Simulations of Nyquist and Bode plots based on the equivalent circuit to fit experimental data of EIS in the absence of EBEM (a) and (c) and in the presence of EBEM (b) and (d) at 800 ppm.
The significance of the temperature on mild steel dissolution in 1 M HCl in the absence and presence of EBEM can be best represented by Arrhenius Equation [38]:
Where A is a constant (pre-exponential factor), Ea is the activation energy, R is the universal gas constant and T is the absolute temperature. A plot of the logarithm of the CR versus 1/T showed a straight line. As exhibited in Fig. 8, the values of apparent activation energy Ea obtained from the slope (-Ea/R).
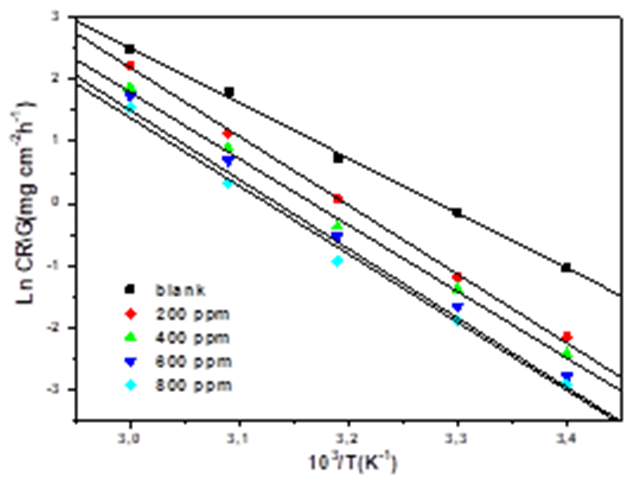
Fig.8. Arrhenius diagram of the corrosion rates of mild steel in 1M HCl medium in the absence and presence of the different concentrations of EBEM.
The alternative formulation of the Arrhenius relationship (Equation. 9), was employed to calculate the activation enthalpy ΔHa and activation entropy values ΔSa[38, 44].
In Eq.9, h represents the Planck’s constant and N is the Avogadro’s number. The plot of ln(CR/T) versus 1/T showed a straight line (Fig. 9). The values of ΔHa and ΔSa were calculated from the slope (-Ha/R) and intercept (ln(RT/Nh)+(Sa/R).
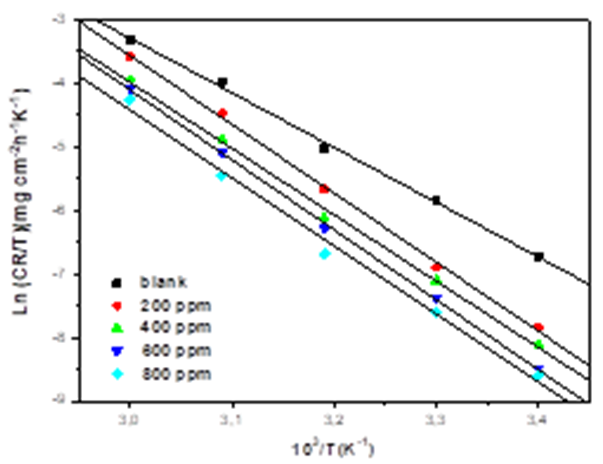
Fig. 9 Alternative Arrhenius diagram of the corrosion rates of mild steel in 1M HCl medium in the absence and presence of the different concentrations of EBEM.
Activation parameter values for Carbone steel in 1M HCl in the absence and presence of different concentrations of the EBEM enumerated in Table 6.
Table 6 Thermodynamic activation parameters of mild steel in HCl at different concentrations of EBEM.
| Extracts (ppm) | Ea (kJ/mol) |
|
|
|---|---|---|---|
| blank | 74.119 | 71.488 | -10.439 |
| 200 | 91.166 89.330 | 90.058 86.698 | 42.995 29.427 |
| 400 | 89.330 | 86.698 | 29.427 |
| 600 | 94.091 | 91.459 89.012 | 42.703 32.753 |
| 800 | 91.643 | 89.012 | 32.753 |
Investigation of Table 6 reveals the following results:
The values of activation energy were higher in the presence of the EBEM than in its absence. This increase reflects that the inhibitory molecules of EBEM are physisorbed [44].
The positive signs of enthalpies reflect the endothermic nature of the dissolution process [45,46].
The entropy values are negative in the free acid solution and positive with the addition of the extract, this suggests that the adsorption of organic inhibitory molecules is accompanied by desorption of water molecules from the surface of steel [47].
Adsorption parameters
The adsorption isotherm provides important acquaintance at the interaction of inhibitor and metal surface. It is therefore necessary to know the mode of adsorption. The experimental data were applied according to various adsorption isotherms, notably Freundlich, Langmuir, Frumkin and Temkin. Langmuir adsorption isotherm was best fitted and can be given by the Equation.10.
Where
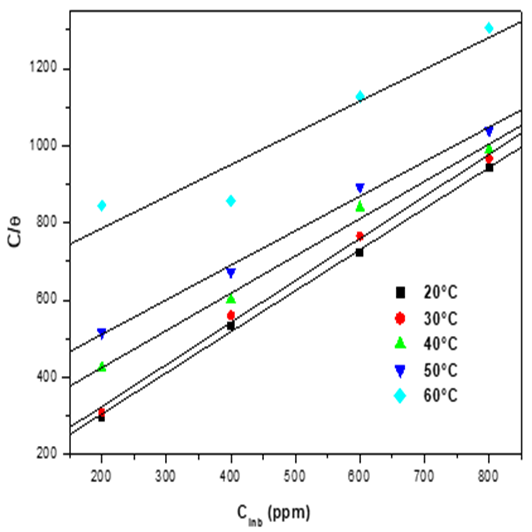
Fig.10. Langmuir adsorption isotherm plots for mild steel in 1M HCl in the presence of EBEM at different temperatures.
The value of the equilibrium constant Kads is used to estimate the
standard free energy of inhibitor adsorption
Where
Fig.11 exhibits the variation of
Results presented in the Table.7, indicate:
Table 7 Thermodynamic parameters for the adsorption of EBEM on mild steel in 1M HCl at different temperatures.
| Temperature (°C) | Kads(l /mg) |
|
|
|
|---|---|---|---|---|
| 20 | 1.089×10⁻² .10-22277722222 | -22.644 | -0.061 | |
| 30 | 9.443×10⁻³ | -23.058 | -0.058 | |
| 40 | 4.325×10⁻³ | -21.787 | -40.503 | -0.060 |
| 50 | 3.014×10⁻³ | -21.513 | -0.059 | |
| 60 | 1.610×10⁻³ | -20.443 | -0.060 |
The adsorption and desorption processes of EBEM are in dynamic equilibrium, since constant of adsorption (Kads) was noticed to decrease with increase in temperature [48].
Negative signs of
The obtained results of the adsorption ΔGads values close to −20 kJ/mol confirm the physisorption mechanism [49].
The negative sign of
The adsorption of inhibitor molecules is accompanied by negative values of
Morphological characterization
The SEM micrograph of the mild steel surface in the absence and presence of 800 ppm of EBEM concentration are presented in Figs. 12(a), (b) and (c). Fig. 12(b) show that the surface of the sample is heavily damaged and severely corroded compared to that in Fig.12(a), which appears uniform with some lines resulting from polishing. Whereas in the presence of the inhibitor EBEM as shown in Fig. 12(c), the external morphology appears softer, indicating a protected surface. These images suggest that the protection comes from the formation of EBEM layer on the Carbone steel surface that prevents the attack of acids.
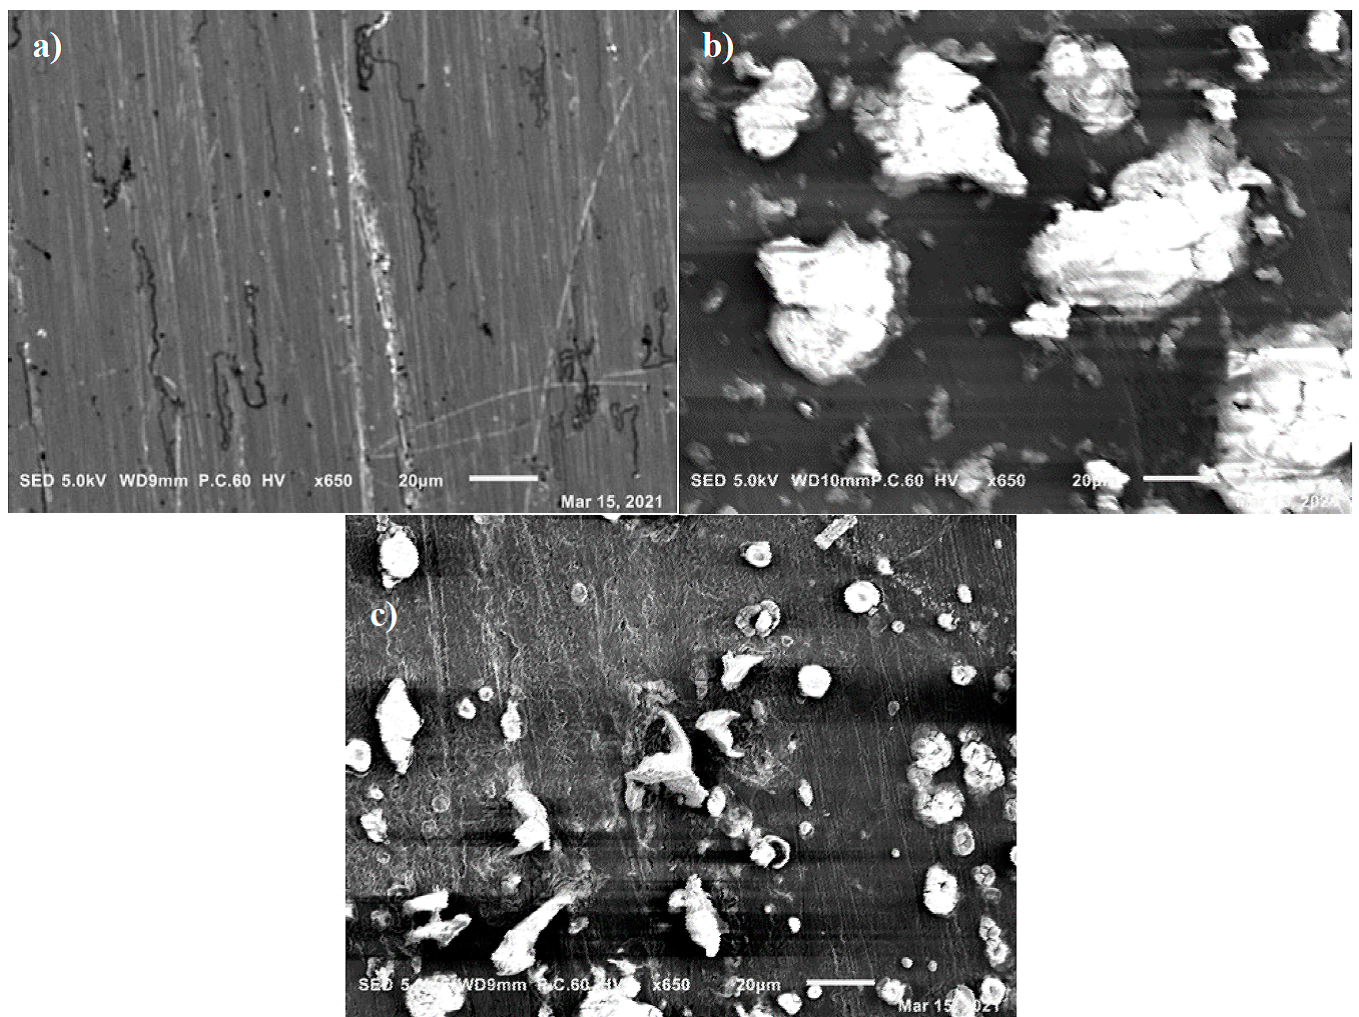
Fig.12 SEM micrograph of the steel surfaces: (a) before corrosion, (b) after immersion for 5 h at 20 °C in 1M HCl solution and (c) mild steel immersed in 1M HCl containing 800 ppm for 5 h at 20 °C.
Mathematical modeling
Regression is a highly useful statistical technique used in several scientific fields with the aim to develop a quantitative relationship between a dependent variable (response) and one or more independent variables (factors) [49]. The least squares method is a statistical standard approach in regression analysis used to find the optimum fit for a set of data points by minimizing the sum of the squares of the residuals of curves points. In this study, two mathematical models were suggested to obtain the best fit between inhibition efficiency (EIw) of an extract of the plant Ephedra major for mild steel in 1.0 M hydrochloric acid (dependent variable) and independent variables (temperature T and inhibitor concentration C). The developed mathematical models are classified into two groups, linear and polynomial models. Experimental data presented previously were used to construct the models. Both models take into account the individual effect of each variable and the interaction between them. The calculations were done using Matlab Software Program, Version 19.
Linear model
A linear mathematical model was used as a statistical tool aiming to predict the effect of the variables xi and yi which are respectively the temperature T(°C) and the inhibitor concentration C (mol/L) as a function zi which is the inhibitor efficiency (EIw %). The proposed model is given in the equation bellow:
The optimal parameters ai within the meaning of the least squares method is those, which minimize the quantity:
In this expression, N is the number of experiments. ai are constants representing the model parameters. The minimum of this expression is found when the partial derivatives (∂S/∂ai) are equal to zero:
This leads to the following system of equations:
Parameters of the model were estimated based on the least square method. Since x=T, y=C and z=EIw. The constants of the model were reported in Table 4.
Polynomial model
The second proposed polynomial model equation was obtained by representing the inhibition efficiency EIw (%) by the response function z which can be expressed by the equation bellow:
Where, x is temperature (°C) and y the concentration (mol/L). Similarly, the optimal parameters ai within the meaning of the least squares method are those, which minimize the quantity:
The minimum of this expression is obtained using the Equation.15. The expanded equations can be written as:
Constants of the model were estimated and listed in Table 8. Based on both models the predicted values of inhibition efficiency as a function of temperature and inhibitor concentration are computed and gathered in Table 9.
Table 8 Coefficients of linear and polynomial suggested models with correlations cofficients.
| Coefficients | Inhibition efficiency IE W (%) | |
|---|---|---|
| Linear model | Polynomial model | |
| a1 | -1.211800000000025 | -0.014442857142857 |
| a2 | 0.010988999999999 | -0.000055037500000 |
| a3 | 0.0008984 | 0.401318459918343 |
| a4 | 90.024000000000342 | 0.102641691079194 |
| a5 | / | -0.000016979776980 |
| a6 | / | 40.488904460404228 |
| Corrolation cofficients R² | 0.9325 | 0.9417 |
Table 9 Inhibition efficiency as a function of temperature and inhibitor concentration experimental and estimated values computed using linear and polynomial models.
| Run | T (°C) | C (M) | IE W (%) Experimental |
|
|
|---|---|---|---|---|---|
| blank | - | - | |||
| 1 | 20 | 200 | 67.40 | 71.5794 | 60.9970 |
| 2 | 400 | 74.98 | 77.3708 | 74.8530 | |
| 3 | 600 | 82.95 | 83.1622 | 84.3059 | |
| 4 | 800 | 84.81 | 88.9536 | 89.3558 | |
| blank | - | - | |||
| 5 | 30 | 200 | 64.68 | 61.2582 | 57.7548 |
| 6 | 400 | 71.33 | 68.8464 | 71.5768 | |
| 7 | 600 | 78.36 | 76.4346 | 80.9957 | |
| 8 | 800 | 82.70 | 84.0227 | 86.0117 | |
| blank | - | - | |||
| 9 | 40 | 200 | 47.02 | 50.9370 | 51.6241 |
| 10 | 400 | 66.44 | 60.3220 | 65.4121 | |
| 11 | 600 | 71.41 | 69.7070 | 74.7971 | |
| 12 | 800 | 80.78 | 79.0920 | 79.7791 | |
| blank | - | - | |||
| 13 | 50 | 200 | 38.8 | 40.6158 | 42.6047 |
| 14 | 400 | 59.55 | 51.7976 | 56.3588 | |
| 15 | 600 | 67.20 | 62.9794 | 65.7098 | |
| 16 | 800 | 77.00 | 74.1612 | 70.6578 | |
| blank | - | - | |||
| 17 | 60 | 200 | 23.66 | 30.2946 | 30.6968 |
| 18 | 400 | 46.67 | 43.2732 | 44.4169 | |
| 19 | 600 | 53.27 | 56.2518 | 53.7340 | |
| 20 | 800 | 61.28 | 69.2340 | 58.6481 |
For analysis of the accuracy of the predicted results obtained with linear and polynomial models, the coefficient of determination commonly known as R-squared (or R2), has been estimated using the equation bellow:
In this relationship, zi are experimental inhibition efficiency,
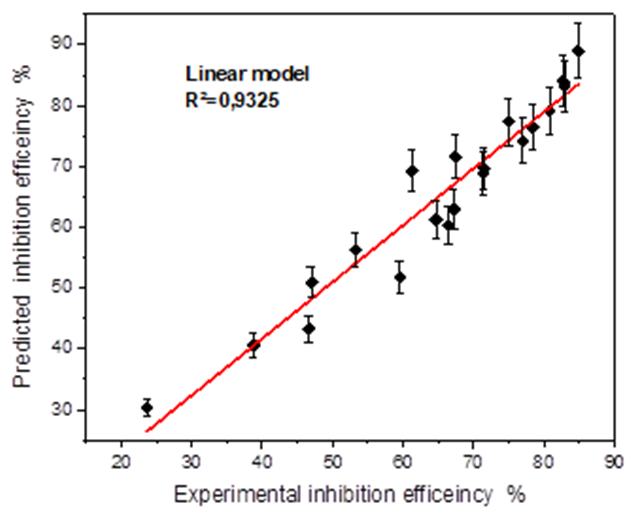
Fig. 13 Fitting curve of experimental against predicated inhibition efficiency obtained by the linear model.
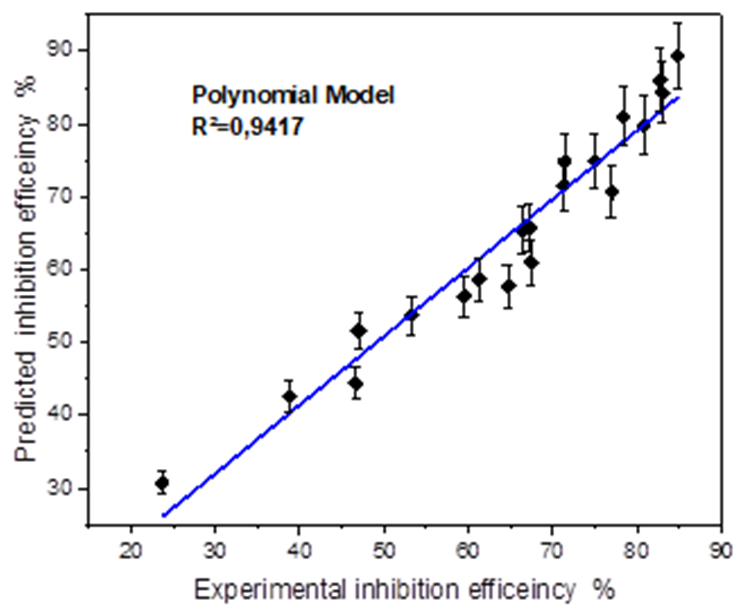
Fig. 14 Fitting curve of experimental against predicated inhibition efficiency obtained by the polynomial model.
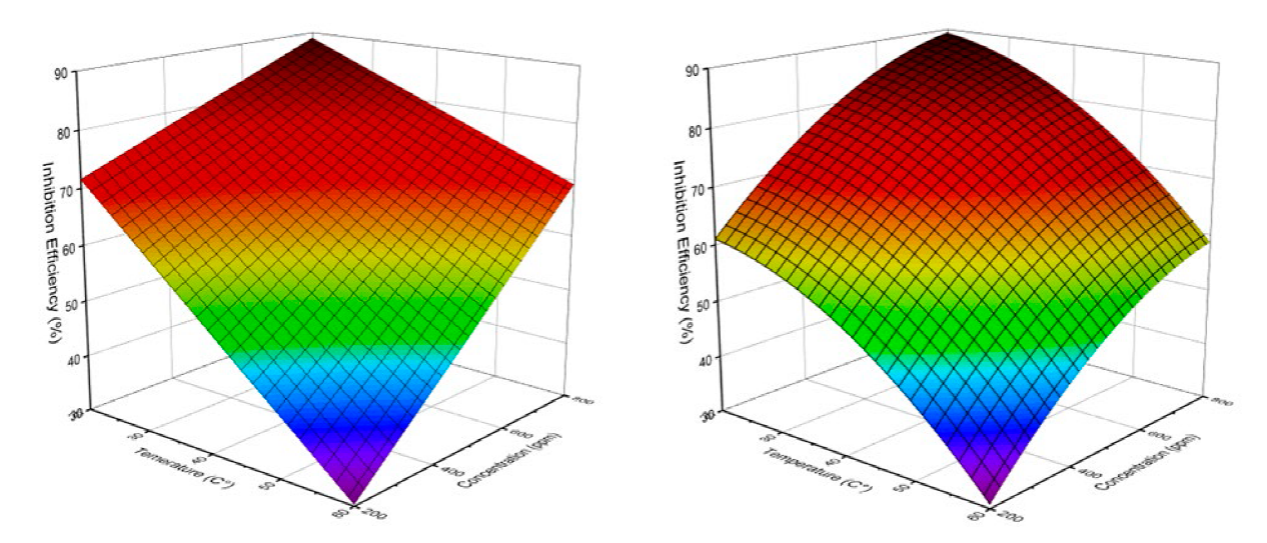
As shown in Fig.15, examination of the data provided by the two models and presented as surface plot, reveals that the addition of butanolic extract of Ephedra major (EBEM), at different concentrations decreases the corrosion rate of mild steel. The inhibition efficiency (IEW %) increases with increasing inhibitor concentration (red zone) and decreases with increasing temperature (blue zone). This can be explained by a regression of adsorption induced by temperature rise. At concentration 800 ppm and temperature 20 °C, EBEM exhibits maximum inhibition efficiency for both models: 88.95 % (linear model) and 89.35 % (polynomial). A comparison with the experimental value 84.81 % shows the reliability of both polynomial and linear model.
Conclusion
This paper deals with the inhibition effect and adsorption behavior of a novel butanolic extract of Ephedra major (EBEM), on mild steel in 1M HCl medium. The investigation was conducted, using the weight loss method, morphological characterization, and mathematical modeling. The following conclusions are made based on the above study.
The study of the concentration is carried out to examine the evolution of the inhibitory efficiency, as well as the model of the adsorption isotherm on the steel surface. From this parameter the following observations can be drawn:
The inhibitory effect of EBEM increases with increasing inhibitor concentration and reaches the maximum value of 89.3558 % in the presence of 800 ppm.
The thermodynamic study shows that the adsorption of this inhibitor to the steel surface is spontaneous and follows the Langmuir adsorption isotherm model.
The negative value of the Gibbs free energy of adsorption (ΔGads) is indicative of a strong interaction between the inhibitor molecules and the surface of mild steel.
The study of the influence of temperature was carried out to obtain the model of chemical or physical adsorption on the metal surface. The following points can be identified:
The inhibitory efficiency IEW (%) decreases while that of the corrosion rate (CRi) increases with temperature in the range 20 to 60 °C for all concentrations used. This behavior illustrates the physisorption of the inhibitor molecule.
In all cases, there is an increase in the corrosion rate as a function of temperature. The evolution of the corrosion rate in the corrosive solution alone (1M HCl) shows a regular and rapid growth, confirming an increasing metallic dissolution with increasing temperature.
From SEM, the formation of a protective layer on the mild steel surface by the inhibitor was observed hence confirmed the high performance of inhibitive effect of EBEM.
Two mathematical models were suggested to correlate the effect of temperature and inhibitor concentration on inhibition efficiency. From the results obtained using this model it can be can conclude that:
Mathematical analyses are in good agreement with experimental results confirming that inhibition efficiency is influenced by temperature, inhibitor concentration and their combined effect.
Both polynomial and linear models are suitable to represent the data with a high correlation coefficient.

