


 nueva página del texto (beta)
 Inglés (pdf)
 Artículo en XML
 Referencias del artículo
 Enviar artículo por email
 Citado por SciELO
  Similares en
SciELO
Similares en
SciELO 
 Permalink
Introduction
Lead is a chemical element used as a component in several products, such as batteries, gasoline, paint, cosmetics, and ceramics. Anthropogenic activities have led to the generation, distribution, and availability of metals in urban environments and industrialized countries [1,2]. Exposure to lead can cause adverse physical and biological effects, such as damage to the central nervous system, respiratory system, homeopathic system, cardiovascular system, and peripheral nervous system. However, in infants, lead can produce effects such as short-term memory, decreased intelligence, delayed growth, permanent brain damage, and even death [1,3,4]. In recent years, several studies have reported cases of people linked to lead poisoning that exhibited significant levels of metal in their blood above World Health Organization recommended limits (<10 µg dL-1) [5]. The European Union and Codex Alimentarius have set 0.02 mg kg-1 and 0.01 mg kg-1, respectively, as the maximum level (ML) of lead in infant formula for products ready to use (after reconstitution as instructed by the manufacturer) [6,7].
For these reasons, several techniques have been developed in order to determine and monitor Pb(II) ions in real samples, such as electrothermal atomic absorption spectrometry (ETAAS) [4,8], flame atomic absorption spectrometry (FAAS) [9], inductively coupled plasma (ICP) [10], and electrochemical methods [11]. In recent years, capillary electrophoresis (CE) has considerable attention by the multiple advantages in terms of multi-elemental determination of organic and inorganic compounds, short analysis time, higher efficiency with adequate selectivity and sensitivity, lower solvent consumption and further considered an environmental friendly technique [12]. However, the implementation of these techniques requires sample pre-treatment in the analysis of complex matrices [4,8,10].
Solid phase extraction (SPE) has been the pre-treatment technique most frequently used in the purification, clean-up, and pre-concentration of organic and inorganic compounds in complex matrices. In general, the sample is passed through the cartridge where the analyte of interest is retained in the solid phase, eliminating the interferences in the same step. The elution of the analytes is carried out by the addition of suitable organic solvents [13,14]. SPE is based on the distribution of analytes between the solid material and mobile phase; for this reason, countless sorbents have been used for SPE, such as silica, functionalized silica, and resins, among others [13]. According to the versatility, new materials have been developed and applied in the SPE process, such as imprinted polymers (IPs). IPs are materials based on a molecular padlock and molecular key. The IPs are synthesized by copolymerization between a functional monomer and a cross-linker agent in the presence of a target analyte (template). After the removal of the template, the material presents actives sites with high selectivity and specificity for recognition of the target [15]. These materials have been applied to pre-concentration, recovery, and removal processes of several analytes, such as drugs, herbicides, textile dyes, and explosives, from a complex matrix [16,17].
Ion-imprinted polymers (IIPs) are materials analogous to IPs. This methodology is used to create artificial receptors with high selectivity and specificity to metal ions [18]. The recognition modes are principally by ion exchange, electrostatic, and coordination interactions. A number of ion-imprinted polymers have been designed for pre-concentration, removal, and extraction of metal ions, such as Co(II) [19], Cu(II) [20], As(V) [21], Ni(II) [22], Hg(II) [23], Zn(II) [24], Cr(VI) [25], and Pb(II) [26], in complex matrices such as food and environmental samples and coupled with several separation techniques [12,27].
The present work describes an efficient alternative to the traditional methods of determining and monitoring lead in infant formula samples. The IIP design was investigated using Pb(NO3)2 as template molecule, methacrylic acid (MAA) and 4-vinylpyridine (4VP) as functional monomers, and ethylene glycol dimethacrylate (EGDMA) as cross-linker agent, coupled with SPE and CE. The imprinted material was synthetized by a radical precipitation method, the physical-chemical properties were characterized in infrared spectroscopy (IR), scanning electron microscope (SEM) and isotherms models (Freundlich, Langmuir and Dubinin-Raduskevich). The efficiency was evaluated under different experimental conditions: pH values, IIP mass polymer composition (molar ratio), solvent nature, concentrations, and eluted volume. The method proposed provide versatility, selectivity, accuracy, and could be considered environmentally friendly in terms of low reagent consumption in their corresponding analysis.
Experimental
Materials and chemicals
Reagents and materials
MAA, 4VP, lanthanum nitrate hexahydrate (La(NO3)3●6H2O), lead nitrate Pb(NO3)2, sodium persulfate, and EGDMA were obtained from Sigma Aldrich (St. Louis, MO, USA). EDTA disodium salt, sodium tetraborate, sodium hydroxide (NaOH), methanol (MeOH), hydrogen peroxide (H2O2), and hydrochloric acid (HCl) were obtained from J.T. Baker (Phillipsburg, NJ, USA). All solutions were prepared by dissolving the respective reagent in water with a resistivity not less than 18.2 MΩ-cm provided by a Milli-Q system (Millipore, Bedford, MA, USA). The electrolyte solution was adjusted to pH 9.0 (20 mmol L-1 of sodium tetraborate and 2 mmol L-1 of EDTA disodium salt).
Instrumentation
A Perkin Elmer Fourier transform infrared (FTIR) spectrophotometer with a Pike Gladi ATR was used for infrared characterization of the polymer. Morphological analysis of the adsorbent was performed using a JEOL JSM-820 scanning electron microscope (SEM). Thermogravimetric analysis (TGA) was performed using a Mettler TGA/SDTA 851e. The materials were heated from 25 °C to 600 °C under nitrogen flow at a rate of 10 °C min-1. A pH/ion analyzer (model 450; Corning Science Products, NY, USA) was employed to adjust the pH value of the background electrolyte solution (0.01 pH units). A vacuum pump (Rocker 300) was employed to regulate the flow in the SPE process. Electrophoresis was performed using a Beckman Coulter P/ACE 5500-DAD (photodiode array detector) (Fullerton, CA, USA). The separation was performed in a fused silica capillary (41.7 cm × 75 μm ID). Data were analyzed with a Beckman P/ACE system with MDQ version 2.3 software. ETAAS experiments were performed using a 240FS AA spectrophotometer with GTA 120 Graphite Tube Atomizer, data were analyzed with AA 240Z version 5.2 PRO software.
Synthesis of ion-imprinted polymer
The IIP was obtained by precipitation via radical polymerization (Fig. 1). In the first step, 0.1 mmol of the template molecule Pb(NO3)2, 0.2 mmol of MAA, and 0.3 mmol of 4VP were mixed and dissolved in 30 mL of methanol and stirred for 2 h at 25 °C. Later, 2 mmol of the cross-linker agent (EGDMA) and 0.3 mmol of the initiator agent (sodium persulfate) were added to the mixture. Subsequently, the mixture was purged with nitrogen gas for 15 min. Once the oxygen was purged, the polymerization reaction took place at 60 °C for 18 h [28]. Once the polymerization concluded, the template was removed by Soxhlet extraction with 2 mol L-1 HNO3/MeOH until Pb(II) was not detected by CE. Finally, the IIP was dried at 60 °C for 16 h before their use. The control polymer (non-imprinted polymer “NIP”) was obtained in a similar process as the IIP except that the Pb(NO3)2 was not added to the mixture.

Sample treatment and analysis
The infant formula sample was dissolved in water as instructed by the manufacturer (4.5 g of infant formula in 30 mL of water). Subsequently, 6 mL of acetic acid (HAc 2 % m/v) was added to 200 mL of the sample to precipitate the proteins. The mixture was heated in a water bath for 10 min (60 °C) and centrifuged at 10,000 rpm for 5 min [29]. Then, the supernatant (180 mL) was passed through SPE cartridge (packed with 20 mg of IIP) previously activated with 5 mL of MeOH and 5 mL of deionized water at a flow rate of 1 mL min-1 controlled with a vacuum system. The cartridge was washed three times with 5 mL of 5 % MeOH. The retained Pb(II) was eluted with 5 mL of 0.5 mol L-1 HNO3/MeOH at a flow rate of 1 mL min-1, and the eluted solution was evaporated to dryness at 40 °C by 10 min, and redissolved in 500 µL of EDTA solution (1 mmol L-1 of EDTA and 100 µg L-1 of La3+ as an internal standard (IS) and analyzed by CE.
In each work session, the capillary was activated according to the following sequence: 1.0 mol L-1 NaOH for 15 min, 0.1 mol L-1 NaOH for 10 min, deionized water for 10 min, and electrolyte solution for 10 min. All solutions were at 25 °C, and all flushing procedures were performed at a pressure of 20 psi. The capillary was washed between analyses with 1.0 mol L-1 NaOH for 4 min, 0.1 mol L-1 NaOH for 2 min, deionized water for 2 min, and electrolyte solution for 2 min. The wavelength detector (λ) was set at 200 nm, and the samples were introduced by hydrodynamic injection at 5 psi for 5 s. The capillary was kept at 25 °C, and a potential of 16 kV was applied to separate process.
To determination of lead by electrothermal atomic absorption spectrophotometer, the infant formula (0.5 g) was digested with 5 mL of HNO3 and 2 mL of H2O2 in polytetrafluoroethylene tubes, and a digestion process was carried out in a MARS 6 microwave sample digestion system (MARS 6, CEM Corporation, USA) with a power of 1000 W according to the following sequence: 1) ramp time 5 min, room temperature to 90 °C, hold time 5 min, 2) ramp time 5 min, 90 °C to 150 °C, hold time 10 min, 3) ramp time 5 min, 150 °C to 180 °C, hold time 20 min [8]. Subsequently, the samples were allowed to cool to room temperature. Finally, the samples were diluted to 25 mL with water and analyzed by ETAAS [4].
Adsorption study
The adsorption studies of Pb(II) were performed in batch experiments to determinate the effect of the composition of IIP (Pb(II):(MAA/4VP):EGDMA), pH of system (2.0 to 7.0), mass of IIP (5.0 to 40.0 mg) and adsorption isotherms (1 to 80 mg L-1 of Pb(II) at pH 6.0 by Freundlich, Langmuir and Dubinin-Raduskevich models. The experimental parameters were determined by equations (2-7), according to the following sequence: 1 mL of Pb(II) solution (100 µg L-1 of IS) was passed through an IIP cartridge at a flow rate of 1 mL min-1. To the resulting solution was added 100 µL of 1 mmol L-1 EDTA solution, and the mixture was analyzed by CE. The % extraction of Pb(II) was determined by equation (1), where C1 and C2 are the concentrations before and after adsorption, respectively.
Selectivity of IIP by Pb(II) was evaluated in presence of other ions metals (Cu(II), Cd(II), Cr(III), Mg(II), and Ca(II)) and determined by equations (8-10). Finally, the elution conditions were studied employing different solutions composed of MeOH, MeOH/EDTA, MeOH/HAc, MeOH/HNO3, and MeOH/NaOH.
Results and discussion
Effect of the composition of IIP
To determine the composition effect on the percent extraction of Pb(II), the monomer ratios of IIP were synthetized at different molar ratios (Pb(II)/(MAA:4VP)/EGDMA) and applied in extraction by SPE (1.0 mL of a 5.0 mg L-1 standard solution of Pb(II) and 20.0 mg of the IIP) by univariate optimization. Based on the obtained results (Table 1), the % extraction increased with the increase in the 4VP concentration, with extraction percentages of 66.1 to 90.0 % for the polymers with a MAA/4VP ratio of (5.0/0.0) to (2.0/3.0) (RSD < 5 % in all cases). On the other hand, the polymers 6 and 7 had lower efficiency with respect to IIP 5; this can be explained by the low concentration of carboxyl groups from MAA affecting the template-functional monomer interaction. The above confirms the synergic effect between carboxyl groups from MAA and nitrogen atom from 4VP on the formation of coordination complex [28], this facilitates the extraction of Pb(II) by the IIP With respect to the effect of the cross-linker, three proportions (IIPs 5, 8 and 9) were tested. The IIP 8 and 9 presented a lower % of extraction with respect to the IIP 5 (about 16.0 and 36.0 %). The effect can be explained by the fact that decreasing the cross-linking concentration in the IIP diminishes the efficiency in the recognition sites. However, increasing the cross-linker concentration affects the pore size, which affects the interaction with the analyte-IIP [30]. According to the obtained results (Table 1), the highest extraction was achieved with the IIP 5 (1.0:(2.0/3.0):20.0; Pb(II)/(MAA/4VP/EGDMA); for this reason, this IIP was used for subsequent experiments.
Table 1 Influence of relation of cross-linker and monomers on % of extraction of IIPs.
| IIP | Composition Pb(II):(MAA/4VP):EGDMAa | %Extraction (RSD)b |
|---|---|---|
| 1 | 1.0:(5.0/0.0):20.0 | 66.1 (1.1) |
| 2 | 1.0:(4.0/1.0):20.0 | 73.4 (0.9) |
| 3 | 1.0:(3.0/2.0):20.0 | 80.6 (2.2) |
| 4 | 1.0:(2.5/2.5):20.0 | 87.0 (3.2) |
| 5 | 1.0:(2.0/3.0):20.0 | 90.0 (1.1) |
| 6 | 1.0:(1.0/4.0):20.0 | 80.2 (1.3) |
| 7 | 1.0:(0.0/5.0):20.0 | 70.1 (0.8) |
| 8 | 1.0:(2.0/3.0):25.0 | 73.4 (2.3) |
| 9 | 1.0:(2.0/3.0):15.0 | 54.4 (4.2) |
| NIP | 0.0:(2.0/3.0):20.0 | 31.2 (2.2) |
a Reference on 1 mmol of Pb(II).
b n=3.
Characterization of the polymer
To identify the physical-chemical properties of the optimum IIP, the solid was characterized by different analytical techniques. The FTIR spectra (Fig. 2) shows a band at 2990 cm−1 and 2950 cm−1, attributed to symmetric and asymmetric stretching of -CH2 and -CH3 for all monomers. The bands at 1690 cm−1 and 1722 cm−1 are attributed to the C=O stretching of MAA and EGDMA, the bands around 1490 cm−1 and 1543 cm−1 are for the stretching vibration of the pyridine ring of 4VP, the band at 1146 cm−1 is for the stretching of C-O-C present in EGDMA, and at 3000 cm−1, there is a band attributed to the -O-H of MAA. The stretching band in the range from 1600 cm−1 to 1645 cm−1 is attributed to the C=C groups of all monomers, but these bands vanished in the IIP spectra as a result of the polymerization process [28,31].

The morphological characteristics of IIP and NIP were analyzed by SEM (Fig. 3). These micrographs show that the presence of the template molecule in the polymerization process of the two polymers did not influence the morphology, as both materials possess a spherical morphology. The polymers have an approximate particle size of 400 nm for IIP and 260 nm for NIP, which can be attributed to cavities generated during the polymerization process. These increases the diameter and pore volume, affecting the particle size of the material and providing a higher surface area [17].

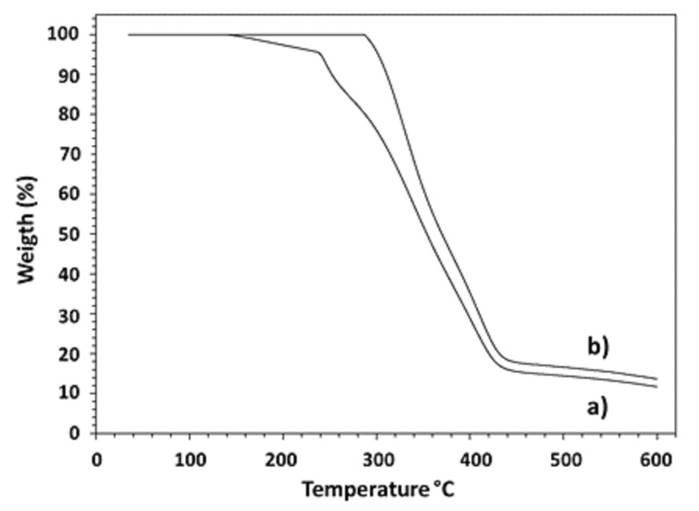
TGA experiments were used to determine the thermal stability of IIP and NIP, analytical parameter related to its application in the pharmaceutical, polymer, and food industries. Fig. 4 shows the TGA plots. The NIP (Fig. 4(a)) and IIP (Fig. 4(b)) have a similar weight loss; however, in the range of 35 °C to 250 °C, a small mass loss is observed (4.3%), which is attributed to the loss of water from the matrix in the ion-imprinted polymer [32]. A second process of mass loss is observed, with about 84.3 % and 82.4 % weight loss for IIP and NIP, respectively. These are attributed to the degradation of the polymers for a range of temperatures, from 260 °C to 437 °C for the NIP and 296 °C to 430 °C for the IIP. The difference between NIP and IIP can be attributed to the increase in thermal stability due to the molecular imprinting in polymers [32].
Effect of pH and IIP mass on the Pb(II) extraction
The pH of the sample can determine the chemical nature of the template molecule and polymeric matrix, which can affect the adsorption process [21]. The effect of pH on the adsorption of Pb(II) was carried out in batch experiments with 20 mg of IIP on the SPE system using 1 mL of a 5 mg L-1 standard solution of Pb(II). The pH of the samples was evaluated from 2.0 to 7.0. At a pH higher than 8.0, the Pb(II) can be precipitated as Pb(OH)2, affecting the interaction with the polymer [33]. According to the results obtained, the better percentages of extraction were at a pH from 6.0 to 7.0 (Fig. 5). For a pH value lower than 6.0, the adsorption capacity decreased considerably as a function of the protonation of the functional groups of the carbonyl and hydroxyl groups, affecting the coordination of the IIP with Pb(II) [34]. According to the results obtained, a pH of 6.0 was used for subsequent experiments.

The effect of the IIP mass was evaluated for an interval from 5.0 to 40.0 mg of IIP on the cartridge with 1 mL of standard solution (5 mg L-1) at pH 6.0. Fig. 6 shows the % of Pb(II) extraction did not vary when more than 20.0 mg was used. According to this result, 20.0 mg of IIP was used on the cartridge for subsequent experiments.

Adsorption isotherms
The Freundlich isotherm is an empirical model that has been used to describe non-ideal adsorption of the analyte onto heterogeneous surfaces with different types of sites acting with different energies of sorption. The model can be written as given below (Equation 2) [30,35]:
where Qe is the quantity of Pb(II) adsorbed per gram of the adsorbent at equilibrium (mg g-1), Ce is the equilibrium concentration of the adsorbate (mg L-1), K F is Freundlich’s constant, and n indicates the favorability of the adsorption process [30,35]. The Langmuir model has been used to linearize adsorption isotherms. The model is described by the following equation:
where Q m is the theoretical isotherm saturation capacity (mg g-1), K L is Langmuir’s constant, and C0 is the initial concentration, for other hand with Langmuir model could determine the favorability of the adsorption with RL (Equation 4). RL > 1 is an unfavorable process, 0 < RL < 1 is a favorable process, and RL = 0 indicates an irreversible process [36,37]. Dubinin-Raduskevich is another empirical model formulated to determine the adsorption mechanism (physical or chemical interactions) onto homogeneous and heterogeneous surfaces.
where β is a constant attributed to the free energy of the adsorption process, ε is the Polanyi potential, R is the gas constant (8.314 J mol-1 K-1), and T is the absolute temperature of the system (K) [35,37].
Table 2 shows the results obtained for the Freundlich isotherms. The n value was 1.67, indicating that the adsorption of Pb(II) by IIP is favorable (n between 1.0 to 10.0), while 1/n was 0.59, describing a normal adsorption process (1/n < 1), with a KF of 2.9 mmol g-1 and an r2 value of 0.993. With respect to the Langmuir isotherms, the maximum adsorption capacity with a Qm of 3.1 mg g-1 based on SPE-CE data, RL value was 0.714 indicating a favorable process, KL of 0.127 L mg-1, and R2 value is 0.997 [37]. According to the Dubinin-Radushkevich isotherm, the E value was 10.37 kJ mol-1, indicating a chemical process (physical adsorption is less than 8.0 kJ mol-1; a chemical process is between 8.0-16.0 kJ mol-1) with an R2 value of 0.996 [19,38].
Selectivity analysis
The selectivity of the IIP during the extraction process was studied in the
presence of a variety of cations usually found in real samples of infant formula
[8], such as Cu(II), Cd(II), Cr(III),
Mg(II), and Ca(II), as shown in Fig. 7.
Each experiment was carried out in binary mixtures. The concentration of Pb(II)
was 5 mg L-1, and for the others, the cations were from a 1:2 molar
ratio for Cu(II), Cd(II), and Cr(III). This is due to the levels of each
contaminant that can be found in real samples; on the other hand, the Mg(II) and
Ca(II) was evaluated from a 1:8 molar ratio due to the high concentrations that
can be found naturally in infant formula. The mixtures were extracted by a
cartridge with 20.0 mg of IIP at pH 6.0. Table
3 shows the relative selectivity coefficient (k’)
determined by equation (8) and the
selectivity coefficients

Table 3 Selectivity coefficients of IIP and NIP.
| Element | IIP | NIP | k’ | ||
|---|---|---|---|---|---|
| KD (mL g-1) |
|
KD (mL g-1) |
|
||
| Pb(II) | 950.00 | --- | 22.67 | --- | |
| Mg(II) | 0.61 | 1557.38 | 8.82 | 2.57 | 605.98 |
| Ca(II) | 1.81 | 524.86 | 12.50 | 1.81 | 289.98 |
| Cu(II) | 4.76 | 199.58 | 15.35 | 1.48 | 134.85 |
| Cr(III) | 5.68 | 167.25 | 18.30 | 1.24 | 134.88 |
| Cd(II) | 9.74 | 97.54 | 24.62 | 0.92 | 106.02 |
Effect of type, concentration and volume of eluent
To the analyte elution of IIP were used 1 mL of a standard solution of Pb(II) (5 mg L-1) at pH 6.0 was passed through an IIP cartridge (20 mg) at a flow rate of 1 mL min-1. The retained Pb(II) was eluted with 1 mL of different solutions, including MeOH, EDTA 0.1 mol L-1/MeOH, HAc, 0.1 mol L-1/MeOH, NaOH 0.1 mol L-1/MeOH, and HNO3 0.1 mol L-1/MeOH. Later, the eluted solution was evaporated until dry and redissolved in 1 mL of deionized water (1 mmol L-1 of EDTA and 100 µg L-1 of IS) and analyzed by CE. As shown in Fig. 8 a, it was found that the solution of HNO3 0.1 mol L-1/MeOH provide better percentages (40.0%) in comparison with the other solutions, this could be explained by a better affinity between the Pb(II) and the HNO3 in comparison with the negative charges originated in the IIP in presence of NaOH and the respective lower affinity between Pb(II)-EDTA by complexation effect in the system when was employed an EDTA solution, with percentages <30.0 %. For this reason, the % of recovery was evaluated by the effect of the concentration of HNO3 at three levels (0.1 mol L-1, 0.3 mol L-1, 0.5 mol L-1). As shown in Fig. 8(a), the % of recovery increases with respect to the concentration of HNO3; for this reason, the solution used in the elution process was 0.5 mol L-1 HNO3/MeOH. To increase the % of recovery, the effect of eluent volume was tested. In Fig. 8(b), it can be observed that 5 mL of eluent solution (0.5 mol L-1 HNO3/MeOH) was necessary to have the best Pb(II) recovery.

Analytical parameters
Under optimal conditions (composition of IIP/ pH/ mass/ eluent solution), the analytical parameters of SPE-CE were evaluated at the interval of concentrations from 0.1 to 30 µg L-1. Each standard was prepared and analyzed by triplicate using the proposed method. The calibration curve was constructed from the peak area ratios (analyte/internal standard). The calibration parameters are shown in Table 4. The calibration curve shows a linear dependence on the Pb(II) concentration (R2 = 0.998). The accuracy of the development method was investigated in terms of intra-, inter-day repeatability and recovery of Pb(II) added to the infant formula at two concentrations with three replicates for each level. The mean of recoveries and repeatability had a RSD less than 5 % in all cases.
Table 4 Parameters of calibration mUA vs. concentration of Pb(II) in 200 mL of sample.
| Parameters | |
|---|---|
| Determination coefficient r2 | 0.998 |
| Intercept, b0±ts(b0) | 0.03 ± 0.04 |
| Slope, b1±ts(b1) | 300.0 ± 2.1 |
| Limit of detection (µg L-1) | 0.5 |
| Limit of quantification (µg L-1) | 1.5 |
| Linearity range (µg L-1) | 1.5-30.0 |
| Repeatability inter-daya | |
| 3 µg L-1 | 3.13 µg L-1 (2.0)a |
| 10 µg L-1 | 9.92 µg L-1 (4.5)a |
| Repeatability intra-daya | |
| 3 µg L-1 | 3.05 µg L-1 (2.0)a |
| 10 µg L-1 | 10.12 µg L-1 (2.7)a |
| Recovery | |
| 5 µg L-1 | 104 % (3.5) a |
| 15 µg L-1 | 99 % (2.7) a |
a RSD, n = 3
Application to real samples
The proposed methodology was applied to the determination of Pb(II) in 20 commercial infant formula. According to the results obtained, four samples were positive for the presence of Pb(II). Fig. 9 shows the experimental electropherograms: (a) spiked infant formula sample, (b) positive infant formula sample, and (c) blank sample to presence of Pb(II). To further ensure the accuracy of the proposed method, positive samples were also analyzed by ETAAS. The results obtained (Table 5) were compared with those obtained by the classical pre-treatment method. To evaluate differences between the methods, a one-way ANOVA test was performed. The calculated Fvalue (p = 0.05) did not exceed the critical Fvalue (F1,22 = 4.30, α = 0.05). The test demonstrated the absence of a significant difference between the results obtained by the proposed methodology and ETAAS.

Fig 9 Electropherograms. (a) Spiked milk samples with 20 µg L-1 of Pb(II), (b) Positive infant formula sample treated with the IIP. (c) Blank infant formula sample, all samples were spiked with 100 µg L-1 of the IS.
Comparison of IIP-CE with other methodologies reports
Table 6 shows the application of IIPs in recent years. According to the authors, EGDMA is a cross-linker agent that is frequently used in the synthesis of these materials. Likewise, a functional monomer constituted by oxygen and nitrogen in their structure is used to ensure adequate interactions between the lead and functional monomers. In addition, some methodologies use silica and carbonaceous compounds (graphene oxide) as the support material. The methodologies have been employed in water samples (tap water, lake water, river water, well water, and mineral water), coupled with SPE and dispersive solid phase extraction (DSPE), and analyzed by FAAS, ICP, and mass spectrometry (MS) [15,26,28,41-43].
According to the limits of detection (0.5 µg L-1), the proposed method is competitive in terms of analysis time (10 min by sample), sample volume (100 µL), simple instrumentation (recycled SPE cartridge), multielemental analysis and environmentally friendly with low solvent consumption. In comparison, ETAAS require a digestion process with HNO3-H2O2, inert atmosphere and specific equipment (spectrophotometer, graphite tube atomizer, hollow cathode lamp) in the monoelement analysis.
Table 6 Comparison of IIP with reported methods for adsorption of Pb(II).
| Sample | IIP Composition(mmol or g) | IIPMass |
|
Techniques | LODµg L-1 | Ref. |
|---|---|---|---|---|---|---|
| Water | 5 mmol MAA/ 5mmol 4VP/ 20 mmol EGDMA | 200 mg | 30(Cu2+), 32(Mn2+), 38(Cd2+), 43(Zn2+). | SPE-FAAS | 0.06 | [28] |
| Water | 5 mmol MAA/ 5mmol 4VP/ 20 mmol EGDMA /1 g HMSa | 20 mg | 64(Cu2+), 79(Mn2+), 88(Ni2+), 117(Co2+). | SPE-ICP-AES | ----- | [26] |
| Water | 0.176 mmol compound 1b/ 5 mmol EGDMA | 100 mg | 14.5(Co2+), 15.3(Cr3+), 19.8(Ce3+), 26.1(Cd2+). | DSPE-ICP-MS | ---- | [15] |
| Meat samples | 20 mmol EGDMA/ 10 mmol vinyl-diphenylcarbazide/ 0.5 g v-mSi@Fe3O4 | 10 mg | --- | DSPE-FAAS | 1.30 | [41] |
| Water | 8 mmol MAA/2 mmol 1-mercaptoctane/40 mmom EGDMA | 50 mg | 87.1(Cu2+), 106.2(Co2+), 45.5(Cd2+), 223.2(Ni2+). | DSPE-FAAS | 0.59 | [42] |
| Water | 3.5 mmol DEMc / 0.6 mmom 8-HQd/ 3.5 mmol divinylbencene-80 | 300 mg | --- | SPE-ICP-OES | 1.88 | [43] |
| Infant formula | 2 mmol MAA/ 3 mmol 4VP/ 20 mmol EGDMA | 20 mg | 97.5(Cd2+), 167.2(Cr3+), 199.5(Cu2+), 524.8(Ca2+), 1557.3(Mg2+). | SPE-CE | 0.50 | This work |
aHollow mesoporous silica, b4,4ʹ-(1E,6E)-1,7-bis(4-hydroxy-3-methoxyphenyl) hepta-1,6-diene-3,5-dione]phenyl acrylate, cdiethylamino ethyl methacrylate, d8-hidroxyquinoline.
Conclusion
In this work, an ion-imprinted polymer was synthesized. The imprinted material (Pb-4VP/MAA-EGDMA) showed high selectivity with respect to Cu(II), Cd(II), Cr(III), Mg(II), and Ca(II). The selectivity coefficients indicated the selective extraction of Pb(II) from real samples. The SPE-CE is a robust method with satisfactory results in terms of recovery, sensitivity, precision, and accuracy in the determination of Pb(II) (RSD < 5.0% in all cases), with a limit of detection of 0.5 µg L-1, which is lower than the maximum level specified by current international laws. Thus, the methodology can be applied to the determination and regulation of the content of Pb(II) in infant formula. The proposed methodology is simple, fast, low cost, and a competitive alternative for Pb(II) analysis in complex matrices. In addition, the IIP-SPE pre-concentration technique is also an alternative for coupling to other analytical methodologies, such as ETAAS. The IIP based heavy metal ion detection allows for the development and application of new methods for the analysis of metal ions. On the other hand, the proposed methodology with CE could be used for simultaneous determination of several metal ions, such as Pb(II), Cu(II), Cd(II), Cr(III), Mg(II), and Ca(II), among others.

