


 nova página do texto(beta)
 Inglês (pdf)
 Artigo em XML
 Referências do artigo
 Enviar este artigo por email
 Citado por SciELO
  Similares em
SciELO
Similares em
SciELO 
 Permalink
Introduction
Cancer is a complicated, pervasive, and fatal illness. It is recognized as a significant public health issue worldwide [1]. It starts as cells become abnormal and begin to expand outside of their normal borders, and it can then infiltrate neighboring areas and spread to other organs of the body [2]. Microtubules, as essential cytoskeleton components, are formed by heterodimers of α,β-tubulin [3]. They play a key role in a variety of cellular functions, including formation of cell signaling motility regulation, cell shape, intracellular transport and secretion [4,5]. Microtubules interacting drugs have been recognized as promising targets for cancer chemotherapy due to their importance in mitosis and cell division, in which they are known as tubulin dimer cages that play a role in chromosome dynamics, which stops cell division in mitosis [6-8]. Taxanes, vinca-alkaloids and colchicine have been identified as cancer chemotherapeutic agents targeting the microtubule cytoskeleton [9]. The discovery of tubulin inhibitors that bind to the active site of colchicine was a key move in the development of antimitotic drugs [10]. Compared to taxanes and vinca alkaloids, colchicine has more therapeutic advantages and better clinical benefits [11].
Quinoline fused heterocycles have been shown to have potent cancer inhibitory efficacy in a wide variety of human cancer cell lines by inducing cell cycle arrest and apoptosis, as well as inhibiting angiogenesis, disrupting cell proliferation, functioning as growth inhibitors, and inhibiting tubulin polymerization [12]. Quinoline, one of the privileged structures in medicinal chemistry, is a well-known heterocyclic compound frequently found in functional organic materials and medicinal drugs. Also, it can be found in natural alkaloids that display substantial and wide-spectrum biological activities like antidiabetic, antiviral, antimalarial, anti-inflammatory, antioxidant, antimicrobial and anticancer [13-17]. Due to its biological properties and synthetic usefulness, 2-oxoquinoline, a class of heterocyclic molecular scaffold, has attracted a lot of attention among the different types of active quinoline skeletons.
Furthermore, there has been positive progress in testing tubulin inhibitors in preclinical and clinical trials. Nevertheless, the lower affinity necessitates the development of very efficient tubulin inhibitors, and it is critical to use in silico approaches to design novel tubulin inhibitors having higher activity in order to advance drug research. Here, a 3D-QSAR analysis was conducted on 25 tubulin inhibitors sharing the 2-oxoquinoline scaffold, based on ligand-based alignment. Upon which, rationally novel designed compounds were developed. Carefully molecular docking studies were also carried out to display ligand-protein interactions and calculate of the binding affinity. Based on extra-precision molecular dynamics simulation, the stability of molecular-protein complex system was further investigated. The outcome of this study could be helpful and supportive for the design of novel 2-oxoquinoline arylaminothiazole-based tubulin inhibitors
Experimental
Materials and Methods
Database
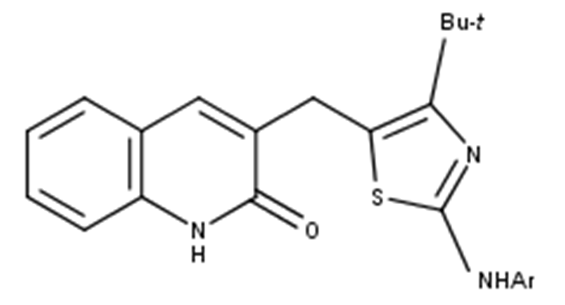
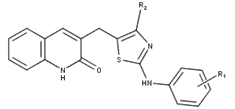
2-oxoquinoline arylaminothiazole derivatives involved in this work were retrieved from available literature [18] and were used in the development of the 3D-QSAR models. The molecular biological activities of these compounds expressed as IC50 values spanned a range from (4.4 - 73.2 µM) and were converted into the pIC50 (e.g., pIC50 = −logIC50). The whole data was randomly divided into a training set including 20 compounds for the generation of the 3D-QSAR model and an external test set containing 5 compounds for validation (asterisk labeled in Table S1). Table 1 displays the structures of molecules as well as their experimental activity values. The chemical structures of the compounds studied are shown in Fig. 1.
Table 1 pIC50 values of reported 2-oxoquinoline arylaminothiazole derivatives against tubulin.
| N° | Ar | pIC50 |
| 1* | C6H5 | 5.19 |
| 2 | 3-CH3C6H4 | 4.14 |
| 3 | 4- CH3C6H4 | 4.3 |
| 4 | 4- CH3OC6H4 | 4.43 |
| 5 | 2-FC6H4 | 4.8 |
| 6 | 4-FC6H4 | 5.36 |
| 7 | 2-ClC6H4 | 4.71 |
| 8 | 3-ClC6H4 | 4.87 |
| 9 | 4-ClC6H4 | 5.14 |
| 10 | 2-BrC6H4 | 4.57 |
| 11 | 4-BrC6H4 | 4.91 |
| 12 | 3-CF3C6H4 | 5.05 |
| 13 | 4-CF3C6H4 | 5.34 |
| 14 | 2-NO2C6H4 | 4.54 |
| 15 | 4-NO2C6H4 | 4.61 |
| 16* | 3,5-diCF3C6H3 | 4.94 |
| 17 | 2-F-4-NO2C6H3 | 5.07 |
| 18 | 2-Cl-4-NO2C6H3 | 4.84 |
| 19 | 3-Cl-4-FC6H3 | 4.8 |
| 20 | 2,3-diClC6H3 | 4.59 |
| 21* | 3,4-diClC6H3 | 4.61 |
| 22* | 3,5-diClC6H3 | 4.68 |
| 23 | 2,6-diBr-4-CF3OC6H2 | 4.44 |
| 24* | pyridin-2-yl | 4.38 |
| 25 | 2-methylquinolin-8-yl | 4.51 |
* Test molecule
Minimization and optimization
The chemical structures of the reported derivatives were drawn by the builder panel and optimized by using SYBYL-X 2.0 program [19]. Tripos force filled with Gasteiger-Huckel charges with a convergence criterion of 0.01 kcal/mol were used to optimize the geometry of these compounds [20,21].
Molecular alignment
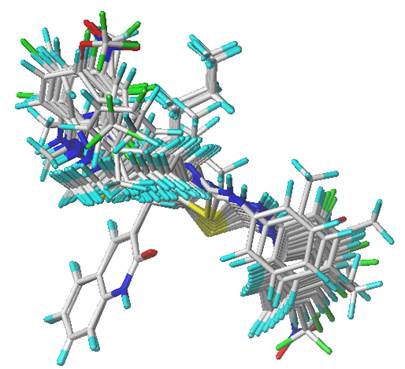
One of the most critical steps in deriving stable and reliable 3D-QSAR models is 3D structural alignment. The simple alignment method was used to align the compounds [22], in which the most active compound 6 was served as a structural template for the alignment of the remaining compounds in the data set. The minimized structures were employed as the primal conformations for 3D-QSAR analyses. Fig. 2 depicts the superimposed structures of aligned compounds.
Development of 3D-QSAR models
The most common and accurate methods for investigating the relationship between 3D structures and biological activities of compounds were CoMFA and CoMSIA, which were used in the development of the 3D-QSAR model [23,24]. CoMFA was developed to quantitatively relate the biological activity changes with the steric and electrostatic characteristics of molecules, whereas CoMSIA might be able to relate the biological activity with steric, electrostatic, hydrogen bond acceptor (HBA), hydrogen bond donor (HBD), and hydrophobic characteristics of molecules. Finally, partial least square analysis was conducted with the value of column filtering set to 2.0 kcal/mol and the energy cutoff set to 30 kcal/mol [25], while other parameters were set as default. The 3D-QSAR modeling analysis was carried out by SYBYL-X 2.0 program in standard settings, which ran on Windows 10 operating system.
Partial Least Square (PLS) analysis
PLS analysis method was performed to describe the linear relationship between the calculated CoMFA and CoMSIA descriptors fields with the reported biological activities [26]. The optimum number of components (N) and the coefficient of cross-validation correlation (Q2) were calculated by leave-one-out (LOO) method as the first stage. Based on the previously acquired N value, a non-cross validation procedure was carried out as the second stage, in which the correlation coefficient (R2), the standard error of estimate (SEE) and F-test value (F) were calculated. the regression fitting of developed 3D-QSAR models was described based on the high values of Q2 and R2 (Q2 > 0.50 and R2 > 0.60) [27,28], with a low standard error estimation (SEE) value which helps to choose the optimal model. A reliable QSAR model with more accurate predictability must also provide an optimal number of components. External validation was used to assess the reliability of the optimal models using the test set compounds, since it is the most valuable validation method, which requires that the appropriate condition (rext2 >0.6) must be fulfilled [29].
Y-randomization test
The Y-randomization technique is a commonly used approach to assess the possibility of chance correlation in constructed models [30]. The dependent variables (pIC50 values) were ascribed at random, and new QSAR models were developed with the initial independent variables. This process is replicated several times. We considered that the optimal models were not influenced by any chance correlation if the QSAR models were obtained by shuffling the pIC50 values gave low R2 and Q2 values than the nonrandomized models, which indicates the reliability of these models.
Molecular docking
Molecular docking is widely employed using Surflex-Dock module in Sybyl 2.0 for further screening of query compounds and illustrating their potential interaction modes of activity with protein targets. The crystal structure 3E22 was given by the RSCB Protein Data Bank. Both water molecules and the initial ligand were isolated from the protein using Discovery Studio 2016 software [31], and the binding modes were visualized using PyMOL software [32]. In this study, flexible molecular docking was applied in the docking process. The ligand was treated as fully flexible, while the receptor was kept rigid. The docking findings were then analyzed in depth to determine whether the higher predicted activities and docking scores of the selected compounds were appropriate. A compound with higher docking score among the newly designed compounds was further selected for molecular dynamics simulation and compared to the most active compound of the studied data set.
Molecular Dynamics (MD) simulation
To investigate the dynamic conformational changes of the selected docked compounds with tubulin protein, a MD simulation was done by Desmond Dynamics software [33] employing OPLS force field [34]. The initial structures used for MD simulations were the protein-ligand complexes obtained by molecular docking. The Leap module was utilized to interpret and extract structural snapshots of the molecular protein topology files. The Particle Mesh Ewald approach was used to calculate long-range electrostatic interactions [35]. The NVT stage was done with a 100 ps MD run to equilibrate the system at a steady temperature of 300 K by using the Berendsen algorithm. The water molecules and appropriate counter ions (Cl− or Na+) were added for neutralization at 300 K temperature. By using the steepest descent algorithm (5000 cycles) to execute energy minimization of the solvent system, unwanted contacts between heavy atoms were dislodged. For the overall simulations, the cut-off radius and time stage values were set to 0.8 and 1.25 fs, respectively. Finally, a production MD conducted for 50 ns was performed on each equilibrated system and the trajectory of the simulated system was calculated for every 100 ps. The root-mean-square fluctuation (RMSF), root-mean-square deviation (RMSD), gyration radius (Rg) and solvent accessible surface area (SASA) were recorded for 50 ns.
Results and discussion
3D-QSAR analysis
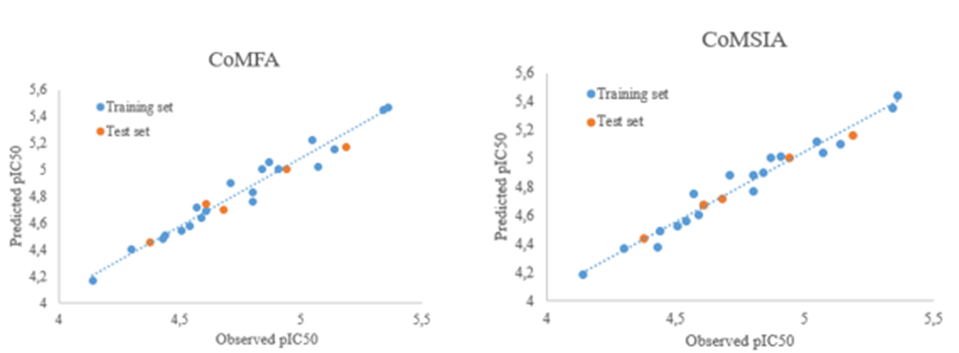
Internal and external validation were relevant parameters for assessing the accuracy of 3D-QSAR model. The statistical results of 3D-QSAR PLS analysis are outlined in Table 2. The observed and predicted pIC50 of molecules are listed in Table 3. For internal validation, the CoMFA model shows a satisfactory Q2 value of 0.692 for the training set with N of 5, an outstanding R2 of 0.875, F-test of 101.72 and lowest SEE of 0.065, implying that the model that has been developed is reliable. The steric field contributed 45 % of the total contribution, while the electrostatic field contributed 55 %, indicating that the steric field was more significant. The result of CoMSIA model gave an acceptable Q2 of 0.761 with an optimized component of 5, an excellent R2 of 0.956, a F-test value of 53.16, and SEE value of 0.09 This indicated that the generated model had a high level of internal predictability. The proportions of steric, electrostatic, HBA, HBD and hydrophobic sites in this model were, respectively, 7 %, 37 %, 11 %, 19%, and 26 %. The electrostatic and hydrophobic fields all play key roles in the corresponding model, according to the results. The electrostatic field was the most significant interaction between the ligand and the protein target of these three fields. CoMFA and CoMSIA provided outstanding predictive ability for external validation, with rext 2 values of 0.98 and 0.97, respectively. This indicated that the external predictability of both models did up to the standard, which demonstrates the robustness of the developed models. The scatter plots of the predicted and observed pIC50 for the data set compounds exhibit that all points are distributed close to the straight line as shown in Fig. 3. The above findings indicate that the derived models were of good quality.
Table 2 PLS statistics parameters.
| Model | Q2 | R2 | SEE | F | N | rext 2 | Fractions | ||||
| Ster | Elec | Acc | Don | Hyd | |||||||
| CoMFA | 0.692 | 0.875 | 0.065 | 101.72 | 5 | 0.98 | 0.45 | 0.55 | - | - | - |
| CoMSIA | 0.761 | 0.956 | 0.09 | 53.16 | 5 | 0.97 | 0.07 | 0.37 | 0.11 | 0.19 | 0.26 |
Table 3 Observed and predicted pIC50 of 25 2-oxoquinoline arylaminothiazole derivatives.
| N° | Observed pIC50 | CoMFA | CoMSIA | ||
|---|---|---|---|---|---|
| predicted | Residuals | predicted | Residuals | ||
| 1* | 5.19 | 5.17 | 0.02 | 5.16 | 0.03 |
| 2 | 4.14 | 4.17 | -0.04 | 4.18 | -0.04 |
| 3 | 4.3 | 4.4 | -0.09 | 4.37 | -0.07 |
| 4 | 4.43 | 4.48 | -0.06 | 4.38 | 0.05 |
| 5 | 4.8 | 4.76 | 0.05 | 4.77 | 0.03 |
| 6 | 5.36 | 5.47 | -0.12 | 5.44 | -0.08 |
| 7 | 4.71 | 4.9 | -0.19 | 4.88 | -0.17 |
| 8 | 4.87 | 5.06 | -0.18 | 5 | -0.13 |
| 9 | 5.14 | 5.15 | -0.02 | 5.1 | 0.04 |
| 10 | 4.57 | 4.72 | -0.15 | 4.75 | -0.18 |
| 11 | 4.91 | 5 | -0.08 | 5.01 | -0.1 |
| 12 | 5.05 | 5.22 | -0.17 | 5.12 | -0.07 |
| 13 | 5.34 | 5.45 | -0.12 | 5.35 | -0.01 |
| 14 | 4.54 | 4.58 | -0.04 | 4.56 | -0.02 |
| 15 | 4.61 | 4.69 | -0.08 | 4.67 | -0.06 |
| 16* | 4.94 | 5 | -0.05 | 5 | -0.06 |
| 17 | 5.07 | 5.02 | 0.05 | 5.04 | 0.03 |
| 18 | 4.84 | 5 | -0.17 | 4.9 | -0.06 |
| 19 | 4.8 | 4.83 | -0.04 | 4.88 | -0.08 |
| 20 | 4.59 | 4.64 | -0.06 | 4.6 | -0.01 |
| 21* | 4.61 | 4.74 | -0.12 | 4.67 | -0.06 |
| 22* | 4.68 | 4.7 | -0.01 | 4.72 | -0.04 |
| 23 | 4.44 | 4.51 | -0.07 | 4.49 | -0.05 |
| 24* | 4.38 | 4.45 | -0.07 | 4.44 | -0.06 |
| 25 | 4.51 | 4.54 | -0.03 | 4.52 | -0.01 |
Contour map analysis
The contour maps were provided to determine the main areas where structural changes (modifying/removing) in CoMFA and CoMSIA fields would affect the inhibitory activity. As a reference for the explanation, compound 6 was overlaid on the contours.
CoMFA contour maps
As the steric field depicted in Fig. 4(a), the green region (80 % contribution) represents a steric contribution to potency, while region of yellow (20 % contribution) reduces the potency. As shown in the map, a large region of green contour is seen at the 4, 5 and 6 positions of the phenyl of aminothiazole, suggesting a preference for less bulky groups. Furthermore, three small sized yellow regions are located at the second and third positions of the same phenyl, which indicates that raising the volume at these positions would not be beneficial to activity. This finding can be explained by noting that compound 10, with bromo-substituted group, is less active than compounds 6 and 8, with chlor- and fluor-substituted groups, respectively.
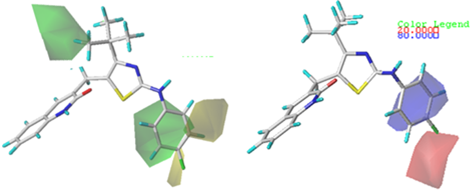
Fig. 4(b) shows the electrostatic contour map, with blue areas (80 % contribution) indicating the positive electrostatic charge potential related to improved activity and the red areas (20 % contribution) indicating negative charge potential. As shown in the map, a moderately sized red contour is located at the 4 position of the phenyl moiety, indicating that the improvement of protein-binding affinity can be done by enhancing electronegativity in this area. Hence, the pIC50 values of compounds with increased π-electron density on the 4 position of the phenyl were much higher than that of compounds with an alkyl-substituted group at the same position. Additionally, a blue region near the 2 and 3 positions of the phenyl moiety demonstrates that substituents with positive charges may be beneficial in these regions.
CoMSIA contour map
In CoMSIA, other parameters such as HBD, HBA and hydrophobic are also obtained, in addition to steric and electrostatic fields as shown in Fig. 5(a), 5(b), and 5(c), respectively. The contours obtained from steric and electrostatic fields were similar to those of the CoMFA model. Accordingly, only the H-bonding and hydrophobic contour maps were further analyzed.
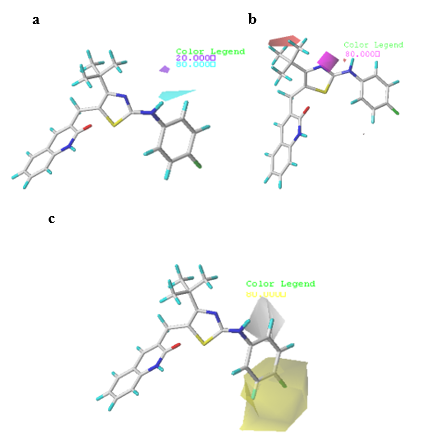
Fig. 5 Contour maps of CoMSIA analysis for compound 6. (a) H-bond donor field, (b) H-bond acceptor field, (c) Hydrophobic field.
In the HBD field (Fig. 5(a)), the cyan (80 % contribution) color denotes the HBD groups that are favored for the potency, while the purple (20 % contribution) contour designates the HBD groups, which are unfavorable for improving the potency. A small region of cyan contour near the -NH group on the bridge between the thiazole and phenyl ring of compound 6 signifies that the existence of H-bond donor groups leads to improved activity. In the HBA field (Fig. 5(b)), magenta (80 % contribution) and red (20 % contribution) colored contours represent the favored and disfavored regions respectively for HBA groups. The magenta contour around the nitro group of the thiazole showed that substituting a H-bond acceptor in this position could improve activity. Moreover, a moderately sized red contour is seen at the first position of the butyl-linked thiazole, indicating that adding HBD groups at this position is reasonable for a positive effect in activity.
Fig. 5(c) shows the hydrophobic contour map, in which the yellow areas (80 % contribution) represent hydrophobic potential associated with increased activity, while the white areas (20 % contribution) indicate hydrophilic potential. The yellow areas at the 4 and 5 positions on the phenyl ring suggest that hydrophobicity is favored on the overall activity in these regions. For instance, compound 13 having the 4-trifluoromethyl substituent on the aminothiazole phenyl ring leads to higher activity than due to the presence of the corresponding 4-methyl substituent does in compound 3. This finding is also supported by the higher pIC50 of compounds 9, 11, 13 and 15 than that of compound 4 with an methoxy-substituted group at the position 4 of the same phenyl ring. A region including white contour is located near the position 2 of the aminothiazole phenyl ring, signifying that the presence of wettable substituents in this area may increase the activity.
Y-randomization test
Table 4 shows the results of nine random shuffles for the Y-randomization test. According to the Y-randomization test, the Q2 and R2 values obtained by the ten iterations were extremely lower than those of the original models. Consequently, the probability of an accidental correlation has been ruled out, indicating that the original models obtained are extremely trustworthy and accurate.
Table 4 Q2 and R2 values of the Y-randomization test.
| Iteration | CoMFA | CoMSIA | ||
| Q2 | R2 | Q2 | R2 | |
| 1 | 0.102 | 0.366 | 0.099 | 0.351 |
| 2 | 0.009 | 0.124 | 0.002 | 0.109 |
| 3 | -0.108 | 0.082 | -0.104 | 0.078 |
| 4 | 0. 071 | 0.189 | 0.068 | 0.185 |
| 5 | -0.044 | 0.121 | -0.065 | 0.110 |
| 6 | 0.125 | 0.404 | 0.117 | 0.376 |
| 7 | 0.184 | 0.296 | 0.147 | 0.246 |
| 8 | 0.121 | 0.301 | 0.101 | 0.289 |
| 9 | -0.112 | -0.275 | -0.129 | -0.281 |
Design and prediction
The aim of this research is to develop new tubulin inhibitors. Few structural features obtained from contour maps are incorporated into the tetrahydroquinoline scaffold in the form of R1 and R2 substitutions. According to the significant structure information obtained, we determined the modified regions of this class of compounds. Considering the yellow hydrophobic contour map around the C-4 position, the phenyl ring of the molecular skeleton played a worthy role in hydrophobic contacts. The A R1 region including the white contour is located near the C-2 position of the aminothiazole phenyl ring, demonstrating that the presence of a hydrophilic substituent contributes to the enhancing activity. Electronegative groups substituted in the C-4 position of the R1 region would be beneficial for the improvement of the inhibitory activity, while electropositive groups substituted in the remaining position of R1 may increase the activity. The butyl-linked thiazole core of R2 was highlighted in green and red, indicating that adding HBD groups with less volume at this position may enhance the inhibitory activity. Consequently, four 2-oxoquinoline arylaminothiazoles (D1-D4) targeting tubulin were designed with an increased potency profile. The predicted pIC50 values of the four new compounds are significantly greater than that of compound 6, indicating that the developed QSAR models were found to be useful in the design of new and successful compounds. The structures of the newly designed molecules and their predicted pIC50 and docking scores are given in Table 5.
Table 5 New designed molecules and their predicted pIC50 and docking score
| |||||
| N° | R1 | R2 | Predicted pIC50 | Total score | |
| CoMFA | CoMSIA | Surflex Dock | |||
| The most active compound | |||||
| Comp 6 | 4-F | Tert-Butyl | 5.356 | 5.377 | 3.8095 |
| The newly designed compound | |||||
| D1 | 2-NH2-4-CF3 | Butyl | 5.696 | 5.677 | 6.1905 |
| D2 | 2-OH-4-CF3 | Butyl | 5.675 | 5.683 | 5.9665 |
| D3 | 2-F-4-CF3 | Butyl | 5.587 | 5.599 | 5.6116 |
| D4 | 2-NH2-4-CN | Butyl | 5.407 | 5.437 | 5.3914 |
Molecular docking
Following QSAR analysis, we conducted molecular docking to clarify the differences of the activity between bioactive molecules, to figure out which binding mechanisms would support the ligand-protein interaction, and to generate insights for the design of bioactive molecules in the future. Before performing the docking study, the co-crystal ligand (colchicine) was redocked into the binding pocket to verify the reliability of the docking method. As shown in Fig. 6, the redocked conformation of 3E22 was highly consistent with its co-crystallized ligand conformation and the RMSD of the two conformations was 0.326 Å (< 2.0 Å). This indicated that the performed docking protocol was reliable and could be used for subsequent study.
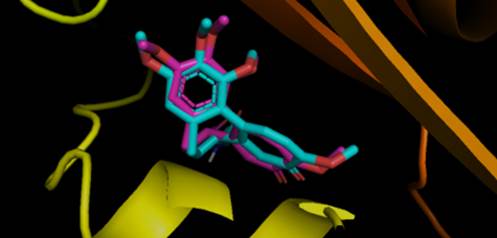
Fig. 6 Superimposition of the redocking pose (magenta) and the ligand pose in the co-crystal structure (cyan).
Docking results are listed in Table 5. The docking outcome was expressed in the Surflex-Dock as a Total Score, which calculates ligand binding affinity based on contributions from various interactions. The total score of the four newly designed compounds was investigated as judgment criteria. Newly designed compounds had a higher Total Score as compared to compound 6, indicating a greater affinity with the target protein. The newly designed compounds D1, D2, D3 and D4 and compound 6 were selected for further binding mode analysis by comparing their interactions with tubulin protein. The explanation for the difference in potency might be fairly explained in a reasonable way, implying that the binding mode of small molecules could be the real binding mode.
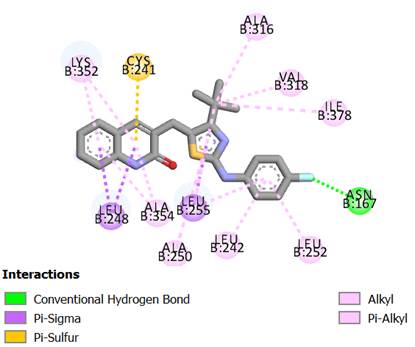
Interactive mode of compound 6 in the active site of tubulin protein
Among the selected docked compounds, compound 6 was recognized with the lowest total score of 3.8095. Fig. 7 depicts the active site of tubulin, where the fluorine group of the phenyl ring of compound 6 forms one hydrogen-bonding interaction with surrounding residue Asn 167. Another favorable pi-sigma interaction made up by Leu 248 was in contact with the quinoline moiety. Moreover, the alkyl chain on the thiazole group is buried in a hydrophobic cavity involving of residues Ala 316, Val 318 and Ile 378, and the phenyl ring forms several electrostatic interactions with the surrounding residues Leu 242, Val 238 and Leu 354, which can improve the potency.
Interactive mode of compound D1 in the active site of tubulin protein
The newly designed compound D1 was acknowledged with a maximum total score of 6.1905. The hetrifluoromethyl group of the phenyl ring on the upper right side forms a hydrogen bond with the backbone amino acid Gln 136, as shown in Fig. 8(a). In particular, two strong hydrogen-bonding interactions were also formed between the residues of Val 238 and Thr 239 and the primary amino group of the same phenyl. Hydrophobic interactions were observed between the alkyl chain of the thiazole group with residues of Val 318 and Ala 316. In addition, the 2-oxoquinoline scaffold formed an -alkyl effect with the residues Ala 316 and Lys 352, while the same effect was observed for the phenyl ring with Leu 252 and Leu 242. Also, Met 259 had an -sulfur interaction with the quinoline group of the compound D1. Noticeably, the observed interactions are stabilizing interactions and beneficial for potency.
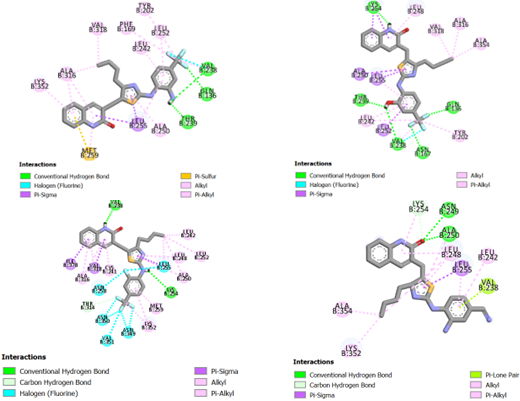
Interactive mode of compound D2 in the active site of tubulin protein
As depicted in Fig. 8(b), docking results show that compound D2 is located deep in the tubulin cavity enclosed by hydrogen bond residues. Obviously, the hydroxyl group in the second position of the phenyl ring extends into a pocket bordered by residues Thr 239 and Val 238. The primary amino group on the core forms a strong hydrogen bonding interaction with the surrounding residue Lys 254. Two strong hydrogen-bonding interactions were also formed between the residues of Gln 136 and Asn 167. Consequently, the above-mentioned groups provide significant hydrogen bonding interactions for tubulin inhibitory binding. Furthermore, the alkyl chain of the thiazole group is located against the active pocket, resulting in three hydrophobic interactions with Val 318, Ala 316, and Ala 354. The compound D2 binds to a wide pocket containing several hydrophobic interactions with residues Tyr 202, Leu 242, Leu 248, Leu 255 and Ala 250.
Interactive mode of compound D3 in the active site of tubulin protein
As shown in Fig.8(c), the primary amino group connecting the thiazole ring and the phenyl moiety of the compound D3 forms a hydrogen bonding interaction with Lys 254. Another favorable interaction of hydrogen bonding was formed by the nitrogen atom of the 2-oxoquinoline scaffold with the surrounding residue of Val 238. The fluorine atoms of trifluoromethyl on the phenyl moiety are surrounded by Asn 350, Val 351, and Asn 350, while only Ile1083 and Gln114 are observed the fluorine located at the second position of the same phenyl. The alkyl chain in the thiazole group is mainly situated in the hydrophobic pocket formed by residues Leu 242, Leu 252, Leu 248 and Ala 250. Residues of Met 259, Lys 352, Cys 241 and Ala 316 were observed to form further hydrophobic interactions with the newly designed compound D3. This may be another explanation for the stronger activity of compound D3.
Interactive mode of compound D4 in the active site of tubulin protein
The binding mode of compound D4 reveals that it bonds inside the binding pocket with a total score of 5.3914. It is clear that the oxygen atom of the quinoline moiety is surrounded by hydrogen bonding residues (Asn 249 and Ala 250), as depicted in Fig. 8(d). The same oxygen atom resides in the active pocket, forming a carbon hydrogen bond with Lys 254. A pi-lone pair interaction exists between Val 238 and the phenyl ring containing the modified substituents. It is also worth mentioning that the compound D4 also forms several hydrophobic interactions.
Molecular dynamics simulation
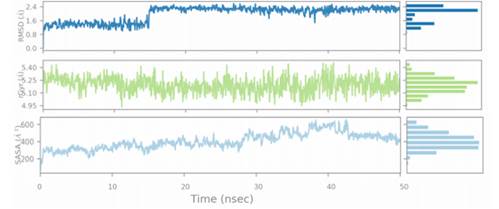
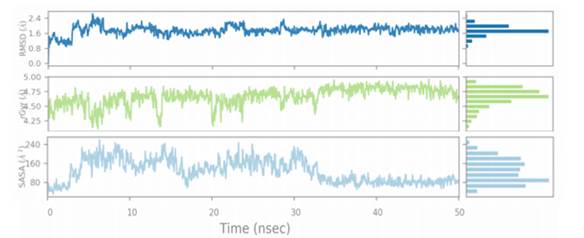
The 50 ns MD simulation was performed with 3E22-colchicine in complex with tubulin and two selected tubulin-compound complexes (Compound D1 and Compound 6) to examine the stability of protein-ligand interactions. Fig. 9 represents the plot of RMSF of compound D1 backbone atoms during 50ns simulation times, while Fig. 10 shows the plots of RMSD, Rg, and SASA of the protein-compound D1 complex. Fig. 11 depicts the plot of RMSF of compound 6 backbone atoms during 50ns simulation times, while Fig. 12 shows the plots of RMSD, Rg, and SASA of the protein-compound 6 complex.
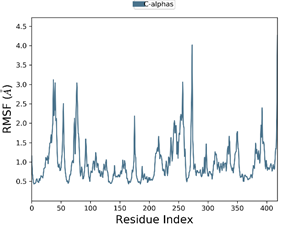
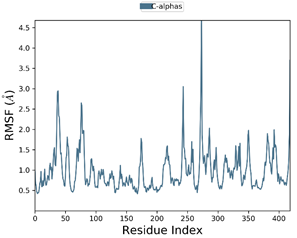
To characterize the flexibility of residues present in the protein during 50 ns, RMSF values were also calculated. As shown in Fig. 9, a low RMSF is detected for most of the residues during the interaction of the Compound D1 bound complex, signifying that the protein has good dynamic stability. Whereas slightly non-significant fluctuations were observed for the binding of Compound 6 to the target protein as depicted in Fig. 11. The highest degree of flexibility is detected for compound D1, since less fluctuation means greater protein structural stability.
Fig. 10 displays the RMSD of the heavy atoms of tubulin over 50 ns. The RMSD of the compound D1 bound complex levels off at 1.62 after 15 ns, indicating that the docking complex has entered a metastable state, and then an equilibrated system is obtained in complex D1 for the rest of the time. The curve of the Compound 6 bound complex went up slightly with much more deviation in the RMSD plot, and then turned into a sustained period of stability. RMSD analysis indicates that the designed molecule D1 forms a stable complex with the protein throughout simulations. The radius of gyration (Rg) was also applied to represent the changes in the compactness of the protein structure throughout the simulation time (Figures 10 and 12). It is revealed from the Rg plot that the Rg values of Compound D1 bound complex varied in a small range of 4.95 and 5.40 for 50ns. However, the values basically stabilized in the same range after 11 ns until the end of the simulation. The Rg plot shows that there is some change in the compactness of the folding of tubulin after binding of compound 6. The Rg results indicate that the ductility of the protein was good for compound D1 throughout simulation time. Similarly, the SASA analysis was explored to determine the solvent accessibility of the complex (Figures 10 and 12). The SASA of the protein-Compound D1 complex fluctuated between 190 and 675 during the MD simulations and the average value of SASA was found to be 16342. Furthermore, the SASA plot revealed that the structure of Compound 6 was relatively instable during the simulation time.
Overall, the RMSF, RMSD, Rg and SASA results, strongly support the docking findings, suggesting that Compound D1 could be the most effective ligand for modulating tubulin activity.
Conclusion
For the objective of developing 3D-QSAR models based on Ligand-guided CoMFA and CoMSIA methods, a dataset of 25 2-oxoquinoline arylaminothiazole derivatives as potent tubulin inhibitors with cytotoxicity activity against the HeLa cancer cell line. The findings of two accurate CoMFA and CoMSIA models were used to clarify the relationship between the reported derivatives and their inhibition mechanisms. Consequently, four novel tubulin inhibitors (D1, D2, D3, and D4) were designed based on the important information unveiled by the contour maps. The four new inhibitors and compound 6 were chosen for further binding mode analysis by comparing their interactions with tubulin protein, indicating that all designed compounds, especially compound D1, remained stable inside the identified protein. Finally, two ligand-protein complexes (compound D1 and compound 6) were subjected to 50 ns MD simulation, and D1 verified the accuracy of the docking findings, indicating that our research has effectively revealed the binding mechanism of tubulin inhibition, which may be useful in the development of new selective tubulin inhibitors.
Therefore, it must be checked whether this type of sterilization does not produce changes in its physico-chemical properties or does not cause a significant loss of content, which affect the therapeutic effect. Based on the obtained results, it was ascertained that MS-MS spectroscopy technique is appropriate to be employed as an important method in monitoring the radiosterilization of tryptophan isomers and/or pharmaceutical delivering systems containing tryptophan as main ingredient.
The changes detected by DSC correspond to the differences indicated by HPLC i.e., a small mass loss of the active substance, which means that tryptophan isomers are resistant to ionising radiation (radiochemical stability) thus being safely subjected to sterilisation by irradiation.

