


 nova página do texto(beta)
 Inglês (pdf)
 Artigo em XML
 Referências do artigo
 Enviar este artigo por email
 Citado por SciELO
  Similares em
SciELO
Similares em
SciELO 
 Permalink
Introduction
Allopurinol, 1,2-dihydro-4H-pyrazole [3,4-d] pyrimidine-4-one (Scheme 1), is an active ingredient that reduces uric acid levels and tophi volume. This drug blocks the action of an enzyme, xanthine oxidase, which is involved in uric acid metabolism; it is often used to treat gout and hyperuricemia. It is weakly acidic in nature (pKa 9.4) and remains unionized in the acidic gastric media, resulting in faster absorption by the stomach. The main absorption site for Allopurinol is the duodenum and upper jejunum, while its absorption is slower and incomplete in the lower jejunum. While Allopurinol (Allop) controls uric acid levels, it can also have undesirable effects on the body, such as hypersensitivity reactions, skin rashes and gastrointestinal upset [1,2]. The biological half-life of Allopurinol is 1 to 3 hours, so it should be taken more frequently and clearly indicates the need to develop sustained-release formulations. To overcome such problems, a method is being sought to design a dosage form that allows the drug to be released gradually. In this sense, the microencapsulation process has been used as one of the techniques to develop a formulation for the administration of drugs in a controlled manner [3-7].

The microencapsulation method by solvent evaporation process is one of several methods that have been developed for the formulation of microparticles. It is widely used for the formulation of microparticles due to its ease of manufacture without affecting the activity of the drug. Various delivery systems have been developed for the controlled release of Allopurinol [7-10].
In addition, several carrier systems have recently been used to produce fast-release solid formulations. Cellulose derivatives such as ethylcellulose (EC) [11-18] and hydroxypropylmethylcellulose HPMC [12, 15, 19, 20] with non-toxic and non-irritating properties, as well as hydrophilic properties, were selected for the development of controlled-release technology in the formulation of pharmaceutical products.
Therefore, the biocompatibilities of different biodegradable polymers such as poly (ε-caprolactone) PCL [18, 21, 22, 23] as candidate materials for different biomedical applications have been extensively investigated. Then, due to their broad spectrum of physical properties and hydrolytic degradation profiles, they have become attractive candidates for human use as surgical sutures, implantable devices, and drug delivery systems by the United States Food and Drug Administration (FDA) [24-26].
Furthermore, cyclodextrins (CDs) are cyclic (α-1,4)-linked oligosaccharides of D-glucopyranose that contain a relatively hydrophobic central cavity and a hydrophilic outer surface. They are often used in the food, pharmaceutical, and chemical industries (encapsulation in agriculture, analytics, and cosmetics) [27]. For controlled delivery [28], the drug-CD binary systems are also useful in the development of dosage forms to increase the solubility, dissolution, and absorption rates of poorly soluble drugs in tablet or capsule form [29].
Our research group recently reported on the production of HCTZ loaded microspheres using various matrices such as ethylcellulose, poly (ε-caprolactone), β-cyclodextrin and poly (methyl methacrylate) (PMMA), synthesized in different fractions to investigate their effects on encapsulation efficiency and drug release kinetics [18]. Continuing our efforts to discover new drug formulations that gradually release the active ingredient to remedy the deficiencies of conventional dosage forms and, in particular, to avoid the need for repeated administrations [18], we present Allopurinol encapsulation using various matrices with different compositions such as EC, HPMC, β-CD and PCL, so the solvent evaporation method is used for the sustained release of this active ingredient. The study also aimed to characterize the Allop interaction with these carriers in the solid-state using Fourier transform infrared spectroscopy (FTIR), powder X-ray diffraction (PXRD) to check the dissolution behavior of microparticles. The main objective was also to evaluate the effect of polymers on encapsulation efficiency and drug release kinetics in the gastric tract.
Experimental
Materials and methods
Chemicals
Allopurinol powder (MW: 136.1115 ± 0.0054 g/mol) was kindly provided by the laboratory of Therapeutic Chemistry, Faculty of Medicine and Pharmacy of Rabat, Mohamed V University, Morocco, ethylcellulose (viscosity; 0.22 Pas of 5 % by mass in toluene/ethanol solution extent of labeling: 48 %) and hydroxypropylmethylcellulose (HPMC) were purchased from SIGMA-ALDRICH, β-cyclodextrin (β-CD) from Sigma-Aldrich (USA), PCL (purchased from SIGMA-ALDRICH), Mw=70000-90000 g/mol, hydrolyzed polyvinyl alcohol (PVA; 87-90 % hydrolyzed SIGMA ALDRICH, Mw = 30000-70000 g/mol). Dichloromethane (DCM, purity> 98 %). To prepare a simulated gastric fluid solution (pH 1.2), 2 g of NaCl and 60 ml of HCl solution (1 M) are dissolved in 1 L of deionized water. A solution of phosphate buffer pH 7.4 was prepared by mixing a volume of 250 ml of the potassium phosphate monobasic (KH2PO4) solution (0.2 M) with 195.5 ml of sodium hydroxide solution (NaOH ) (0.1 M) then adjusted to 1L by deionized water.
Methods
Preparation of solid dispersions
One or more polymers (depending on the case) were dispersed with Allopurinol by the solvent evaporation method in a weight ratio (polymer(s):drug): 2:1 (% allop / Pol = 50 % by mass)) to prepare solid dispersions of Allopurinol. First, the Allopurinol and polymeric carriers were dissolved in a water-immiscible organic solvent, dichloromethane (DCM) 32g. This organic solution is poured into deionized water (100 g) as an external phase containing 1 % w / v of PVA (PVA / water content = 1 % by mass). Then, the organic phase was emulsified with the continuous phase under mechanical stirring at two stirring speeds (300 or 800 rpm) in a glass reactor (600 ml, Ø = 80 mm) using a six or four-blades (as the case) turbine impeller stirrer (blade length = 50 mm, blade width = 8 mm, IKA, RW20 digital, UK). Allop microencapsulation is completed after 3 hours at room temperature, the time required for the solvent to evaporate. The resulting microparticles were separated by vacuum filtration and washed several times with ionized water and dried in a CaCl2-containing desiccator for at least 48 hours. The starting composition of the various microspheres prepared with the formulation is summarized in Table 1.
Table 1 Processing conditions for the formulations of prepared microspheres.
| Lot no | Composition (matrix-drug) | Stirring speed/min-1 | Number of blades |
|---|---|---|---|
| F1 | EC-Allop | 300 | 4 |
| F2 | EC- Allop | 300 | 6 |
| F3 | EC- Allop | 800 | 4 |
| F4 | EC- Allop | 800 | 6 |
| F5 | PCL- Allop | 300 | 4 |
| F6 | EC/PCL(50/50/)- Allop | 300 | 4 |
| F7 | EC/βCD(50/50)- Allop | 300 | 4 |
| F8 | EC/PCL/βCD(50/25/25)-Allop | 300 | 4 |
| F9 | EC/HPMC(80/20)- Allop | 300 | 4 |
| F10 | EC/HPMC(50/50)- Allop | 300 | 4 |
Microspheres characteristics
In the preparation of microspheres formulations, the drug and polymer may be in close contact with each other, leading to drug instability prediction studies. Drug-polymer interactions are very important in selecting a polymer. Several methods have been used to detect compatibility between Allopurinol and selective polymers.
Fourier transforms infrared spectroscopy (FTIR)
FTIR spectra of the drug, polymers, and microparticles in its powder form were obtained in the spectral wavelength range from 400 to 4000 cm-1, by ALPHA BRUKER IR spectrometer.
Powder X-ray diffraction
The XRD patterns of pure drug, carriers, and the loaded microspheres formulations were recorded with a RIGAKU MINIFLEX 600 (logical acquisition mini flex) (y=1.541A) in the 2θ range from 5 to 70 °) and they examined for comparison.
Particle size analysis
The mean diameters and size distribution of microspheres were calculated from the results of optical microscopy (Optika 4083.B1), by counting more than 500 microparticles for each preparationand the expressions the number mean diameter (d10), the surface mean diameter (d32), the weight mean diameter (d43) and size distribution (δ) are given below:
Scanning electron microscope of microparticles
The detailed surface characteristics and the morphology of allopurinol microspheres were observed using a scanning electron microscope (Quanta 200, EDS microanalysis).
Determination of drug loading and microparticles yield
The uniformity of drug content for each formulation was determined by extraction in phosphate buffer at pH 7.4 and measuring the drug content spectrophotometrically at 250 nm (7375 L mol −1 cm −1 ) (UV Spectrophotometer model Shimadzu UV-2401). 10 mg of microparticles (with different polymers or supports) are dispersed in 50 ml of phosphate buffer pH 7.4 using a 100 ml volumetric flask and then was stirred for 60 min. The solution was completed to 100 mL with phosphate buffer and shaken well. After filtration, 2 ml of the solution was taken and diluted to 10 ml with the buffer solution of pH 7.4 [30] then examined at 250 nm to determine the content of allopurinol. Each determination was performed in triplicate.
Eq. (5) shows the expression of loading efficiency (Allop loaded %) which is defined as the ratio of Allopurinol mass in microspheres and the mass of microspheres.
Percentage practical yield (PY) is calculated by the following equation
In vitro Allopurinol release measurements
The in vitro dissolution test of allopurinol from the obtained formulations was carried out using a suitable glass dissolution reactor immersed in a bath regulated at 37 ± 0.5 ° C at a stirring speed of 100 ± 1 rpm. An accurately weighed amount of each formulation equivalent to 100 mg of microspheres was placed into the glass dissolution reactor, filled with 900 mL of simulated liquid at pH 1.2. Aliquots, each of 5 mL, were withdrawn from the dissolution medium at specified time intervals and replaced with the same volume of prewarmed (37 ºC ± 0.5 ºC) fresh dissolution medium. The drug concentrations were analyzed by UV-Vis spectrophotometer (Shimadzu UV-2401) at the appropriate wavelength for the gastric medium: ( max=250 nm (6788L. mol −1 cm −1 ). The amount of Allopurinol present in each batch was determined spectroscopically and the corresponding drug release profiles were plotted by graphs of the cumulative percent drug release (calculated from the total amount of allopurinol contained in each formulation) versus time. The dissolution study for each batch was performed in duplicate, and the mean readings were used for the calculation. Two mathematical models recording the Higuchi and Korsmeyer-Peppar equations, have been developed, to elucidate drug transport processes and to predict the resulting drug release kinetics [31-34].
Results and discussion
Microspheres characterizations
Excipients were integral components of almost all pharmaceutical dosage forms. The successful formulation of a stable and effective solid dosage forms depends on the selection of excipients which are added to facilitate the administration of drug and protect it from degradation.
In this context, ten microparticles were characterized in terms of shape and surface morphology, drug entrapment and size (mean diameter). The development of ten formulations loaded with allopurinol with various polymers by the solvent evaporation process using various proportions of polymer at different experimental conditions gave varying sizes (average diameter) and surface morphologies and different drug entrapment. The results of drug loading (Allop loaded %), Percentage practical yield (Yield %) and size distribution are also provided in Table 2.
Table 2 Microencapsulation results for the prepared microspheres.
| Lot | DL% | Yield % | D10/µm | D32/µm | D43/µm | Δ |
|---|---|---|---|---|---|---|
| F1 | 33±3.72 | 62 | 123.9 | 151.01 | 163.1 | 1.31 |
| F2 | 31.70±1.03 | 64 | 107.96 | 140.86 | 154.44 | 1.43 |
| F3 | 10.46±1.45 | 40 | 42.76 | 52.60 | 56.36 | 1.31 |
| F4 | 23.98±0.60 | 62 | 34.72 | 47.71 | 52.80 | 1.52 |
| F5 | 23,35±1.65 | 76 | 46.9 | 77.22 | 89.70 | 1.91 |
| F6 | 24.017±3.03 | 92 | 61.52 | 111.25 | 126.35 | 2.05 |
| F7 | 46.40±0.5 | 56.66 | 74.55 | 118.11 | 131.48 | 1.76 |
| F8 | 35.17±2.62 | 56 | 105.57 | 118.121 | 124.56 | 1.17 |
| F9 | 14.05±0.89 | 65.33 | 80.1 | 101.82 | 107.76 | 1.34 |
| F10 | 34.72±1.07 | 58 | 91.08 | 113.83 | 122.12 | 1.34 |
DL - drug loading,Yield % - Percentage practical yield
In all formulations, the drug content was found to be between 10.46 % and 46.40 % and the practical yield was found to be between 40 % and 92 %. The low yield observed in formulation (F7, F8, F9 and F10) can be caused due to the water solubility of both HPMC and β-CD and their possible transfer to the external phase (water). Other, the decrease in the yield of formulation (F3) containing EC polymer may be due to migration of small sizes microparticles during filtration.
The effect of stirring speed (800 or 300 rpm) and number of blades (four or six) is notable in microspheres (F1- F4). It was observed that under the same operative conditions, increasing stirring speed and number of blades affected the microspheres characteristics: microsphere sizes [17,23,34] and drug content [34-36]. The microspheres (F3 and F4) (Fig. 1(c), (d)) are perfectly individualized, spherical in shape and smaller than the microspheres (F1 and F2). Indeed, we have obtained a rough and porous surface for microspheres F1 and F4 respectively (Fig. 1(a), (d)) and smooth surface and small pores for microspheres F2 (Fig. 1(b)). The particle size distribution tends to become smaller in size and also if the speed of the stirrer is increased the mean particle size is decreased. We note that the mean Sauter diameter (d32) was reduced from 151.01μm for F1 to 52.60 μm for F3 and from 140.86 μm for F2 to 47.71 μm for F4 for an increase in stirring speed from 300 to 800 rpm and number of blades, the distribution (δ) was further improved from 1.52 to 1.31. The effect of the increased stirring speed and number of blades described in the table II shows their direct action on the actual drug loading. It is obvious that increasing stirring speed from 300 to 800 rpm decreased the drug content. Similar findings have been reported by Mouffok et al. (2016) [17]. On the other hand, the decrease in the number of blades at high speed (800 rpm) decreases the drug content from 23.98 % for F4 (6 blades) to 10.46 % for F3 (4 blades).
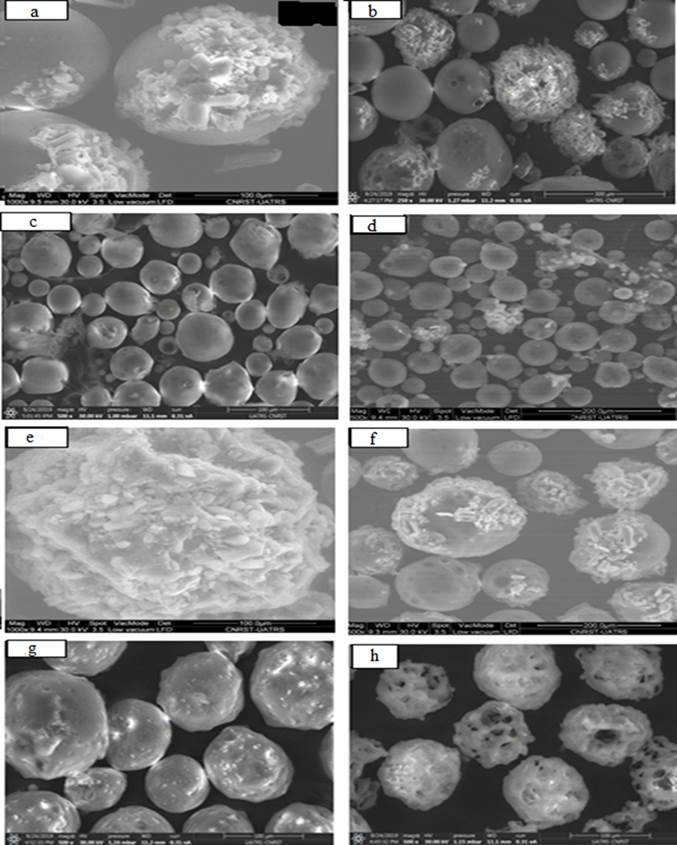
Fig. 1 SEM micrographs of the surface and the morphology of the Allopurinol loaded microspheres prepared ((a)F1; (b)F2; (c)F3; (d)F4; (e)F5; (f)F8; (g)F9 and (h)F10).
In the other hand, the high drug content is the function of the characteristics of polymer, drug, surfactant and crosslinking agent, etc. Knowing that Allopurinol is hydrophobic in nature, there was less chance for diffusion of the drug away from the polymer network during preparation [37,38]. Under the same operative conditions, the drug loading, yield and mean Sauter diameter (d32) are found to be dependent on the choice of the polymer and its viscosity. Also, the product yield depended upon the agglomeration and sticking of polymer to blades of stirrer and to the wall of the beaker during microsphere formation.
So, the formulations of different ratio of β-CD (F7 and F8) showed the presence of high drug content and low practical yield (Table 2) which indicates that the drug is uniformly dispersed in the powder and well loaded in the sphere formulation. However, β-CDs are quite soluble in water; can form water-soluble complexes with lipophilic guests that hide in the cavity of CD [39,40], which explains the high value of the drug content: 46.40 % for F7 and the low values of the yield observed in the microspheres F7 and F8. The incorporation of PCL matrix in F8 microspheres compared with F7 formulation has not changed in the surface mean diameter of the microparticles. On the other hand, the distribution (δ) was improved from 1.76 to 1.17 for F7 to F8 respectively.
Encapsulation of Allopurinol with PCL resulted in the appearance of crystals on the surface of microspheres (Fig. 1(e)). Microsphere formation is a phase separation process. Both the polymer and the drug precipitate after solvent diffusion into the aqueous phase and subsequent evaporation. The formation of visible allopurinol crystals will depend on whether the drug precipitates before the polymer or vice versa. Several papers discussed the importance of solvent/non solvent/ polymer interactions on the successful drug entrapment [41,42]. The diffusion of the water-immiscible organic solvent into the aqueous phase (non-solvent), which causes polymer precipitation, depends on the water solubility, stirring speed and removal of the organic solvent at the water/air interface. Allopurinol precipitated before PCL which explains the formation of crystals on the surface of the microspheres.
This finding has been shown in F8 microparticles containing EC, PCL and β-CD at different fractions (Fig. 1(f)) where the surface of β-CD -microspheres was irregular and drug crystals were visible when compared to the smooth and crystal-free surface of other microspheres (Fig. 1(a-d)) containing EC alone. This reasoning was further substantiated by sudden and rapid release of Allopurinol observed from F5 microspheres which will be detailed in release study.
It was also observed that the drug content was average and of the order of 23.35 % for F5 and 24.01 % for F6. Moreover, the number mean diameter (d10=46.9 µm) of (PCL/Allop) microspheres (F5) was lower than that of the EC-PCL-Allop microspheres (F6: d10= 61.52 µm).
In contrast, it was found that the yield of the microspheres containing HPMC polymers was found to be decreased with increase in the concentration of the HPMC polymers: F10 (EC: HPMC 1:1) to F9 (EC:HPMC 4:1). This may be due to migration of HPMC into continuous phase forming agglomerates accompanied with sticking of the polymer to the stirrer blade and beaker surface [15, 43].
It has been observed that the drug content of the microspheres containing high concentration of HPMC polymers (F10) has been increased (Table 2). This may be due to an increase in the entrapment of drug in the swollen or gel structure of HPMC. The number mean diameter of microspheres containing HPMC polymers was found to be in the range of 80.10 µm for F9 to 91.08 µm for F10.
The results of both the optical and the scanning electron microscopy analyses identified the morphology and surface of microparticles containing HPMC (Fig. 1(g) and (h)) were a rough and undulating surface in F9 (Fig. 1(g)) and irregular in shape, rough and very porous weak surface for F10 (Fig. 1(h)). The same result was reported by Khoukhi et al. (2016) [20].
FTIR spectroscopy
The infrared spectra of the microspheres (selected formulations) are compared with the Allopurinol and the spectra of the polymer matrices in Fig. 2. The FTIR spectrum of pure Allop (Fig. 2(a)) is characterized by an absorption band at 3169.58 cm-1 at high frequency, largely attributed to the NH stretch band of the secondary amine group, and shows a stretch vibration of CH at 3041.77 cm-1 denoting a CH stretching vibration of the pyrimidine ring. At low frequencies the 1697.41 cm-1 band exhibits C=O stretching vibration of the keno form of 4-hydroxy tautomer. Other characteristic bands are mainly attributed to C-N stretching and C-C ring stretching respectively at 1582.95 cm-1 and 1476.69 cm-1. The FTIR spectrum of Allop also showed characteristic signals at 779.22, 810.50, 911.62 and 1226 cm-1 denote CH in plane deformation.

Fig. 2 FTIR spectra of (a)- Allop, (b)- EC, (c)- PCL, (d)- HPMC, microparticles: (e)-F1, (f)-F5 and (g)- F10.
The IR spectrum of PCL alone (Fig. 2(c)) exhibited major bands at 1361.38 cm-1 and 1470.91 cm-1 for C-H stretching bands of the symmetric and asymmetric methylene group respectively. The stretching vibration of the ester function reaches a maximum of 1723.54 for C=O. The other characteristic band is attributed to the symmetry of CH2 and the asymmetry of CH2 at 2868.44 cm-1 and 2941.88 cm-1, respectively.
Analysis of infrared spectrum of the microspheres (Fig. 2(f)) compared to the spectra of allopurinol and the PCL matrix showed the presence of similar characteristic bands of polymers and Allop in the Allop-loaded microspheres, indicating that there was no chemical interaction with the polymers. The same result was obtained by studying the IR spectra of other microspheres (Fig. 2(e), (g)). It was clear that all characteristic bands of Allopurinol and its formulations containing EC, PCL and HPMC appeared nearly in the same regions and at the same ranges and no new bands appeared which confirms the absence of any chemical interaction between drugs and polymers. We also notice a variation in the transmittance values which is due to varying drug and polymers concentrations.
X-ray diffraction (XRD) studies
The XRD patterns of Allop, carriers and the corresponding formulations are shown in Fig. 3. The presence of many diffraction peaks in the Allopurinol diffractogram (Fig. 3(a)) indicates that the drug was in its crystalline form and the very intense peaks at 11.84°, 14.64°, 17.13°and 27.95° have been selected as characteristic peaks for Allop [30]. Comparison of the X-ray diffraction pattern of allopurinol and its formulations with EC, β-CD and HPMC shows the appearance of majorities of allopurinol peaks in the microparticles diffractograms but with lower intensity which indicates a slight reduction in the crystallinity of allopurinol in the formulations (Fig. 3(e), f and g) [44].

These differences in solid phases are responsible for the differences in drug solubility [45,46]. The X-ray diffraction studies show that HPMC (Fig. 3(g)) is more efficient in reducing the crystalline state of Allopurinol than (-CD (Fig. 3(e)). These results suggest that the polymer must have a suitable molecular length and concentration. This enables formation of a polymer net on the crystal surface or between drug molecules which results in optimum orientation of proton donating and receiving groups and a strong interaction between drug and polymer [47,48].
In vitro dissolution of Allopurinol from formulations
Pure drug and all ten formulations were subjected to in vitro dissolution studies in simulated gastric fluid (pH 1.2). Samples were taken at different time intervals, filtered and analyzed at 250 nm. The purpose of this study was to observe the release pattern of the drug from the solid dispersion using various excipients such as EC, PCL, β-CD, HPMC. Also, the effects of stirring speed and the number of blades were studied only for EC microspheres in particular. On the other hand, the influence of various factors such as the microparticles characteristics; namely the particle size, nature of the matrix was valued. The dissolution profiles of the pure drug and drug-carrier binary system are shown in Fig. 4, and the results obtained within the in vitro drug release of pure Allop and all formulations from F1 to F10 are shown in Table 3.
Table 3 Data of % allop released after 30 min, 1 hour, 2 hours and 8 hours.
| lot | % Allop released | |||
| 30 min | 1 hour | 2 hours | 8 hours | |
| Allop (pure) | 90.33 | 93.17 | 92.89 | 92.89 |
| F1 | 38.66 | 42.59 | 46.06 | 59.46 |
| F2 | 59.43 | 60.10 | 60.43 | 67.63 |
| F3 | 65.62 | 72.17 | 87.44 | 100 |
| F4 | 48.60 | 53.46 | 58.51 | 70.10 |
| F5 | 67.88 | 68.53 | 68.20 | 71.52 |
| F6 | 13.08 | 15.95 | 19.59 | 48.27 |
| F7 | 70.62 | 99.53 | 100 | 100 |
| F8 | 46.81 | 51.14 | 54.68 | 71 |
| F9 | 68.35 | 65.55 | 63.49 | 63.48 |
| F10 | 78.92 | 100 | 100 | 100 |
It is noted that all the formulations underwent an initial phase of linear release followed by equilibration.

Firstly, the effect of stirring speed (800 or 300 rpm) and number of blades (four or six) is notable in drug release of microspheres (F1-F4) and are also given in Fig. 5. As already pointed out in the discussion of the effect of the stirring speed on the size of microparticles, this last one influences the rate of drug release. In the case of the F3 formulation, the size of microparticles decreased as the impeller speed increased (800 rpm). As a result, the surface contact of microparticles with the released medium increased and the drug release was favored. Same results were previously reported by Jeong J.C et al [49] and C. Yunpeng et al [50].

Fig. 5 Effect of stirring speed and number of blades in dissolution of allopurinol from formulations.
Also, the presence of pores or craters on the surface of the microparticle increases the contact surface and facilitates the penetration of water into the matrix, facilitating the dissolution and release of the drug [51,52]. This is observed in the formulation of F2 compared with F4 which has a smaller size than F2. The SEM image recorded in the Fig. 1(b) and d shows the presence of the active ingredient powder and the porosity of the surface of F2 compared with F4. Nevertheless, the release rate was faster from F2.
However, the release of the active agent was inversely proportional to the size of the microspheres. Fig. 5 shows that cumulative release was slower from larger microspheres (F1) [53,54] and too due to the lower porosity of the surface of this formulation [23] (Fig. 1(a)). The burst release is noted at the start of the release process from the F1 formulation (38.66%) after 30 min is due to the crystals of the drug on the surface of the microspheres (Fig. 1(a)).
Secondly, this present study was also aimed to observe the drug release pattern from the microspheres using different excipients such as EC, PCL, (-CD and HPMC, obtained under the same operating conditions: impeller speed (300rpm), four blades, and drug/polymer ratio (1:2). The efficacy of these excipients on drug release was also evaluated in terms of in vitro drug dissolution and compared with pure drug dissolution.
The drug release profiles from the microspheres (F1, F5-F10) after 480 min and 120 min in the gastric tract are as shown in (Figures 6 and 7). We were surprised by the maximum dissolution of pure drug after 30 min. The formulation of allopurinol by different polymer matrices moderated its release. Thus, after 30 min of release in acidic medium at pH = 1.2, the drug percentages were 90.33 %, 78.92 %, 70.62 %, 68.35 %, 67.88 %, 46.81, 38.66 and 13.08 % for Pure Allop, F10, F7, F9, F5, F8, F1 and F6 respectively. Moreover, the percentages of drug dissolved from the formulations F10 and F7 are 100 % after 120 min. It is clear that the effect of the size and nature of matrix in the microspheres is notable for drug dissolution.
Indeed, the percentages of drug released by Pure Allop, F1, F5, F6, F7, F8, F9 and F10 after 2 hours (the time corresponding to the retention of the drug in the human stomach) are 92.89 %, 46.06 %, 68.20 %, 19.59 %, 100 %, 54.68 % 63.49 and 100 % respectively. These results can be explained by the competition of the various effects such as the size, the porosity of the microparticles and the nature and the viscosimetric mass of the polymer, on the dissolution rate of allopurinol.
Formulation F1 contains EC alone shows good drug release (46.06 %) compared with formulation F6 (EC + PCL) which has a percentage cumulative drug release equal to 19.59 %. The hydrophobic nature of PCL viscometric mass Mv between 70000-90000 explains the low release of Allopurinol from F6 formulation. Nevertheless, it is also observed that PCL microspheres (F5) exhibited a higher drug release rate (68.20 % after 2h) compared to the EC/ PCL based microspheres (F1 and F6). This enhancement may be due to the small diameter of the microspheres prepared with PCL (d32 = 77.22 μm) than the EC (F1) (d32 = 151.01 μm) and F6 (EC+PCL mixture) (d32 = 111.25 μm). It should be noted that the surface contact of the microparticles of small size (F5) with the released medium increases and drug release will then be promoted [49,50].
Turning now to the formulation F7, the use of (-CD as a release enhancer of Allopurinol from its formulation was shown in Figures 6 and 7. The presence of (-CD in the F7 formulation improves the solubility of the microspheres by reducing the interfacial tension between the sparingly water-soluble drug and the dissolution medium [15,18,20,55]. The rapid dissolution was observed in formulation F7 release 70.62 % of drug at the end of 30 minutes and almost completely release (99.53 %) at 60 minutes only. These results are also in agreement with E.M. Samy et al [56], who found that the (-CD gave a greatly enhanced release rate of Allopurinol from suppositories containing the complex. The reduction of drug crystallinity [57, 58] explains its rapid dissolution.


Really, the effect of the PCL was more pronounced which did not show good drug release, e.g. F8, the release of Allopurinol was found to be 71 % after 480 min. In this case, the decrease in the effective diffusion coefficient of the drug [15] can be explained by the effect of hydrophobic nature of PCL and of its viscosimetric mass.
Also, the percentage of drug released after 30 min was found to be 46.81 %. This percentage can be caused by the probable presence of high concentrations of Allop near the surface of microparticles (Fig. 1(e)).
In the other hand, the size of the EC / HPMC microparticles has no effect on drug release because cumulative release of drug from F10 is more speed compared from F9, where the surface mean diameter of F10 (d32= 113.83) microspheres is equal to or slightly greater than that of formulation F9 (d32= 101.82). In fact, the effect of HPMC concentration on the release rate of Allop-loaded microspheres is given in Fig. 8. The dissolution efficiency increased for the microspheres composed of EC/HPMC in the ratio of 50/50 (F10). It reaches a percentage of 100 % after 60 minutes. Clearly, the rapid drug release from this formulation was ascribed to its higher drug content and morphology (Table 2 and Fig. 1) where had a loose and porous weak matrix structure.

The formulation prepared with a (EC/HPMC: 80/20) ratio, reaches equilibrium after 30 minutes, a release percentage of 68.35 %. This burst effect phenomenon can be caused by hight concentration of EC and the probable presence of the crystals of drug on the surface of the microspheres (Fig. 1(g)) of drug near the surface of microparticles.
However, the rapid drug release of these formulations compared to the F1 formulation was ascribed to hydrophilic nature of HPMC, which, when combined with EC, increases the release of Allopurinol dispersed in the matrix microspheres and provides its control [20].
Finally, the formulation of Allopurinol moderated and controlled release. A low release rate was obtained with the formulations which contain the PCL as hydrophobic matrix and a very high rate in the formulations based on the hydrophilic matrix such as (-CD and HPMC.
Release mechanisms and mathematical analysis
The mathematical evaluation of the in vitro release of the drug has been done using two diffusion models: the Higuchi’s and the Korsmeyer’s model [33, 34]. Thus, the correlation coefficient r2 obtained after tracing experimental results according to the equations corresponding to the selected models provides for the choice of the best model.
Higuchi
Korsmeyer-Peppas
Where M t /Mi is the fractional drug release; the Higuchi’s and the Korsmeyer’s release constants, are K H and K K respectively; n the release exponent which characterizes the release mechanism. In fact, Higuchi's model describes the release of soluble or poorly soluble drug in water from semi-solid or solid matrix systems [33] and the value of n used by Peppas [59] characterizes the different release mechanisms. The release mechanism is of the type: Fick diffusion when n = 0.5 and time-dependent, and it is non-Fickian if n is between 0.5 and 1 case II transport if n = 1, and super case II transport if n > 1. Then, if n < 0.5, the diffusion mechanism can be related to the quasi-Fickian model. Results of data analysis are provided in Table 4.
Table 4 Coefficients of correlation, dissolution rate constants and diffusivity coefficients of Allopurinol from microspheres in simulated gastric fluid.
| Lots | Higuchi | Korsmeyer-Peppas | Dt,c (cm2 sec-1) | Dt,l (cm2 sec-1) | |||
| KH | R2 | LnKKP | n | R2 | |||
| F1 | 1,659 | 0,988 | -1,170 | 0,15 | 0,994 | 2,5896E-09 | 1,86E-08 |
| F2 | 9,149 | 0,923 | -0,615 | 0,17 | 0,962 | 6,3188E-08 | 4,30E-07 |
| F3 | 10,992 | 0,992 | -1,800 | 0,43 | 0,991 | 8,38622E-09 | 2,36E-08 |
| F4 | 2.262 | 0.960 | -1,064 | 0,16 | 0,977 | 4,0486E-10 | 3,02E-09 |
| F5 | 17,758 | 0,992 | -1,152 | 0,34 | 0,980 | 4,9189E-08 | 1,65E-07 |
| F6 | 0,989 | 0,991 | -2,208 | 0,25 | 0,993 | 9,74351E-10 | 3,14E-09 |
| F7 | 13,206 | 0,994 | -2,039 | 0,51 | 0,994 | 5,79881E-08 | 1,41E-07 |
| F8 | 3,984 | 0,987 | -1,138 | 0,20 | 0,993 | 8,5269E-09 | 4,97E-08 |
| F9 | 10,554 | 0,978 | -0,764 | 0,21 | 0,987 | 3,2348E-08 | 1,99E-07 |
| F10 | 10,486 | 0,998 | -1,323 | 0,34 | 0.998 | 3,6033E-08 | 1,87E-07 |
The correlation coefficients and dissolution rate con stants of allopurinol from microspheres according to the models studied in gastric-medium are summarized in the Table 4. In general, from the results presented in Table 4 and on basis of the values of the coefficient of determination (r2), the best fitting was found in Korsmeyer-Peppas’s model, exceeding the value of 0.96 for all formulations except for F5 (r2 = 0.992) in Higuchi’s model which is composed of PCL as matrix. The results demonstrated that the release mechanism of Allop is governed by the diffusion phenomenon.
Also, the values of dissolution rate constants of drug in simulated gastric fluid (pH 1.2) equal to 17.758 min-1/2 for F5; 13.206 min−1/2 for F7; 10.992min−1/2 for F3; 10.554 min−1/2 for F9; 10.486 min-1/2 for F10; 9.149 min-1/2 for F2; 3.984 min-1/2 for F8; 2.262 min-1/2 for F4, 1.659 min-1/2 for F1 and finally 0.989 min-1/2 for F6. Thus, these values are relatively high and agree with the experimental results already reported.
Using the Korsmeyer-Peppas model, a plot of the logarithm of the fractional solute release versus the logarithm of time (the first 60% of dissolution release data) yielded a straight line with correlation coefficient (r2) between 0.962 and 0.998 for the ten formulations (Table 4). The slope of this line determines the diffusional exponent (n) value, which is characteristic of the transport mechanism of diffusional release. This equation may be used only for a granular inert matrix system which maintains a constant planar surface area, where the drug diffusion coefficient is clearly concentration independent, and the effect of solubility is implicit.
The lower values of n (0.15-0.43) computed from the Korsmeyer-Peppas relation (Table 4) can be related to the quasi-Fickian release kinetics model and also negate the erosion or solubilization of the wall matrix-driven phenomena [9,34,60,61].
Furthermore, the formulation F7 followed the Fickian diffusion model for a value of n = 0.51.
On the other hand, and according to Table 4, the long-time diffusivities are greater than those of the short-time. They are in the order of 10-7 cm2 sec-1 which can be explained by the low solubility of allopurinol at the start of the release process. Concerning lots F2, F5, F7, F9 and F10 the diffusivity values agree with the Higuchi rate constants.
Conclusion
The present study emphasized the effects of formulation process parameters on the characteristics and in vitro release behavior of Allop-loaded microspheres prepared by microencapsulation using the solvent evaporation technique with different carriers such as EC, HPMC, PCL, and (-CD.
In all formulations, the drug content was found to be between 10.46 % and 46.40 % and the practical yield was found to be between 40 % and 92 %. The effect of stirring speed (800 or 300 rpm) and number of blades (four or six) is notable in microspheres (F1- F4). The stirring speed of 800 rpm applied for formulation F4 makes it possible to obtain microspheres with average diameter (d 32) of 47.71μm. The microspheres of all formulations are perfectly individualized, spherical in shape with different morphologies.
The rate of drug release from microspheres prepared with different matrices is exploited experimentally. Indeed, the effect of the matrix and the size of the microspheres are noticeable for the dissolution of drug. This was clearly observed for the F7 and F10 formulations which improved the release of allopurinol on the one hand and the F6 formulation which slowed down its release on the other hand and showed a better delay effect.

