


 nova página do texto(beta)
 Inglês (pdf)
 Artigo em XML
 Referências do artigo
 Enviar este artigo por email
 Citado por SciELO
  Similares em
SciELO
Similares em
SciELO 
 Permalink
Introduction
Surface plasmon resonance has gained attention due to its capability of label-free detection and real-time monitoring of molecular interactions, sensitivity, and capability to provide significant qualitative and quantitative information for the biopharmaceutical industry. Technology is now being used in many areas such as in drug discovery for pharmacokinetic drug profiling, high-throughput screening, fragment-based drug design, and ADME/T profiling as well as in quality control [1]. Also, surface plasmon resonance is now being used in clinical research and applications such as biomarker discovery and immunogenicity assays [2,3]. Since biopharmaceuticals have the potential to create immunogenicity due to many factors such as altered glycan profile and aggregates, also the importance of activity before administration to patients to obtain the expected therapeutic effect, it is essential to meet the critical quality attributes (CQAs).
In the biopharmaceutical industry, to get a fast and reliable process control, scientists are using the “Quality by Design (QbD)” approach. ICH guidance documents are describing the principles of the QbD approach. The first important step of QbD is defining critical quality attributes. Based on the ICH guideline, because of their impact on product efficacy, stability, and safety, the obligatory CQAs defined in the guideline are protein content, osmolality, pH, appearance (color, opalescence, and clarity), buffer content, excipient content, and surfactant content. Also, other factors like Quality Target Product Profiles (QTPP) such as dosage strength, dosage form, drug product shelf life, degradants, and impurities, etc. must be assessed [4].
Because, biopharmaceuticals are protein-based products, they are sensitive to storage and transportation conditions. Degradation during transportation and storage and loss of some activity may occur. The parameters may affect the quality of the finished product are long term drug product storage, interactions with the primary container, silicone oil interactions, shock and drop effects, change in pressures, vibration stresses and, particle, bubbles, and aggregate formation [5,6]. Also, while trading these products, regulatory agencies are expecting from a biopharmaceutical to meet the criteria specified both in guidelines and specification sheets. Therefore, analyses are being repeated in the specification sheets of the product.
Although SPR methods are used more frequently in the characterization of biotechnological products, there are limited publications on method validation and system suitability tests within them. There are fewer publications on the measurement of active concentrations, which is directly related to the potency of the drug. Even if it is not for method validation, system suitability tests are important in terms of the reliability of the data obtained. Since there are no fully accessible guidelines specific to SPR-based analysis yet, every approach to increase the reliability of the data obtained from these studies is exemplary and important.
Considering all the information gathered, for a biopharmaceutical product, it is essential to measure the active protein content because it specifies the strength of the product as well as total protein content and ensure the system is properly working during analysis via system suitability testing. In the paper, a system suitability testing of an active concentration measurement method via surface plasmon resonance by using Fab-fragment coded as FAB1 achieved. We think that the system suitability parameters evaluated in the study can be exemplary for all SPR analyses regarding concentration measurement.
Experimental
Materials
GLM Sensor Chip is from BioRad, HBS-EP+ buffer, 50 mM NaOH, pH 5.0 10 mM sodium acetate buffer, 1-ethyl-3-(3-dimethylaminopropyl) carbodiimide hydrochloride (EDC), N-hydroxysuccinimide (NHS) and ethanolamine (1.0 M, pH 8.5) are from GE Healthcare and all the other reagents used in methods are at analytical grade. ProteOn XPR36 surface plasmon resonance system equipped with ProteOn Manager™ Software Version 3.1 was used during analyses.
Immobilization of Neutravidin to GLM Sensor Surface by Amine Coupling
To couple the neutravidin to carboxylic acid groups in the alginate layer of GLM sensor chip, the chip surface was activated by using EDC/NHS chemistry. EDC/NHS mixture was flowed over 6 crisscrossing flow channels for 84 s at 25 µL/min flow rate [7]. 1 mg/mL Neutravidin prepared in 10 mM acetate buffer (pH 5.0) flowed over the activated surface for 150 s at 25 µL/min flow rate. After another activation loop to stabilize immobilization of neutravidin, the sensor chip surface was inactivated by flowing ethanolamine over the surface for 84 s at 25 µL/min flow rate. Following the neutravidin immobilization, four cycles of regeneration step performed in order to condition the chip surface for capturing of biotinylated anti-FAB1. 50 nM HCl and 50 mM NaOH were used sequentially for 60 s at 50µL/min flow rate.
Capturing of Biotinylated Anti-FAB1 to Neutravidin Conjugated Surface
To achieve FAB1 and anti-FAB1 interaction without loss of anti-FAB1, it is captured via its biotinylated site by immobilized neutravidin. 200 ng/mL anti-FAB1 dissolved in running buffer (HBS-EP+) horizontally flowed over the surface for 120 s at a 25 µL/min flow rate. A regeneration cycle applied with 50 mM NaOH for 50 s at a 30 µL/min flow rate.
Following the regeneration cycle, sensor chip conditioning with 50 mM NaOH for 50 s at 30 µL/min flow rate three times and flow system conditioning with running buffer (HBS-EP+) for 60 s at 100 µL/min flow rate was achieved.
Concentration Measurement of FAB1
Analytes (FAB1, standards, and controls) prepared in HBS-EP+ buffer vertically flowed over the surface with a 25 µL/min flow rate. The association time for the interaction was 180 s and dissociation time was 300 s. After completion of each analysis cycle, regeneration was performed with 50 mM NaOH for 20 s at a 30 µL/min flow rate.
To measure the active content of Fab fragment (FAB1) containing vial, we used standards to create calibration curve. The highest concentration of the standard was 2000 ng/mL and other concentrations prepared with two-fold dilution scheme (2000 ng/mL, 1000 ng/mL, 500 ng/mL, 250 ng/mL, 125 ng/mL, 62.5 ng/mL, 31.25 ng/ml and 15.625 ng/mL). Control samples prepared in the same manner, to use to check the analysis quality. After completion of each 10-sample cycle, controls flowed over the surface in vertical manner.
Sample in the vial was prepared as 3 independent samples and analyzed to include 4 dilutions (4 different concentration levels) in each independent sample.
The analysis and sample compartment temperature were maintained at 25 °C by software that allowed the temperature to be kept constant throughout the analysis. The ProteOn XPR36 system is a combined system with ProteOn Manager™ Software Version 3.1 which is a compact and automated system which keeps the system temperature in desired range automatically.
Data Evaluation
Obtained data processed by using ProteOn Manager™ Software Version 3.1. Software is using the standard four-parameter logistic equations to determine the unknown concentration. Before evaluation of data, obtained sensorgrams processed. First, baseline alignment performed to adjust all the sensorgrams to the same zero-baseline level along y-axis to remove slight baseline-level differences among the sensorgrams. Then, artifact removal performed to ensure sensorgram integrity. Finally, interspot referencing performed to correct potential bulk effect, non-specific binding, and baseline drift. Concentration analysis wizard was used on processed sensorgrams. The standard four-parameter logistic equation was used to determine the unknown concentration. CV % of samples and Difference % of controls form standards were calculated from obtained data.
Results and discussion
Capturing of Biotinylated Anti-FAB1 to Neutravidin Conjugated Surface
In order to saturate the chip surface with neutravidin for capturing the biotinylated ligand, high ligand densities are required such as 5000 RU or above. On the other hand, to minimize the mass transport limitation, ligand density was chosen as 10000 RU. Based on the target value, we calculated the expected Rmax based on the equation below [8]:
Calculated Rmax level based on the desired ligand density was found as 145 RU (MWanalyte (biotinylated anti-FAB1): 872 Da and MWligand(neutravidin): 60.000 Da). Measured Rmax value was 109 RU which can be seen from Fig. 1. By using the same equation above, the immobilized ligand density calculated as 7500 RU which is enough to capture the biotinylated ligand for concentration measurements.

Because the harsh conditions during EDC/NHS immobilization, loss of activity in ligand is expected. Active ligand was calculated because it will directly affect the capturing of biotinylated anti-FAB1 which was eventually affect the concentration measurement. Activity (%) was calculated with the equation below [9]:
Rmax used in the functional ligand ratio calculation was experimental value and, RL value used in the functional ligand ratio calculation was the target RL value. Based on the equation above, the functional ligand calculated as 75%.
Concentration Measurement of FAB1
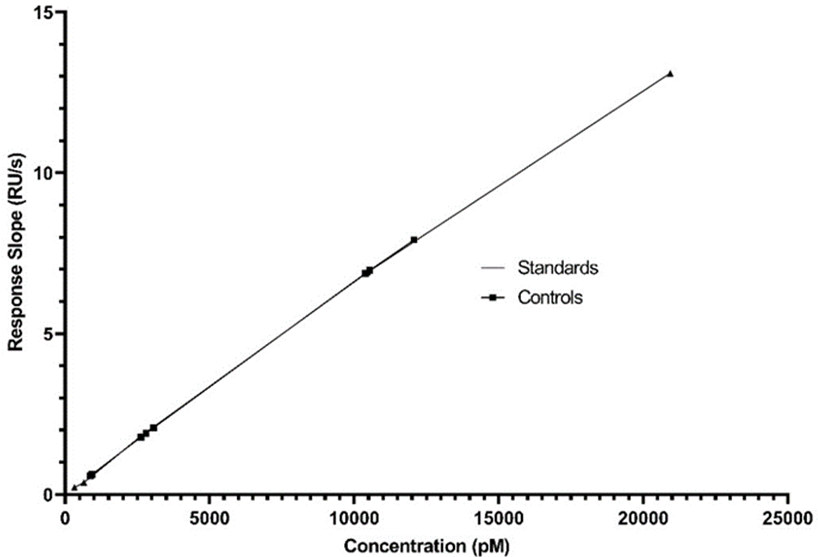
Concentration range of standards in constructing calibration curve was between 15.625 ng/mL to 2 µg/mL with two-fold dilutions. 8 concentration levels were used but at least 5 levels considered based on the linear range of the calibration curve as seen in Fig. 2.

5 analytical values were used in the construction of the calibration curve; values are 1000 ng / mL, 500 ng / mL, 125 ng / mL, 31.25 ng / mL and 15.625 ng / mL, respectively.
Blank injections are required during the SPR analysis to ensure the system is equilibrated and free of residual chemicals from the immobilization procedure. Also, these blank injections are used as reference to identify and correct baseline drift by subtracting the reference channel from the active channel and then the blank injections from the analyte injections. Therefore, the difference of the lowest analyte concentration injection and the blank (analyte buffer) must be checked [10]. As can be seen from the Fig. 3 there was a 9 RU difference between the HBS-EP + buffer called analyte 6 and the signal value of the lowest concentration standard.
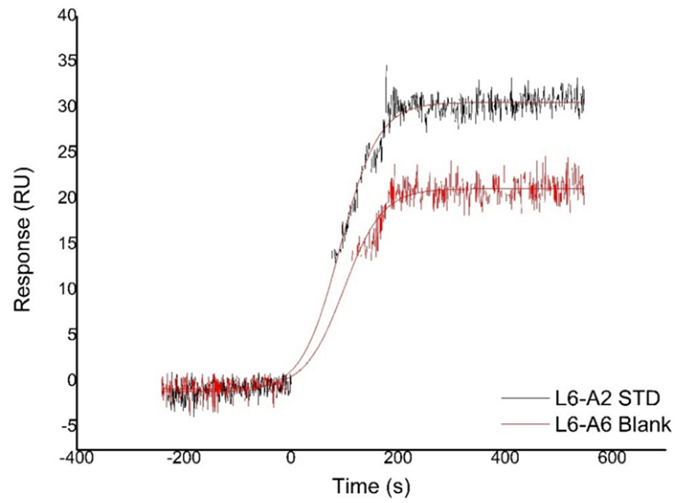
Fig. 3 The response of blank (HBS-EP+ buffer called analyte 6) and the response of the lowest concentration standard.
Control samples were used to confirm that the analysis method was reliable. The difference between standards and control samples concentrations calculated. The results can be seen in Fig. 4 and Table 1.

Table 1 Difference of the control samples from standards.
| Corresponding Concentration (ng/mL) | Measured Standards (M) | Control 1 (M) | Control 2 (M) | Average (M) | Difference (Dev.) (M) | Difference (Dev.%) |
|---|---|---|---|---|---|---|
| 2000 | 4,19E-08 | 4,12E-08 | 3,66E-08 | 3,89E-08 | -3,00E-09 | -7% |
| 1000 | 2,09E-08 | 1,92E-08 | 1,89E-08 | 1,91E-08 | -1,85E-09 | -9% |
| 500 | 1,05E-08 | 9,50E-09 | 9,42E-09 | 9,46E-09 | -1,04E-09 | -10% |
| 250 | 5,23E-09 | 4,52E-09 | 4,69E-09 | 4,69E-09 | -5,40E-10 | -10% |
| 15,625 | 3,27E-10 | 0,00E+00 | 3,25E-10 | 3,25E-10 | -2,00E-12 | -1% |
As a result of the analysis of the control values, the % Difference values are equal to or below ≤ 10 %. Because the long analysis run, controls added between the sample analysis to check the stability of the analysis method. Based on the obtained results, analysis was consistent during the run. One of the control samples was not included to the calculations because there may be an experimental error during sample preparation since the value is 0.
To obtain a reliable active concentration measurement of the sample, 3 independent samples for analysis prepared. Each of the independent samples diluted in a two-fold dilution scheme and 4 dilutions of them analyzed. For analysis samples of all samples, analysis of at least 3 of the 4 dilutions per sample was expected. Obtained sensorgrams and concentrations of dilutions on calibration curve can be seen in Fig. 5 and 6, respectively.

Samples were prepared as 3 independent samples and analyzed to include 4 dilutions in each independent sample. The value of 2000 ng/mL was not evaluated because it is outside the calibration curve range. The remaining 3 dilutions could be analyzed.
The quality of the sensorgrams obtained in SPR analysis should be taken into consideration. The binding profile of an analyte to its ligand should generate an exponential curve. Also, the initial binding rate should be exponential to rule out the mass transport limitation effect as well as free from artefacts like drifts, jumps, decays etc. [11]. Due to the information regarding sensorgram, the obtained sensorgrams which can be seen in Fig. 7 was visually inspected.

No critical detection problem was detected in the visually evaluated sensorgrams. There is no bulk effect or injection artefacts. The bending and dose-response relationship needed for the accuracy of the analysis is clearly seen.
Gathering the overall data, the variability of the analyzed samples calculated (Table 2).
Table 2: Standard deviations and variability constants in ratio of the samples.
| Corresponding Conc. (ng/mL) | Sample Conc. 1 (M) | Sample Conc. 2 (M) | Sample Conc. 3 (M) | Average Conc. (M) | SD | CV % |
|---|---|---|---|---|---|---|
| 31,125 | 9,27E-10 | 8,72E-10 | 8,72E-10 | 8,90E-10 | 2,6E-11 | 3 |
| 125 | 3,06E-09 | 2,63E-09 | 2,80E-09 | 2,83E-09 | 1,8E-10 | 6 |
| 500 | 1,21E-08 | 1,04E-08 | 1,05E-08 | 1,10E-08 | 7,8E-10 | 7 |
The CV % values obtained as a result of 3 repeated analyses of 3 dilutions that can be analyzed from 4 different dilutions prepared are as above and less than 10 %.
According to the bioanalytical method validation guidance, the drug substance concentration in a pharmaceutical dosage form must be between 80 % to 120 % range [12]. Active concentration ratio of the sample was calculated by using the equation below:
In the calculation, the analysis result of 500 ng/mL, which is the highest concentration value of the analyzed unknown samples, was used. The expected concentration was 10.5 nM whereas we measured as 11.0 nM. Based on the results, “Analysis Result (%)” value was calculated as 105 %.
Conclusion
Biopharmaceuticals are protein-based products, which means they can lose activity during the up-stream and down-stream processes. But in a finished form of a biopharmaceutical, there is still chance to lose its activity because of the transportation and storage conditions. The active content of a biopharmaceutical is important because the active content is responsible for the treatment efficacy. Therefore, for biopharmaceuticals, it is necessary to determine not only the total protein concentration, but also the active protein concentration.
As explained by Pope et al. study, using capture technique presents a challenge if there is a large difference between sizes of ligand and analyte because the magnitude of the signal is proportional to the molecular mass. Therefore, as in our case, it is much practical to capture or immobilize the smaller sized molecule (as ligand) and inject the higher sized molecule (as analyte) over the ligand to get strong signal [9]. Capturing method is a common approach in SPR assays. However, right orientation of ligand and analyte is important to obtain better results [13]. Therefore, many researchers prefer capturing method, and they immobilize the capturing agent onto sensor surface covalently via amine or aldehyde coupling [14,15]. We preferred to immobilize neutravidin covalently via amine coupling onto sensor surface. We used biotin/neutravidin interaction to immobilize ligand (interacting counterpart) via capturing method because biotinylated molecules are almost irreversibly bind to sensor surface [16] to obtain repeatable and robust data without loss of anti-FAB1. By using biotin/neutravidin capture approach we assure that the anti-FAB1 was in correct orientation for interaction of FAB1. In this way, we prevented the loss of anti-FAB1 which yielded with a robust and repeatable concentration measurement method.
Since the results obtained from the concentration measurement will only be valid if the device and method have been shown to be compatible with the system, the parameters that can be used for system suitability testing in SPR methods were evaluated. In this context, determination of the immobilization level and the amount of active immobilized ligand, checking whether a distinction was made between the mobile phase (running buffer) and the sample signal at the lowest concentration, precision study simultaneously with the range and linearity study, accuracy study and visual evaluation of sensorgrams were performed. After all the parameters are provided, the concentration analysis of the sample has also shown how much it deviates from the true value.
The method described in the article was used to analyze the concentration of a formulated Fab-fragment sample in order to define the strength of the biopharmaceutical in an active concentration manner.

