


 text new page (beta)
 English (pdf)
 Article in xml format
 Article references
 Send this article by e-mail
 Cited by SciELO
  Similars in
SciELO
Similars in
SciELO 
 Permalink
Introduction
Nowadays, the determination of trace heavy metals in environmental and food samples is of crucial importance [1]. Almost all heavy metals have detrimental effects on the body, some of which including lead, cadmium, nickel, and mercury are toxic and hazardous to human health even in trace amounts [2]. Lead and cadmium are among the prevalent toxic elements in the food samples with a long half-life after the absorption in humans and animals. These elements can cause unpleasant effects such as damaging the internal organs, the nervous system, kidneys, liver, and lungs [3-5].
Milk is an important resource of calcium, protein, zinc and other essential nutrients for humans that may be contaminated with heavy metals [6]. Cadmium and lead residues in milk is of particular concern since they are largely consumed by children [7]. At present, there are no specific maximum permissible limit for cadmium in milk; the Codex Alimentarius Commission only establishes a limit for Pb(II) in milk (20.0 μgL-1) [7,8].
Regarding the importance of measuring the lead and cadmium content, there is a need for a sensitive, repeatable, and accurate analytical method to determine trace amounts of lead and cadmium ions in different types of samples. There are various methods to identify this cation in different samples consisting of graphite furnace atomic absorption (GFAA) [9], inductively coupled plasma emission spectrometry (ICP-OES) [10,11], inductively coupled plasma mass spectrometry (ICP-MS)[12], and Flame atomic absorption spectroscopy (FAAS) [13]. Among these methods, FAAS has been widely used due to its lower costs and ease of application [14].
Solid-phase extraction (SPE) is one of the efficient methods for the extraction of heavy metals from real samples involving advantages such as high concentration factors, reduced organic solvent consumption, simplicity, and the final phase free of the contamination [15]. The magnetic SPE (MSPE) is an emerging, efficient, and simple method in which magnetic particles are considered as the solid phase and in which the magnetic field could serve as the separating force[16-18]. MSPE is widely used for the extraction and pre-concentration of analytes in various environmental and food samples [19-22]. Magnetic nanoparticles (NPs) are extensively utilized adsorbents in MSPE as a result of their low toxicity, facile preparation, and inherent magnetic properties [23-25]. The tremendous chemical activities of bare magnetic NPs make them possibly capable of oxidizing in the air, usually causing the loss of dispersibility and magnetism [25]. Expanding effective protection plans and coating their surfaces are vital for saving the magnetic NPs’ stability properly [26].
Ionic liquids (ILs) are a group of organic salts established with various organic-inorganic anions and organic cations [27,28]. They obtained incrementing attention in analytical chemistry since they possess a high capacity to interact with other molecules via various interactions [29,30]. They are extensively utilized in samples pre-treating methods [31-33]. Therefore, modifying magnetic NPs with ILs can integrate the advantages of magnetic NPs to ILs and increase the extraction efficiency for some analytes [34].
1-(2,3-dihydroxypropyl)-1,4-diazabicyclo 2.2.2 octanylium chloride ([DABCO-PDO]Cl) modified silica-coated Fe3O4 NPs were introduced by our research group [35]; thus, we employed as a nano-adsorbent for the simultaneous extraction and pre-concentration of Pb (II) and Cd (II) ions in milk samples, prior analysis by FAAS. The effect of experimental factors on the extraction efficiency was also evaluated and optimized. To investigate the applicability of the proposed method, it was utilized for the determination of Pb (II) and Cd (II) residues in milk samples. The interest of calculating the measurement uncertainties is to demonstrate the data quality that is fundamentally critical for laboratories, and all institutions using these results for comparative purposes [36]. There is no published paper about a comprehensive evaluation of uncertainty associated with the determination of Pb(II) and Cd(II) ions in milk samples.
Experimental
Materials
The standard lead and cadmium solutions of 1000 mgL-1 were purchased from Chem.Lab Company (Belgium). 1,4-diazabicyclo 2.2.2octane (DABCO), 3-chloro-1,2-propanediol, toluene, as well as FeCl3•6H2O and FeCl2•4H2O were prepared from Merck Company (Germany). Pyrazine-2-carboxylic acid (PCA), Tetraethyl orthosilicate (TEOS) and (3- chloropropyl)-trimethoxysilane (CPTMS) were obtained from Sigma-Aldrich Company. Other materials were purchased from Merck (Germany). Deionized water was also used for all the investigations. The working solutions which contain the mixture of ions were fabricated by appropriate daily dilution of standard stock solutions with deionized water. The Britton-Robinson buffer was used to adjust the pH of solutions.
Instrumentation
A FAAS (PerkinElmer's PinAAcle 900T) with lead (Pb) and cadmium (Cd) hollow-cathode lamps were used to detect the absorbance of Pb and Cd ions. The pH values were measured using a PB-11 Sartorius pH-meter. The sample solution was stirred for the adsorption/desorption steps using a 1010 Heidolph shaker (Germany). The BINDER VDL 23 vacuum oven (Germany) and BANDELIN SONOREX DIGITEC ultrasonic bath (Germany) were also used during the process. A magnet with a magnetic field of 1.4 Tesla was used for magnetic separation.
Preparation of milk samples
Milk specimens were bought from local supermarkets. Adding 0.5 milliliters of trifluoroacetic acid to 10 milliliters of milk samples, the combination was vortexed for 5 minutes. For precipitating milk proteins, the specimen was then centrifuged for 15 min at 3500 rpm. Diluting the supernatant was performed using distilled water (50 mL), and the pH was set to 5.0 using Britton-Robinson buffer, it was conveyed to a volumetric flask (50 mL) and diluted up to the mark.
General extraction procedure
A batch procedure was used for the MSPE. 0.001 molL-1 of PCA (as a ligand) was added to 50 mL of sample solution (pH 5.0) containing the appropriate amount of Pb(II) and Cd(II) ions. Then 50 mg of the adsorbent was added, and a shaker stirred the mixture for 5 min. The nano-sorbent was maintained with a strong magnet, and the liquid phase was removed. Then for desorption of Pb(II) and Cd(II) ions, 3 mL of 1.0 molL-1 HNO3 was added to the nano-sorbent, which was again stirred for 5 min. Eventually, the nano-sorbent was separated from the acidic solution by the magnet. The clear solution of the eluent containing Pb (II) and Cd(II) ions was used for the subsequent FAAS analysis.
Estimation of uncertainty
The information regarding the quality of the results is obtained by uncertainty estimation of an analytical technique since it provides an interval nearby the true estimated value. Therefore, it is very imperative that all possible sources of error included in the ultimate result are involved in calculating the uncertainty [37]. The International Organization for Standardization (ISO) recommended two main processes of top-down and bottom-up that are currently utilized for evaluating the uncertainty of the measurement [38-40]. This study aims to determine the uncertainty measurement using the bottom-up approach. This study aimed to measure the uncertainty measurement utilizing the bottom-up method.
The extended uncertainty of determining the analytes was determined based on an Ishikawa diagram (Fig. 1). The expression of expanded uncertainty (U) is produced by the integrated standard measurement uncertainty and a factor higher than unity based on the Guide to the Expression of Uncertainty in Measurement (GUM). Equation (1) shows the algorithm utilized for calculating the expanded uncertainty, U, related to the measured concentration, C:

where k is the coverage factor used to expand the uncertainty to approximately 95 % (typically, k = 2), ucal the standard uncertainty of calibration step, ustd is r standard uncertainty of standard preparation, uVsam is the standard uncertainty of volume of sample, uVf is the standard uncertainty of final volume, urep is the standard uncertainty of repeatability, utrue the relative standard uncertainty of trueness and uLOD the relative standard uncertainty of method limit of detection (LOD). Meanwhile, ucal, utrue, urep and uLOD were calculated by the following Equations (2)-(5), respectively.
where Sxy is the residual standard deviation, b is the slope of the calibration curve, p is the repetition number measurements for a given sample (conc.), n is the total number of standard samples used for plotting the calibration curve, xsam is the experimentally determined sample concentration, xn is the mean value of all the concentrations of a standard solution for which the measurement was made to plot a standard curve and xi is the calculated concentration. RSDPooled is the pooled relative standard deviation estimated from n replicated measurements at three spiked concentration levels of milk samples (10, 20, and 50 µgL-1), RSDresult is the relative standard deviation in real samples and Cm is the mean concentration of the analyte.
The standard preparation of the calibration curve is a crucial uncertainty source, which is an integration of used uncertainty glassware and stock solution. Here, the standards were prepared utilizing a volumetric flask (flask) and pipette (pipt). The manufacturer-provided related uncertainty data are introduced. Equations (6) to (9) are utilized to calculate u(std).
where u(pipt) is the uncertainty of the pipette, and u(stock) is the uncertainty of the stock solution. Calculation of u(pipt) is the combination of the uncertainty comes from the calibration of the pipette (u(pipt.cal)), u(rep) is the uncertainty comes from the repeatability of the volume of the pipette and the uncertainty source from the temperature effect (u(temp)). Preparing the standard solution by using a flask, u(flask), and uncertainty of stock solution, u(stock) should be taken into account in the uncertainty calculation of standard solution.
The temperature effect is the result of the variation in temperature in the laboratory, which is generally accepted as ± 3 °C in Eurachem/Citac guide [41].
where, u(temp), standard uncertainty of the temperature effect; V, measured volume and Q, the coefficient of volume expansion of the water. Rectangular distribution is accepted.
Initial volume scaling
The impact of sample volumes was examined under fixed mass of the analytes and various feed volumes within the range of 50-500 mL. The extraction recoveries of Cd (II) and Pb (II) were quantitative up to 200 mL of the sample volume.
Optimization of conditions for MSPE
To determine the most effective conditions for the simultaneous extraction and pre-concentration of Pb (II) and Cd (II) ions, several experimental factors were optimized. The optimization of the method was performed by a single-factor method. Blank milk samples (without analytes) with spiked 20 µgL-1 of Pb (II) and Cd (II) were used for all the measurements, and three replicates were tested in all cases.
Optimization of sample pH value, concentration of ligand and amount of adsorbent
The pH value has a prominent role in the adsorption procedure, especially the adsorption capacity. The extraction of traces of Pb(II) and Cd(II) ions from solutions buffered at different pH values were assessed since the solution pH affects the extent of complexation with PCA. The pH values varied in the range of 2-7 (Fig. 2(a)). The proper pH value for the simultaneous extraction of two analytes was 5.0. The extraction recoveries were enhanced significantly when the pH value was raised from 2.0 to 5.0. Beyond the value of pH 6.0, precipitations of heavy metals will occur. This is due to insoluble metal hydroxide species that start precipitating from the solutions at higher pH values. This should be avoided during sorption experiments to distinguish between sorption and precipitation [42].
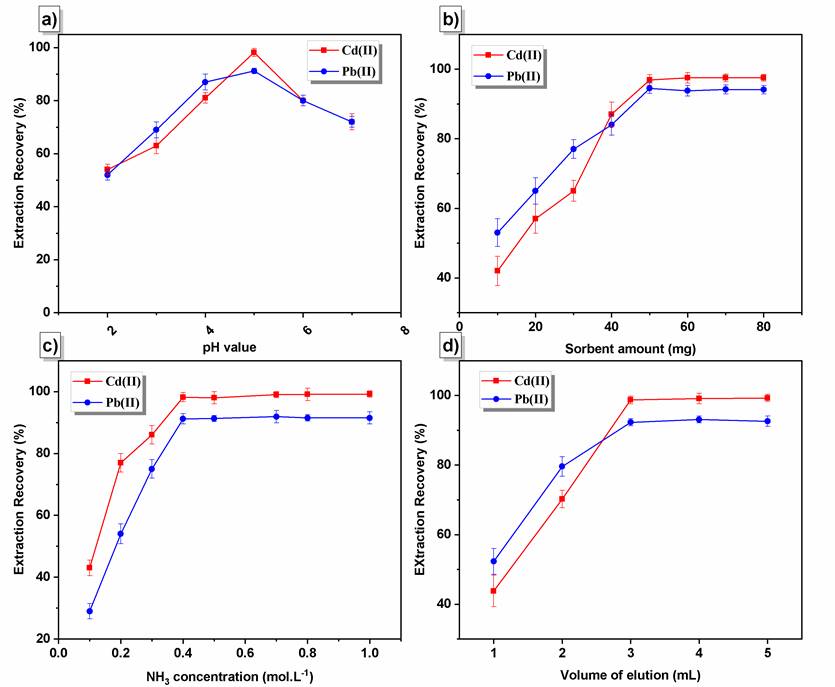
Fig. 2 (a) Effect of pH on the extraction of Pb (II) and Cd (II) by Fe3O4@[DABCO-PDO]Cl nano sorbent, (b) Effect of amount of sorbent on the extraction efficiency, (c) Effect of concentration of HNO3, (d) Effect of amount of elution (mL).
The extraction efficiencies of lead and cadmium depend on the concentration of ligand [43,44]. The effect of ligand concentration was thus examined. The concentration of the ligand reagent was increased until the complete complexation of all the lead and cadmium contents. Concentrations higher than 0.001 molL-1 represented no changes efficiency. The metal-ligand ratio is 1 to 2. The type of ligand was selected based on the structure of NPs to interact with the functional groups of NPs after the formation of the complex. The PCA was heterocyclic and included carboxylic acid functional groups. The possible interaction and probable mechanism of analyte adsorption to the NPs are that, following complex formation with PCA, the metal complexes are adsorbed to the Fe3O4/[DABCO-PDO]Cl NPs by hydrogen bond interactions with hydroxyl groups in the adsorbent structure.
The adsorbent amount is one of the critical parameters affecting the extraction of metal ions. The parameter of adsorbent content was evaluated in the range of 10-80 mg. According to the results, the amount of Fe3O4/[DABCO-PDO]Cl NPs of 50 mg was chosen as the optimum mass for further experiments (Fig. 2(b)).
The effect of extraction time and desorption time
The contact time between the solution and adsorbent is another effective feature for the extraction process. The times 2, 5, 8, 10, 13, 15, 20, and 30 min were considered to study the effect of extraction time as well as desorption time. Results represented that both processes were high-yielded at 5 min.
The effect of type, concentration, and volume of the elution
An appropriate elution should be capable of fully eluting the adsorbed analyte [45]. For this purpose, different solvents, including HCl, HNO3, and CH3COOH, were investigated, among which, HNO3 with a maximum extraction was chosen as the optimal solvent. The effect of HNO3 concentration on the extraction efficiency of both enriched ions was evaluated using a variety of concentrations from 0.1 to 2.0 molL-1. Examination of the results presented in Fig. 2(c) demonstrated that the extraction recovery percentage increases until 0.5 molL-1 HNO3 and remains unchanged from 0.5 to 2.0 molL-1 HNO3. It is also essential to find the minimum amount of elution for Pb (II) and Cd (II) desorption from NPs to achieve a high concentration factor. In this regard, elution volume was varied in the range of 2-5 mL (Fig. 2(d)). Based on the results, 3 mL of 0.5 molL-1 HNO3 exhibited maximum extraction efficiency for Pb (II) and Cd (II).
The effect of the NaCl salt
Considering fixed values for other parameters, the effect of ionic strength on the MSPE efficiency was evaluated by adding different amounts of NaCl in the range of 1-30 % (w/v). Results revealed that the extraction efficiency remained almost constant in the studied concentration range; thus, salt addition did not affect the adsorption, indicating high resistance of this technique toward higher salt concentrations.
Preconcentration factor
The pre-concentration factor (PF) is an essential parameter for the MSPE performance. The PF was calculated based on the following equations:
where Cr and Cs are the concentration of the analyte in the eluent phase and the initial concentration of the analyte in the sample solution, respectively. Initial and final volumes of 200 and 3 mL, thus the PF of the method was 67.
Sorbent reusability
An eco-friendly economical procedure is ensured mainly by reusability, according to which adsorption performance is assessed [26]. Several successive cycles of sorption/desorption were performed during each run, of which ≈ 95 % sorbent was recovered effectively (Fig. 3). Once experimenting five cycles, about 84 % of extraction recovery values were obtained, indicating the applicability of Fe3O4/[DABCO-PDO]Cl NPs without a substantially lost extraction efficiency. In the sixth run, however, extraction recoveries considerably declined, i.e., 52 %. The NPs mass declined upon some regenerations due to being rinsed during recycling and reuse, and IL- modified Fe3O4 NPs lost their efficiency upon a couple of rising attempts, leading to limited magnetic NPs reusability.

Effect of interfering ions
Typically, the heavy metal analysis is along with interfering with similar ions, excluding the target analyte. Hence, we attempted to assess the impacts of other co-existence possible metal ions on the extraction efficiency and evaluation of method selectivity in relation to the co-existence metal ions complex with PCA. Since PCA has been used as a ligand for metal ions such as Ca2+, Ni2+, Cu2+, and Zn2+, these ions may form complexes with PCA if being present in the solution [46-48]. Therefore, to assess the potential interaction due to the complex formation of the mentioned metal ions with PCA and its effect on the two analyses' extraction efficiency, various quantities of metal ions were added into 50 millilitres of the sample solution contacting 20 µgL-1 of the target analytes. Moreover, the effect of other ions such as Na+, K+, and Fe2+ on the analyte extraction was assessed. The MSPE was conducted under the optimum circumstances. Based on the definition, an ion causing a variation of ± 10 % in the recovery was regarded as the interference species. According to the experimental findings, no significant interfering impact exists at interference/ion concentration ratio of 1000 for K+, Na+, Mg2+, Ca2+, 150 for Mg2+, Ni2+, Zn2+, Fe2+, and 50 for Cu2+ on simultaneous quantitative analysis of Cd (II) and Pb (II). Thus, it may be concluded that Ca2+, Ni2+, Cu2+, and Zn2+ ions with a concentration of 50-fold the analytes concertation do not interfere with the complex of target analytes and PCA, subsequently does not affect the extraction efficiency.
Analytical performance
Under the optima circumstances described above, a linear calibration graph was obtained from 0.5-120 μgL-1for Pb and 0.4-200 μgL-1for Cd, with regression coefficients (R2) always better than 0.996. The limit of quantification (LOQ = 10 Sb/m) and detection (LOD = 3Sb/m), in which Sbrepresents the standard deviations of 10 replications of the blank signals and m shows the extraction calibration curve slope, were 0.29 μgL-1(limit of quantification) and 0.09 μgL-1(detection limit) for Pb; and 0.23 μgL-1 (limit of quantification) and 0.07 μgL-1(detection limit) for Cd. The inter and intra-day precision of the method were determined utilizing relative standard deviation (RSD %) at three concentrations of 25, 50, and 100 μgL-1 (Table 1). The inter and intra-day RSD % was found less than 1.44 % and 2.12 % for Cd, and 1.81 % and 2.54 % for Pb, respectively. The accuracy based on recovery was determined as the percentage of the ultimate concentration of desorbed ions to the concentration provided initially in the sample solution. The recovery was 92.8 % to 99.4 % for Cd, and 91.6 % to 100.8 % for Pb, respectively.
Table 1 Precision and accuracy of proposed method under the optimum condition (n=5).
| Element | Added (µgL-1) | Inter-day precision (RSD %) | Intra-day precision (RSD %) | Accuracy (recovery %) |
|---|---|---|---|---|
| Cd | 25 | 1.28 | 1.70 | 92.8 |
| 50 | 1.05 | 1.53 | 98.1 | |
| 100 | 1.44 | 2.11 | 99.4 | |
| Pb | 25 | 1.81 | 2.54 | 91.6 |
| 50 | 1.45 | 2.07 | 93.3 | |
| 100 | 1.27 | 1.89 | 100.8 |
Application to commercial milk samples and measurement of uncertainty
To demonstrate the applicability of the developed method, the concentrations of Pb (II) and Cd (II) were measured in four commercial milk samples (Table 2). The combined uncertainty was calculated by using Equation (1) The results are expressed as expanded uncertainty (A coverage factor k = 2 was used to evaluate the expanded uncertainty at a confidence level of 95 %). The value of the standard deviation is less than the expanded uncertainty. These results are consistent with the earlier statement that, the lower concentration, the higher the uncertainty of the results. This aspect is especially vital in the trace analysis of metal ions in food matrix samples. This demonstrates the importance of calculating the expanded uncertainty in analytical procedures; failure to do so can lead to over- or underestimation of the final results. As evidenced, no Pb(II) was found in milk sample number (S3), whereas, 13.21 ± 2.47 , 14.34 ± 1.94 and 7.91 ± 1.77 μgL-1 of Pb(II) were determined in milk samples (1), (2) and (4), respectively. As a result, in all milk samples, the lead content was found below the maximum permissible limit set by Codex Alimentarius Commission. Thus, results from this study demonstrated the reliability of the proposed method for analysis of Pb (II) and Cd (II) in food matrices.
Table 2 Analysis of Cd(II) and Pb(II) in milk samples using the proposed method under the optimum condition (n=4).
| Sample | Element | Added (µgL-1) | Founded (µgL-1) | RSD (%) | Recovery (%) | Expanded Uncertainty (±) µgL-1 |
|---|---|---|---|---|---|---|
| Milk S1 | Cd | 0 | 6.45 | 2.11 | 1.51 | |
| 10 | 16.01 | 1.87 | 95.6 | |||
| 20 | 26.13 | 1.95 | 98.4 | |||
| 50 | 56.05 | 2.08 | 99.2 | |||
| Pb | 0 | 13.21 | 2.95 | - | 2.47 | |
| 10 | 22.58 | 2.11 | 93.7 | |||
| 20 | 31.85 | 2.0 | 93.2 | |||
| 50 | 60.46 | 2.23 | 94.5 | |||
| Milk S2 | Cd | 0 | 5.17 | 1.78 | - | 1.28 |
| 10 | 14.41 | 1.95 | 92.4 | |||
| 20 | 24.33 | 1.48 | 95.8 | |||
| 50 | 52.77 | 1.42 | 95.2 | |||
| Pb | 0 | 14.34 | 2.92 | - | 1.94 | |
| 10 | 23.79 | 2.14 | 94.5 | |||
| 20 | 32.80 | 2.63 | 92.3 | |||
| 50 | 59.74 | 1.98 | 90.8 | |||
| Milk S3 | Cd | 0 | 4.47 | 2.81 | - | 1.14 |
| 10 | 13.98 | 1.43 | 95.1 | |||
| 20 | 23.83 | 1.52 | 96.8 | |||
| 50 | 54.67 | 1.95 | 100.4 | |||
| Pb | 0 | <LOQ | - | - | - | |
| 10 | 9.73 | 2.14 | 97.3 | |||
| 20 | 19.60 | 2.02 | 98.0 | |||
| 50 | 49.10 | 2.08 | 98.2 | |||
| Milk S4 | Cd | 0 | 12.63 | 2.87 | - | 2.58 |
| 10 | 21.95 | 1.75 | 93.2 | |||
| 20 | 31.43 | 1.83 | 94.0 | |||
| 50 | 60.43 | 1.78 | 95.6 | |||
| Pb | 0 | 7.91 | 2.69 | - | 1.77 | |
| 10 | 17.18 | 2.77 | 92.7 | |||
| 20 | 26.63 | 2.14 | 93.6 | |||
| 50 | 55.61 | 2.53 | 95.4 |
Comparison with other methods
The proposed method was compared with other reported methods used for the determination and pre-concentration of lead and cadmium. The distinct features of the proposed method are summarized in Table 3. The comparison results indicated that the proposed method possesses comparatively higher sensitivity. This methodology is simple, economical, and reproducible, requiring no further instrumentation and compatible with regular FAAS equipment.
Table 3 Comparison of the developed method with other reported methods used for the pre-concentration of Cd2+ and Pb2+ ions before FAAS determination.
| Adsorbent | Medium pH | Eluent (molL-1) | PF/EFa | LOD (µgL-1) | Refs. |
|---|---|---|---|---|---|
| MWCNTsb/NBNBAEED | 6.0 | HNO3 (3.0) | 100 | Cd2+ 60 Pb2+ 20 | [49] |
| MWCNTs impregnated with BTAO | 7.0 | HNO3 (2.0) | 100 | Cd2+ 0.7 Pb2+ 2.6 | [50] |
| MWCNTs/quinalizarin | 6.0 | HNO3 (2.0) | 100 | Cd2+ 0.65 Pb2+ 0.6 | [51] |
| MWCNTs modified with TETA | 7.0 | HNO3 (3.0) | 113 | Cd2+ 0.3 Pb2+ 3.7 | [52] |
| ACCc/ PAN | 7.0 | HNO3 (3.0) | 100 | Cd2+ 1.1 Pb2+ 2.8 | [53] |
| O-MWCNTs / BMBATT | 7.0 | HNO3 (2.0) | 200 | Cd2+ 0.08 Pb2+0.1 | [54] |
| MSPE/Fe3O4@[DABCO-PDO]Cl NPs | 5.0 | HNO3 (3.0) | 67 | Cd2+ 0.09 Pb2+0.07 | This work |
a PF: pre-concentration factor; EF: enrichment factor.
b MWCNTs: Multiwalled carbon nanotubes.
c ACC: activated carbon cloth.
Conclusion
In this study, [DABCO-PDO]Cl was covalently immobilized on the surface of magnetic NPs, and employed as an adsorbent for the MSPE of Pb (II) and Cd (II) before their determination by FAAS. Since the entrance of heavy metals to the food chain of living organisms through environmental waters could have disastrous health effects, the present study was sought to determine the lead and cadmium contents in milk samples. This method provided LODs of 0.07 and 0.09 µgL-1 for Cd and Pb, respectively, with a PF of 67 for the simultaneous extraction. Besides, this method has excellent precision and accuracy, as well as an expanded linear concentration range. The developed method was successfully employed to measure the low-levels concentration of Pb and Cd in milk samples with high precision and accuracy. The uncertainty calculations were reported as clear as possible in this paper in order to make an easy and useful guide to be followed. Thus, the method proposed is speed, simple to use, and sensitive with good analytical performances compared with other similar methods for the Pb and Cd determination.

