


 nueva página del texto (beta)
 Inglés (pdf)
 Artículo en XML
 Referencias del artículo
 Enviar artículo por email
 Citado por SciELO
  Similares en
SciELO
Similares en
SciELO 
 Permalink
Introduction
The carbohydrates, commonly known as saccharides are the energy suppliers to all living organisms. They are utilized in the pharmaceutical industries for the manufacture of drugs and are also important in the field of chemicals, bio-chemicals and foods industries. Presently, the monosaccharide galactose and the disaccharide lactose have been considered for the investigation, where galactose is supposed to be the building blocks for the preparation of lactose. This saccharide is quite abundant in human diets and responsible for various functions inside the body. According to Hussain et al. [1] galactose with certain properties is involved in biological processes. Similarly, lactose is considered as the milk sugar and it is exclusively present in milk apart from medicines and culture media. It is also responsible for the development of brain as it is the essential element for the formation of cerebral galactolipids. Besides, absorption of lactose depends on the enzyme lactase, which enhances the absorption of metals like calcium, magnesium, and zinc. Zinc ion is one amongst the transition metals that is essential for the biological functions in all living organisms [2,3]. This metal is present in bones, muscles, liver and brain [4] and the deficiency of zinc ion is responsible for the chronic age-related diseases like neurological disorders and Alzheimer's [5]. Zinc ion is also an important metal ion in the preparations of various drugs and especially, ZnSO4 is supposed to be a better supplement for chronic diarrhea [6]. Moreover, media of certain drugs needs appropriate amounts of different saccharides. Therefore, it is important to investigate the association of this metal with different saccharides.
Intermolecular interaction studies have been reported for different zinc salts [7,8,9] and saccharides [10,11,12,13] as solutes in aqueous solvents. Besides, many other solutes have also been investigated in various aqueous-saccharides as mixed solvents [14,15,16,17,18]. However, inter-molecular interactions of biologically important transition metal ions in presence of aqueous galactose and lactose are quite rare in the literature. Furthermore, certain anions and cations are responsible for some specific ionic effect like ion-pair formation in aqueous solutions. This is recognized as a Hofmeister effect where specific ions or solute affect the structure of water upon addition. Such type of effects has been reported in biological activities [19,20,21]. Paul S Cremer and his group have studied the effect of Hofmeister cations, where Zn2+ is coming under the ions that tend to increase the solubility [22]. As per the Hofmeister series, the behaviors of anions are more pronounced than cations and SO4 2- ion is considered as a kosmotrope. This ion is believed to be strongly hydrated and a ‘water structure maker’. Above all, it is a stabilizing ion, having salting-out effect on macromolecules like proteins [23]. Harold studied the nature of interactions between water and functional groups in proteins [24]. Roy et al., reported the interaction between vitamins and aqueous cysteine [25]. Most of the functions of human metabolic systems involve aqueous media and also carbohydrates have significant role in this process. It is, therefore, essential to study the interactions of such systems.
In continuation of our previous work with lactose [26], this would be an extension to compare between two saccharides, where only aqueous galactose mixed solvent has been presented and was compared with our earlier reported data of lactose [26].
Experimental
Chemicals
The zinc sulphate heptahydrate and the galactose of high purity (mass fraction more than 99.9) used in the present investigation were acquired from Qualigen Chemicals. All these chemicals were used without further purifications and were kept in desiccator at room temperature to avoid any possible moisture absorption.

Solution preparation
Mixed aqueous solvents were prepared from galactose for four different concentrations (2.5, 5.0, 7.5, 10.0%) in double distilled water having density 0.9960 ×10³ kg m-3 (w/V) at room temperature. Series of ZnSO4 solutions of varying concentration from 0.01 to 0.1 mole.dm-3 were made by taking the above prepared mixed solvents. The solutions were kept acquiring different temperature for 30 minutes in a thermostat with an accuracy of 0.01 K. Systems containing ZnSO4 with aqueous lactose solvents have been studied and reported earlier [26].
Apparatus and Procedure
The solutions were prepared in glass volumetric vials using a Vibra Make HTR-220E analytical balance. The densities of all solutions were measured by a bicapillary pycnometer with a reproducibility of ±3×10⁻³ kg.m-3. The viscosity of the solutions was measured by using a calibrated Ostwald viscometer, where it was immersed in a water bath to maintain constant temperature. The temperature was maintained within ±0.01 K. The speed of sound in all the solutions was measured by a single crystal variable-path ultrasonic interferometer operating at 3MHz frequency (Mittal make, India). Constant temperature was maintained by circulating water from a thermostatically regulated water bath maintained within ±0.01 K around the sample holder. The reproducibility for speeds of sound measurements was ±5 ×10⁻¹ms-1.
Results and discussion
The experimentally measured values of density, ρ, viscosity, η and speed of sound, U, of ZnSO4 in different concentrations of aqueous galactose as mixed solvents have been listed in Tables. Few parameters are also represented in figures. The respective values of ZnSO4 in lactose solutions have been presented elsewhere [26] and certain parameters are presented here in figures for comparison.
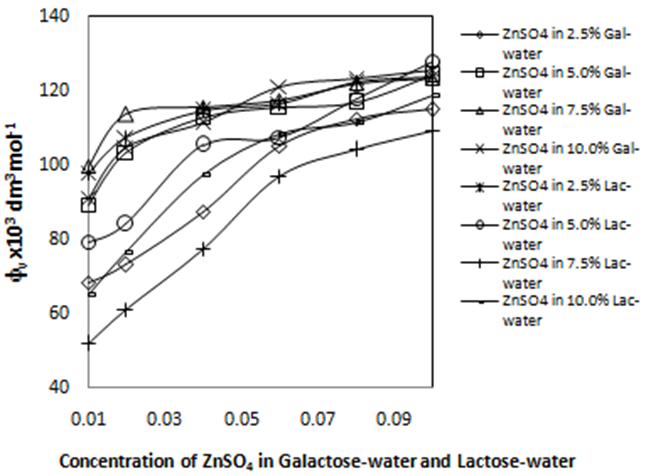
Our results reveal that the speed of sound increases with the concentration of ZnSO4 in both mixed solvents as well as with the concentration of galactose (Table 1) and lactose in water [(Fig. 1) Representative 3-D plot of ZnSO4 in galactose-water mixed solvent at different temperatures]. This enhancement is indicative of cohesive forces by ionic hydration suggesting molecular association. However, the speed of sound is comparatively larger in galactose systems than in the lactose systems (Fig. 2). This reveals the compactness of ZnSO4 in aqueous galactose than that in lactose. The higher values of density for ZnSO4 in aqueous galactose than lactose further supports this finding. This also suggests the existence of ion-solvent interactions and the structure making tendency by H-bonding of solvent [27]. As per the literature, the increase of density indicates the enhancement of solvent-solvent and solute-solvent interactions, whereas the decreasing values indicate less interactions [28]. The increase in density can be assumed to be the shrinkage in the volume, which in turn is due to the presence of solute molecules. This might also be interpreted to the structure-maker of the solvent due to the addition of solute. Similarly, the decrease in density is indicative of structure-breaker of the solvent [29]. However, variation of density refers to the gap between the components in the solution, whereas that of viscosity to the thinness or thickness of the fluids. Both these parameters are affected by the temperature. Presently, viscosity increases with the increase in the concentrations of both ZnSO4 as well as that of galactose and lactose. However, it shows decreasing trends with increase in temperature for all systems. The increase in viscosity can be explained by the presence of solute particles across the fluid streamlines, which tend to rotate and absorb energy, thus are responsible for the enhancement [30,31].
Table 1 Experimentally determined density, ρ, viscosity, η and ultrasonic velocity, U of ZnSO4 in 2.5%, 5.0%, 7.5% and 10% Galactose-water mixed solvent at 303.15K, 308.15K and 313.15K temperature.
| C . mol.kg-1 | ρ x 10-3 kg.m-3 | η x 103 kg.m-1.s-1 | U m.s-1 | ||||||
|---|---|---|---|---|---|---|---|---|---|
| ZnSO4 in 2.5% Galactose - Water | |||||||||
| 303.15K | 308.15K | 313.15K | 303.15K | 308.15K | 313.15K | 303.15K | 308.15K | 313.15K | |
| 0.00 | 1.0066 | 1.0052 | 1.0040 | 0.8548 | 0.7738 | 0.7054 | 1513.2 | 1524.5 | 1535.2 |
| 0.01 | 1.0088 | 1.0072 | 1.0059 | 0.8629 | 0.7805 | 0.7124 | 1515.5 | 1526.0 | 1536.4 |
| 0.02 | 1.0109 | 1.0090 | 1.0076 | 0.8709 | 0.7891 | 0.7200 | 1516.4 | 1527.2 | 1537.6 |
| 0.04 | 1.0146 | 1.0127 | 1.0110 | 0.8797 | 0.7982 | 0.7288 | 1517.4 | 1528.4 | 1539.0 |
| 0.06 | 1.0175 | 1.0157 | 1.0143 | 0.8895 | 0.8067 | 0.7370 | 1520.3 | 1530.4 | 1540.2 |
| 0.08 | 1.0205 | 1.0190 | 1.0176 | 0.9041 | 0.8218 | 0.7461 | 1523.2 | 1532.5 | 1541.8 |
| 0.10 | 1.0237 | 1.0223 | 1.0199 | 0.9197 | 0.8369 | 0.7605 | 1525.5 | 1534.4 | 1544.2 |
| ZnSO4 in 5.0% Galactose - Water | |||||||||
| 303.15K | 308.15K | 313.15K | 303.15K | 308.15K | 313.15K | 303.15K | 308.15K | 313.15K | |
| 0.00 | 1.0170 | 1.0156 | 1.0139 | 0.9010 | 0.8191 | 0.7433 | 1522.6 | 1532.8 | 1541.8 |
| 0.01 | 1.0190 | 1.0173 | 1.0159 | 0.9087 | 0.8266 | 0.7505 | 1524.8 | 1534.6 | 1543.5 |
| 0.02 | 1.0207 | 1.0189 | 1.0173 | 0.9164 | 0.8342 | 0.7582 | 1526.7 | 1536.1 | 1545.5 |
| 0.04 | 1.0240 | 1.0221 | 1.0206 | 0.9322 | 0.8430 | 0.7670 | 1528.2 | 1537.5 | 1546.9 |
| 0.06 | 1.0273 | 1.0252 | 1.0238 | 0.9473 | 0.8519 | 0.7756 | 1530.7 | 1539.8 | 1548.7 |
| 0.08 | 1.0306 | 1.0283 | 1.0269 | 0.9634 | 0.8611 | 0.7908 | 1533.4 | 1541.5 | 1550.9 |
| 0.10 | 1.0332 | 1.0312 | 1.0298 | 0.9788 | 0.8766 | 0.8061 | 1536.6 | 1543.3 | 1553.3 |
| ZnSO4 in 7.5% Galactose - Water 257. 258. 259. 260. | |||||||||
| 303.15K | 308.15K | 313.15K | 303.15K | 308.15K | 313.15K | 303.15K | 308.15K | 313.15K | |
| 0.00 | 1.0268 | 1.0251 | 1.0234 | 0.9661 | 0.8706 | 0.7878 | 1532.4 | 1542.0 | 1552.4 |
| 0.01 | 1.0287 | 1.0271 | 1.0254 | 0.9740 | 0.8783 | 0.7954 | 1534.0 | 1543.7 | 1553.7 |
| 0.02 | 1.0303 | 1.0287 | 1.0270 | 0.9883 | 0.8862 | 0.8031 | 1535.4 | 1545.6 | 1555.2 |
| 0.04 | 1.0337 | 1.0322 | 1.0305 | 0.9979 | 0.9014 | 0.8122 | 1537.5 | 1547.1 | 1556.7 |
| 0.06 | 1.0370 | 1.0354 | 1.0336 | 1.0085 | 0.9106 | 0.8206 | 1540.1 | 1549.4 | 1558.6 |
| 0.08 | 1.0400 | 1.0385 | 1.0368 | 1.0230 | 0.9200 | 0.8361 | 1543.0 | 1551.7 | 1560.6 |
| 0.10 | 1.0431 | 1.0416 | 1.0399 | 1.0390 | 0.9294 | 0.8518 | 1545.6 | 1554.2 | 1562.8 |
| ZnSO4 in 10.0% Galactose - Water | |||||||||
| 303.15K | 308.15K | 313.15K | 303.15K | 308.15K | 313.15K | 303.15K | 308.15K | 313.15K | |
| 0.00 | 1.0365 | 1.0351 | 1.0336 | 1.0322 | 0.9296 | 0.8462 | 1542.6 | 1552.7 | 1559.3 |
| 0.01 | 1.0385 | 1.0372 | 1.0353 | 1.0396 | 0.9371 | 0.8533 | 1544.4 | 1554.3 | 1562.0 |
| 0.02 | 1.0402 | 1.0387 | 1.0369 | 1.0483 | 0.9452 | 0.8616 | 1546.2 | 1556.2 | 1564.6 |
| 0.04 | 1.0436 | 1.0421 | 1.0401 | 1.0630 | 0.9550 | 0.8706 | 1548.6 | 1558.8 | 1567.1 |
| 0.06 | 1.0465 | 1.0451 | 1.0432 | 1.0738 | 0.9658 | 0.8798 | 1550.0 | 1562.2 | 1569.0 |
| 0.08 | 1.0496 | 1.0482 | 1.0463 | 1.0900 | 0.9798 | 0.8950 | 1552.7 | 1564.1 | 1571.6 |
| 0.10 | 1.0526 | 1.0512 | 1.0492 | 1.1072 | 0.9963 | 0.9111 | 1555.1 | 1566.6 | 1574.0 |
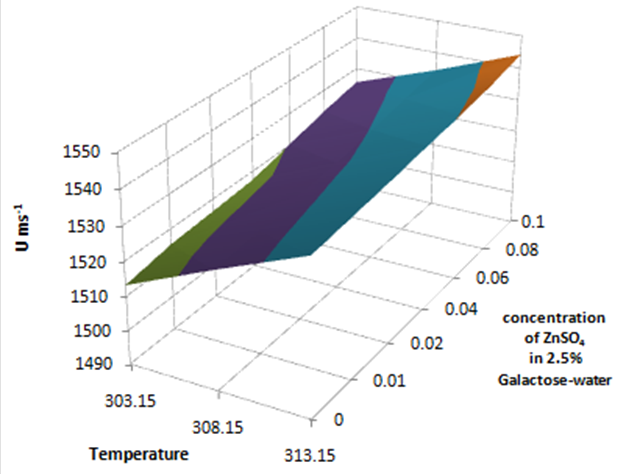
Fig. 1 3-D Representative plot of ultrasonic velocity, U vs Concentration (mole kg-1) of ZnSO4 in 2.5% Galactose-water mixed solvent at T = (303.15K, 308.15K, 313.15K).
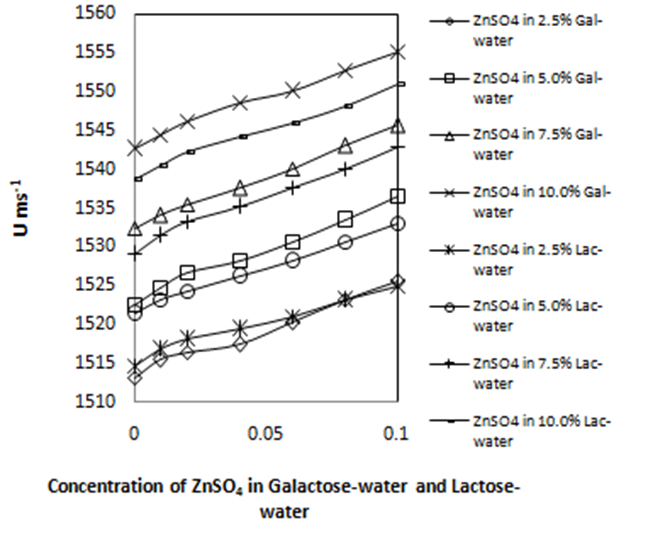
Fig. 2 Variation of speed of sound, U vs. Concentration (mole kg-1) of ZnSO4 in Galactose-water and Lactose-water mixed solvent at 303.15K.
Isentropic compressibility and molal compressibility
Isentropic compressibilities, βs, of solutions were obtained using the following Laplace equation [32] :
where ρ and U are the density and ultrasonic velocity for the fluid samples. As per Sadeghi et al., this compressibility is the sum of two contributions, βs(solvent intrinsic) and βs(solute intrinsic) [33]. The compressibility resulting from the compression of solvent molecules (galactose and lactose) is (s(solvent intrinsic) whereas that of due to the compression of the hydration shell of ions is known as (s(solute intrinsic) [34]. Perusal of tables and figures shows that isentropic compressibility decreases with increase in concentrations of both ZnSO4 as well as the carbohydrates contents in the solvents (Table 2). This type of variation confirms the presence of ion-solvent interactions through ion-dipole type between zinc ion and surrounding water molecules. This even supports the increasing number of H-bonding in carbohydrates. Compressibility of solvent is generally found to be higher than that of solution and it reduces with the increase in concentration of the solution [27]. The closeness of the components in solutions also results in the decrease in compressibility. Again, increase in compressibility with temperatures can be attributed to the thermal expansion of the solutions resulting in a less compressible liquid [18] [Representative 3-D plots for ZnSO4 in both aqueous galactose and lactose at different temperatures (Figs. 3 and 4)]. The (s values decrease with an increase in temperature for each binary system at a fixed composition due to an increase in thermal agitation. This happens by the release of solvent molecules from the solute and the resulting increase in solution volume. According to Bahadur et al. the decrease in isentropic compressibilities with increase in concentration of the solute is the consequence of the combined effect of solvation of ions and breaking of the structure of solvent molecules and also because of the dominating nature of (s(solute intrinsic) over the (s(solvent intrinsic) effect [35]. In addition, another compressibility factor such as the apparent molal compressibility, фk was also studied, which can be determined by using the formula [36]:
Table 2 Calculated values of isentropic compressibility, βs, Internal pressure, (i, free volume, Vf of ZnSO4 in 2.5%, 5.0%, 7.5% and 10% Galactose-water mixed solvent at 303.15K, 308.15K and 313.15K temperature.
| C 453. mol.kg-1 | βsx 1010 455. N-1.m2 | (ix 109 458. pa 459. | Vfx 108 461. m3mol-1 | ||||||
|---|---|---|---|---|---|---|---|---|---|
| ZnSO4 in 2.5% Galactose - Water | |||||||||
| 303.15K | 308.15K | 313.15K | 303.15K | 308.15K | 313.15K | 303.15K | 308.15K | 313.15K | |
| 0.00 | 4.3386 | 4.2805 | 4.2261 | 2.6285 | 2.5302 | 2.4444 | 2.1042 | 2.4706 | 2.8686 |
| 0.01 | 4.3160 | 4.2636 | 4.2115 | 2.6346 | 2.5353 | 2.4509 | 2.0878 | 2.4524 | 2.8413 |
| 0.02 | 4.3019 | 4.2493 | 4.1978 | 2.6413 | 2.5433 | 2.4580 | 2.0692 | 2.4250 | 2.8110 |
| 0.04 | 4.2806 | 4.2271 | 4.1761 | 2.6436 | 2.5471 | 2.4619 | 2.0568 | 2.4059 | 2.7865 |
| 0.06 | 4.2521 | 4.2036 | 4.1560 | 2.6441 | 2.5479 | 2.4645 | 2.0452 | 2.3919 | 2.7657 |
| 0.08 | 4.2235 | 4.1785 | 4.1340 | 2.6517 | 2.5593 | 2.4682 | 2.0178 | 2.3500 | 2.7415 |
| 0.10 | 4.1976 | 4.1547 | 4.1118 | 2.6617 | 2.5709 | 2.4784 | 1.9866 | 2.3090 | 2.6916 |
| ZnSO4 in 5.0% Galactose - Water | |||||||||
| 303.15K | 308.15K | 313.15K | 303.15K | 308.15K | 313.15K | 303.15K | 308.15K | 313.15K | |
| 0.00 | 4.2414 | 4.1909 | 4.1491 | 2.6382 | 2.5458 | 2.4543 | 2.0304 | 2.3662 | 2.7618 |
| 0.01 | 4.2209 | 4.1741 | 4.1318 | 2.6427 | 2.5507 | 2.4603 | 2.0171 | 2.3477 | 2.7376 |
| 0.02 | 4.2033 | 4.1594 | 4.1154 | 2.6468 | 2.5558 | 2.4658 | 2.0036 | 2.3285 | 2.7123 |
| 0.04 | 4.1816 | 4.1388 | 4.0947 | 2.6572 | 2.5573 | 2.4687 | 1.9715 | 2.3139 | 2.6911 |
| 0.06 | 4.1545 | 4.1140 | 4.0724 | 2.6654 | 2.5579 | 2.4706 | 1.9450 | 2.3015 | 2.6727 |
| 0.08 | 4.1267 | 4.0925 | 4.0486 | 2.6746 | 2.5592 | 2.4822 | 1.9168 | 2.2869 | 2.6227 |
| 0.10 | 4.0992 | 4.0715 | 4.0247 | 2.6810 | 2.5697 | 2.4935 | 1.8925 | 2.2481 | 2.5745 |
| ZnSO4 in 7.5% Galactose - Water | |||||||||
| 303.15K | 308.15K | 313.15K | 303.15K | 308.15K | 313.15K | 303.15K | 308.15K | 313.15K | |
| 0.00 | 4.1473 | 4.1027 | 4.0546 | 2.6687 | 2.5640 | 2.4672 | 1.9104 | 2.2547 | 2.6463 |
| 0.01 | 4.1311 | 4.0857 | 4.0399 | 2.6732 | 2.5692 | 2.4735 | 1.8978 | 2.2377 | 2.6223 |
| 0.02 | 4.1171 | 4.0693 | 4.0258 | 2.6858 | 2.5737 | 2.4790 | 1.8668 | 2.2209 | 2.5989 |
| 0.04 | 4.0924 | 4.0476 | 4.0044 | 2.6860 | 2.5840 | 2.4818 | 1.8587 | 2.1857 | 2.5798 |
| 0.06 | 4.0656 | 4.0231 | 3.9827 | 2.6868 | 2.5843 | 2.4824 | 1.8489 | 2.1750 | 2.5657 |
| 0.08 | 4.0386 | 3.9992 | 3.9602 | 2.6917 | 2.5845 | 2.4935 | 1.8296 | 2.1640 | 2.5198 |
| 0.10 | 4.0131 | 3.9745 | 3.9373 | 2.6992 | 2.5849 | 2.5046 | 1.8062 | 2.1533 | 2.4751 |
| ZnSO4 in 10.0% Galactose - Water | |||||||||
| 303.15K | 308.15K | 313.15K | 303.15K | 308.15K | 313.15K | 303.15K | 308.15K | 313.15K | |
| 0.00 | 4.0544 | 4.0072 | 3.9791 | 2.6939 | 2.5875 | 2.5006 | 1.8081 | 2.1368 | 2.4765 |
| 0.01 | 4.0371 | 3.9909 | 3.9589 | 2.6971 | 2.5921 | 2.5038 | 1.7991 | 2.1229 | 2.4620 |
| 0.02 | 4.0212 | 3.9754 | 3.9396 | 2.7012 | 2.5959 | 2.5085 | 1.7871 | 2.1080 | 2.4425 |
| 0.04 | 3.9956 | 3.9492 | 3.9150 | 2.7069 | 2.5965 | 2.5089 | 1.7684 | 2.0977 | 2.4301 |
| 0.06 | 3.9774 | 3.9207 | 3.8939 | 2.7073 | 2.5969 | 2.5096 | 1.7584 | 2.0863 | 2.4160 |
| 0.08 | 3.9519 | 3.8997 | 3.8695 | 2.7135 | 2.6027 | 2.5182 | 1.7378 | 2.0621 | 2.3798 |
| 0.10 | 3.9284 | 3.8761 | 3.8471 | 2.7212 | 2.6114 | 2.5279 | 1.7149 | 2.0319 | 2.3408 |
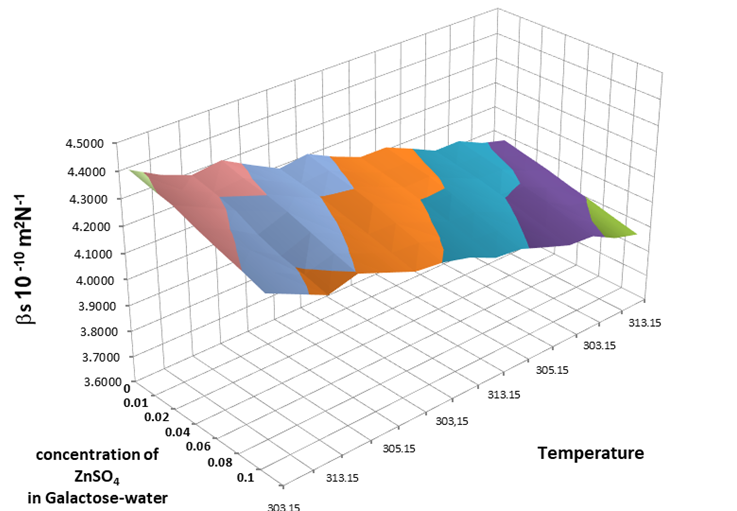
Fig. 3 3-D Representative plots of βs vs Concentration (mole kg-1) of ZnSO4 in Galactose-water mixed solvent at T = (303.15K, 308.15K, 313.15K).
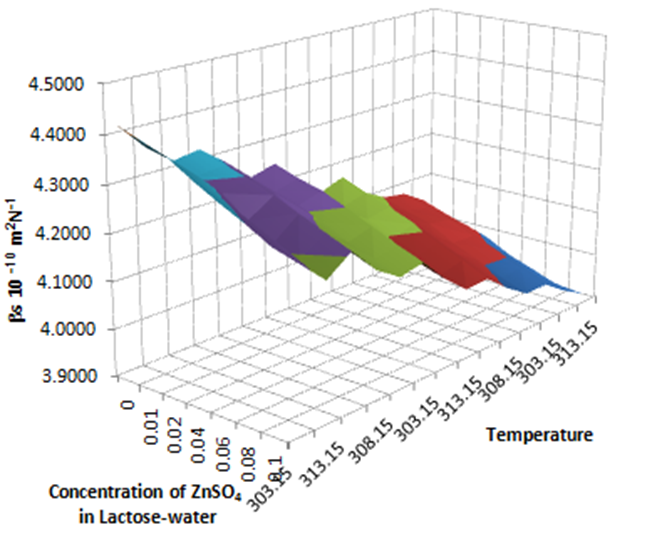
Fig. 4 3-D Representative plots of βs vs Concentration (mole kg-1) of ZnSO4 in Lactose-water mixed solvent at T = (303.15K, 308.15K, 313.15K).
where ρ and
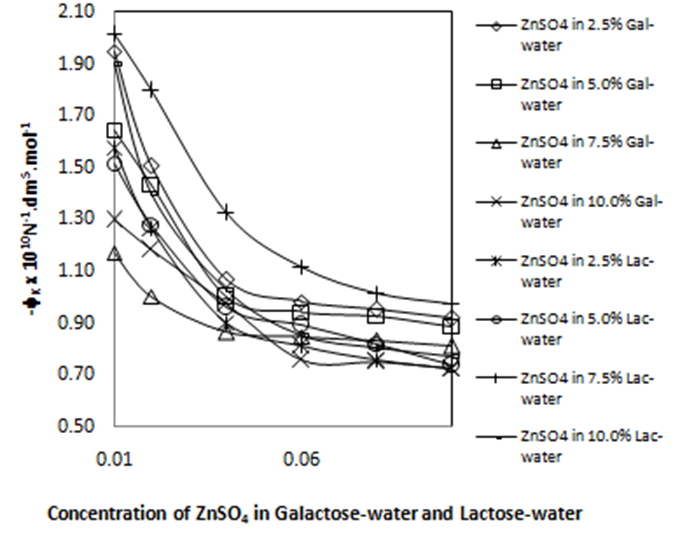
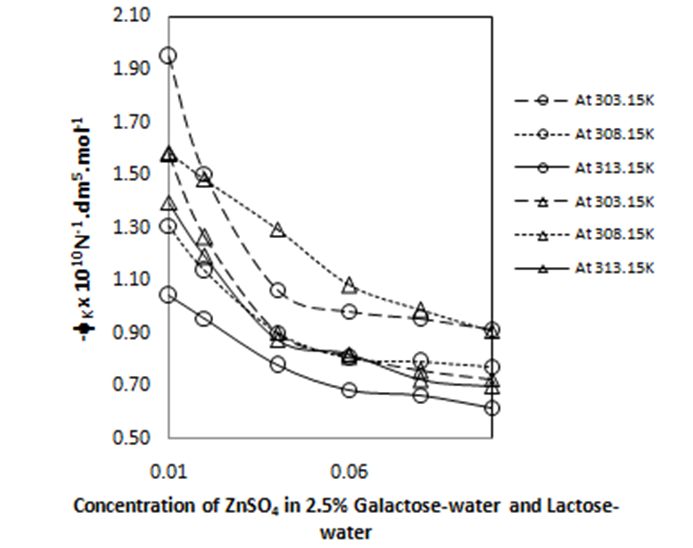
Fig. 5 Variation of apparent molar compressibility, фk vs Concentration (mole kg-1) of ZnSO4 in Galactose-water and Lactose-water mixed solvent at 303.15K.
Free volume and partial molal volume
The free volume, Vf, internal pressure, πi , relaxation time, τ, and relative association, RA are other parameters that were calculated using the following relations [38,39,40,41].
where, Meff is the effective molecular mass and K is a constant equal to 4.28 x 10⁹, independent of temperature for all types of liquids; b is the space packing factor, generally 2 for liquids, R is the gas constant, T is the absolute temperature. Presently, Vf values decrease with the concentration of ZnSO4 as well as that of galactose and lactose (Figs. 7 and 8) and increase with temperature. As per the literature, the higher values are indicative of less solute-solvent interaction [42].
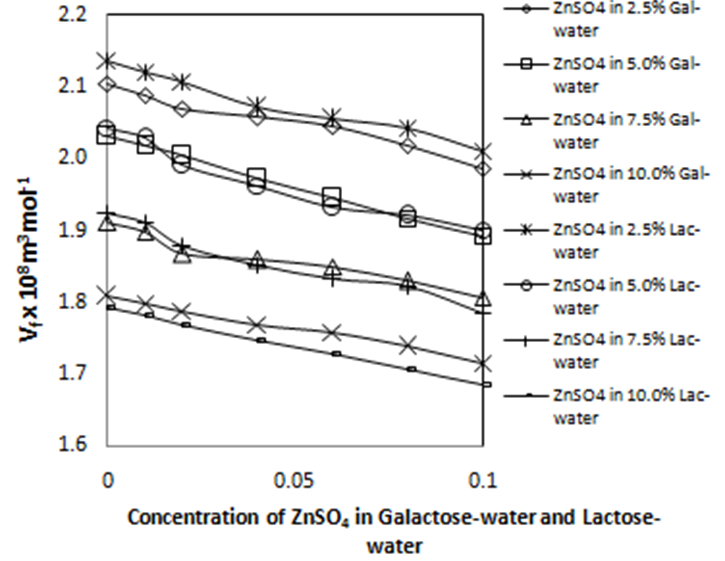
Fig. 7 Variation of free volume, Vf vs. Concentration (mole kg-1) of ZnSO4 in Galactose-water and Lactose-water mixed solvent at 303.15K.
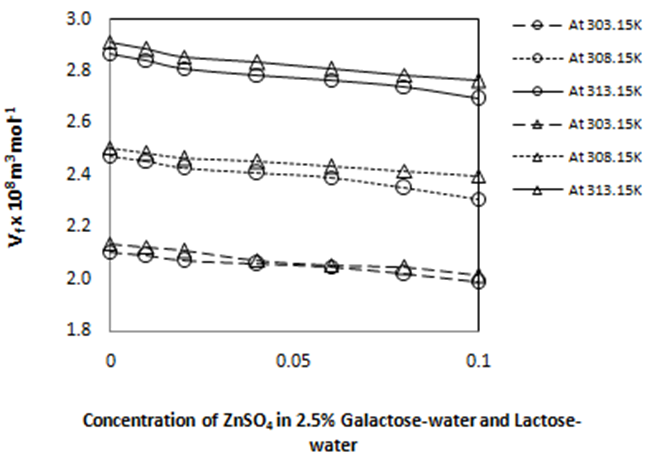
Fig. 8 Variation of free volume, Vf of ZnSO4 in 2.5% Galactose-water and Lactose-water vs. Temperature (303.15K, 308.15K, 313.15K).
The relative association, RA, is found to be increasing regularly with the concentration of ZnSO4 in both galactose and lactose systems (Fig. 9). But hardly any distinct variation was observed with temperature. However, it decreases slowly with the concentration of galactose and increases with lactose concentration. According to Jahagirdar et al., RA is influenced by two factors, such as breaking of associated solvent molecules on addition of solute or electrolyte and the solvation of solute molecules. It has been reported that the former leads to decrease and the later to an increase in RA with solute concentration [43]. The relaxation time, τ, is found to be increasing with the concentrations of ZnSO4 as well as carbohydrates (Table 3) and shows a decreasing trend with temperature [Representative 3-D plots for ZnSO4 in aqueous galactose mixed solvent at different temperatures (Fig. 10)]. It has been reported earlier that the decrease in relaxation time is indicative of a structure breaking tendency, whereas linear or non-linear increment with concentration indicates structure formation [44]. Kannappan et al. also reported a similar observation [42]. The internal pressure, considered as the cohesive energy is supposed to be caused by the attractive and repulsive forces between the molecules [45]. Presently, it increases with ZnSO4 as well as with galactose and lactose concentrations. However, the values are little higher in case of ZnSO4 in galactose than in lactose systems (Fig. 11). This enhancement is due to the strong cohesive forces that appear during the structure making of solvents in presence of solute [46]. The values of internal pressure decrease with temperature for all the systems studied (Fig. 12). This happens due to the dispersion of solute molecules with temperature and hence there is decrease in cohesive force.
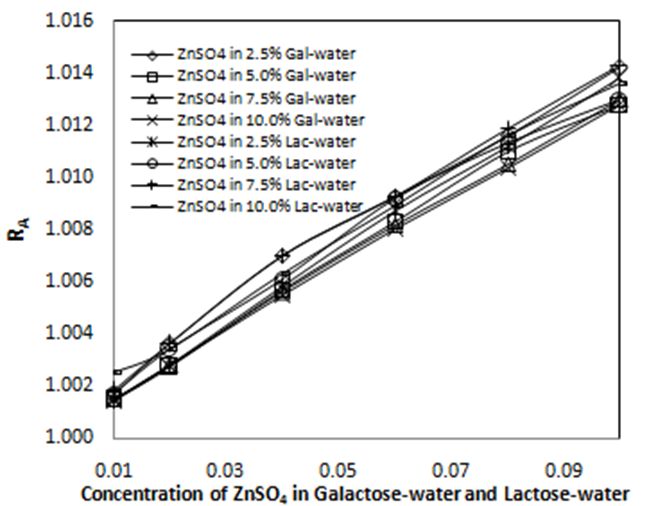
Fig. 9 Variation of Relative association, RA vs Concentration (mole kg-1) of ZnSO4 in Galactose-water a nd Lactose-water mixed solvent at 303.15K.
Table 3 Calculated values of Relative association, RA, viscous relaxation time, τ, Gibbs’ free energy change, ΔG of ZnSO4 in 2.5%, 5.0%, 7.5% and 10% Galactose-water mixed solvent at 303.15K, 308.15K and 313.15K temperature.
| C mol.kg-1 | RA | τ x 1013 s | ΔG x 10-21 k.J.mol-1 | ||||||
|---|---|---|---|---|---|---|---|---|---|
| ZnSO4 in 2.5% Galactose - Water | |||||||||
| 303.15K | 308.15K | 313.15K | 303.15K | 308.15K | 313.15K | 303.15K | 308.15K | 313.15K | |
| 0.00 | 4.9449 | 4.4163 | 3.9748 | 3.8307 | 3.5275 | 3.2409 | |||
| 0.01 | 1.0017 | 1.0017 | 1.0016 | 4.9657 | 4.4370 | 4.0004 | 3.8464 | 3.5451 | 3.2657 |
| 0.02 | 1.0036 | 1.0032 | 1.0031 | 4.9954 | 4.4708 | 4.0299 | 3.8687 | 3.5740 | 3.2940 |
| 0.04 | 1.0070 | 1.0066 | 1.0061 | 5.0209 | 4.4988 | 4.0581 | 3.8876 | 3.5976 | 3.3208 |
| 0.06 | 1.0093 | 1.0091 | 1.0092 | 5.0430 | 4.5214 | 4.0840 | 3.9040 | 3.6166 | 3.3454 |
| 0.08 | 1.0116 | 1.0120 | 1.0121 | 5.0913 | 4.5786 | 4.1125 | 3.9395 | 3.6642 | 3.3721 |
| 0.10 | 1.0142 | 1.0148 | 1.0139 | 5.1474 | 4.6361 | 4.1694 | 3.9804 | 3.7116 | 3.4251 |
| ZnSO4 in 5.0% Galactose - Water | |||||||||
| 303.15K | 308.15K | 313.15K | 303.15K | 308.15K | 313.15K | 303.15K | 308.15K | 313.15K | |
| 0.00 | 5.0953 | 4.5770 | 4.1120 | 3.9425 | 3.6629 | 3.3717 | |||
| 0.01 | 1.0015 | 1.0013 | 1.0016 | 5.1140 | 4.6004 | 4.1345 | 3.9561 | 3.6822 | 3.3927 |
| 0.02 | 1.0027 | 1.0025 | 1.0026 | 5.1359 | 4.6263 | 4.1604 | 3.9721 | 3.7036 | 3.4168 |
| 0.04 | 1.0057 | 1.0054 | 1.0055 | 5.1974 | 4.6520 | 4.1875 | 4.0165 | 3.7245 | 3.4418 |
| 0.06 | 1.0083 | 1.0079 | 1.0083 | 5.2475 | 4.6729 | 4.2114 | 4.0522 | 3.7415 | 3.4637 |
| 0.08 | 1.0110 | 1.0106 | 1.0108 | 5.3008 | 4.6988 | 4.2688 | 4.0899 | 3.7624 | 3.5159 |
| 0.10 | 1.0128 | 1.0131 | 1.0132 | 5.3497 | 4.7588 | 4.3258 | 4.1241 | 3.8105 | 3.5669 |
| ZnSO4 in 7.5% Galactose - Water | |||||||||
| 303.15K | 308.15K | 313.15K | 303.15K | 308.15K | 313.15K | 303.15K | 308.15K | 313.15K | |
| 0.00 | 5.3423 | 4.7624 | 4.2589 | 4.1190 | 3.8134 | 3.5069 | |||
| 0.01 | 1.0015 | 1.0016 | 1.0017 | 5.3649 | 4.7846 | 4.2845 | 4.1347 | 3.8310 | 3.5299 |
| 0.02 | 1.0028 | 1.0027 | 1.0029 | 5.4253 | 4.8083 | 4.3109 | 4.1764 | 3.8497 | 3.5536 |
| 0.04 | 1.0056 | 1.0058 | 1.0060 | 5.4450 | 4.8647 | 4.3365 | 4.1900 | 3.8940 | 3.5765 |
| 0.06 | 1.0082 | 1.0084 | 1.0086 | 5.4669 | 4.8846 | 4.3576 | 4.2049 | 3.9095 | 3.5951 |
| 0.08 | 1.0105 | 1.0110 | 1.0113 | 5.5087 | 4.9057 | 4.4149 | 4.2334 | 3.9258 | 3.6454 |
| 0.10 | 1.0130 | 1.0134 | 1.0139 | 5.5595 | 4.9252 | 4.4718 | 4.2676 | 3.9408 | 3.6947 |
| ZnSO4 in 10.0% Galactose - Water | |||||||||
| 303.15K | 308.15K | 313.15K | 303.15K | 308.15K | 313.15K | 303.15K | 308.15K | 313.15K | |
| 0.00 | 5.5799 | 4.9668 | 4.4895 | 4.2812 | 3.9727 | 3.7100 | |||
| 0.01 | 1.0015 | 1.0017 | 1.0011 | 5.5960 | 4.9865 | 4.5041 | 4.2920 | 3.9877 | 3.7225 |
| 0.02 | 1.0028 | 1.0027 | 1.0021 | 5.6205 | 5.0100 | 4.5259 | 4.3083 | 4.0056 | 3.7411 |
| 0.04 | 1.0055 | 1.0054 | 1.0046 | 5.6632 | 5.0287 | 4.5445 | 4.3365 | 4.0196 | 3.7569 |
| 0.06 | 1.0080 | 1.0076 | 1.0072 | 5.6946 | 5.0489 | 4.5678 | 4.3571 | 4.0348 | 3.7766 |
| 0.08 | 1.0104 | 1.0102 | 1.0096 | 5.7434 | 5.0945 | 4.6177 | 4.3889 | 4.0689 | 3.8184 |
| 0.10 | 1.0128 | 1.0125 | 1.0119 | 5.7994 | 5.1491 | 4.6734 | 4.4251 | 4.1093 | 3.8647 |
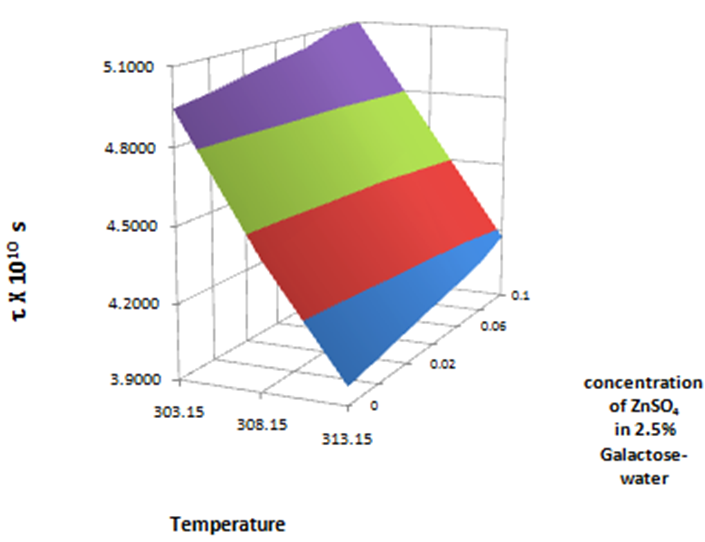
Fig. 10 3-D Representative plots of Relaxation time, ( vs Concentration (mole kg-1) of ZnSO4 in 2.5% Galactose-water mixed solvent at T = (303.15K, 308.15K, 313.15K).
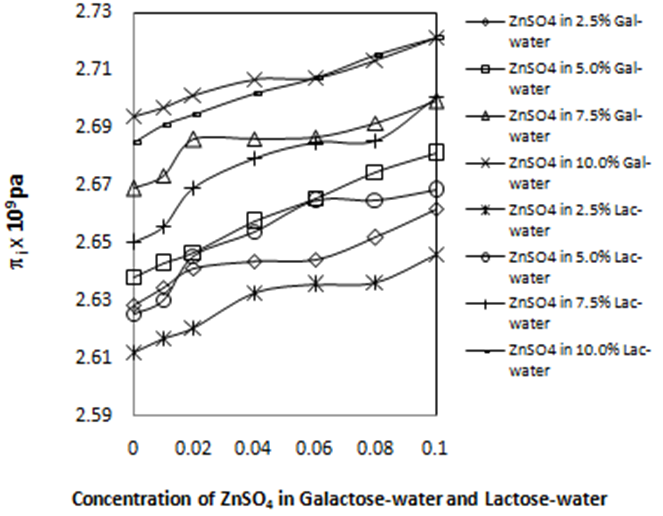
Fig. 11 Variation of internal pressure, (i vs Concentration (mole kg-1) of ZnSO4 in Galactose-water and Lactose-water mixed solvent at 303.15K.
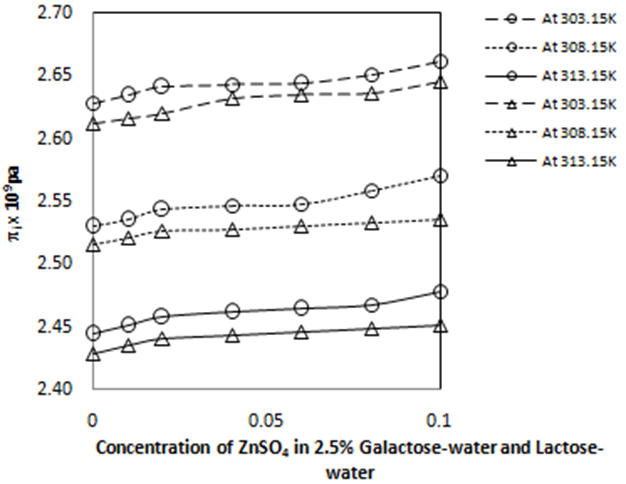
Fig. 12 Variation of internal pressure, (i vs Concentration (mole kg-1) of ZnSO4 in 2.5% Galactose-water and Lactose-water vs. Temperature (303.15K, 308.15K, 313.15K).
The apparent molal volumes, фv, of ZnSO4 have been calculated from the measured values of densities of mixed solvents and solutions using the following relation:
where, ρ0 and ρ are the densities of mixed solvents (aqueous-galactose, -lactose) and solutions, respectively; c is the molality of the solutions, M is the molar mass of the solute (ZnSO4). This is the shrinkage of the solution volume after mixing of the components, where same numbers of molecules are accommodated into comparatively smaller volume than the total volumes of the components. Presently, values of фv for ZnSO4 in aqueous-galactose and lactose mixed solvent are positive and mostly increasing with concentrations (Fig. 13). According to Gupta G and his group, the positive values of фv is indicative of strong solute-solvent interaction [55]. However, the values are not in a regular increasing trend with the concentration of lactose. This type of variation suggest that the galactose molecules interact more constructively with water to strengthen the H-bonded network in the mixed solvent systems than that of lactose [47]. In the literature there are reports showing that a higher value of фv is due to strong solute-solvent interaction [48].
Solvation number
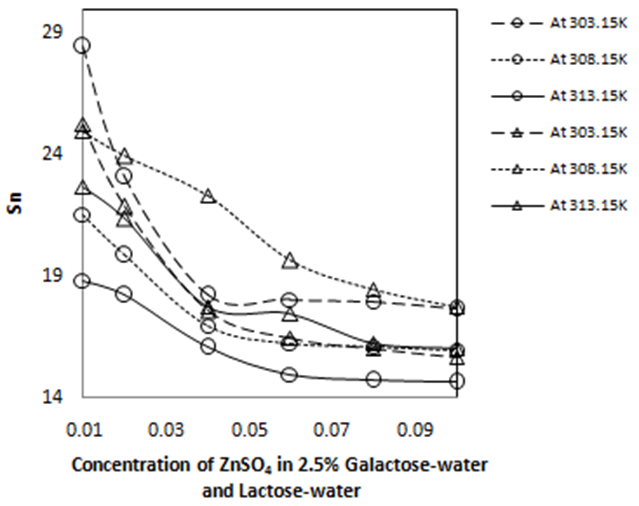
The speed of sound measurement is used to evaluate solvation number,
where, n0 and ni are the moles of solvent and solute,
respectively. As per the literature, there are basically two solvation sheaths,
primary and secondary. These can be studied with the help of speed of sound
measurements [50]. The association of
solvent molecules with the ion is a strong co-ordination bond type and occurs in
the primary sheath of solvation. On the other hand, in the secondary sheath,
there are weak forces of attaction between solute and solvent molecules.
However, the solvation indicates the association among solute with solvent
molecules.
Table 4 Calculated values of apparent molar compressibility, фK, apparent molar volume, фv, solvation number, Sn of ZnSO4 in 2.5%, 5.0%, 7.5% and 10% Galactose-water mixed solvent at 303.15K, 308.15K and 313.15K temperature.
| C mol.kg-1 | -фK x 10 10 N -1 .dm 5 .mol -1 | фv x 10 3 dm 3 .mol -1 | Sn | ||||||
|---|---|---|---|---|---|---|---|---|---|
| ZnSO4 in 2.5% Galactose -Water | |||||||||
| 303.15K | 308.15K | 313.15K | 303.15K | 308.15K | 313.15K | 303.15K | 308.15K | 313.15K | |
| 0.00 | |||||||||
| 0.01 | 1.948 | 1.308 | 1.043 | 68.38 | 87.94 | 97.72 | 28.4481 | 21.5268 | 18.8116 |
| 0.02 | 1.506 | 1.137 | 0.956 | 73.15 | 97.64 | 107.44 | 23.0721 | 19.8422 | 18.2036 |
| 0.04 | 1.066 | 0.905 | 0.777 | 87.57 | 99.74 | 112.00 | 18.1933 | 16.9449 | 16.0423 |
| 0.06 | 0.984 | 0.805 | 0.685 | 105.22 | 111.69 | 114.91 | 18.0341 | 16.2203 | 14.9548 |
| 0.08 | 0.953 | 0.792 | 0.666 | 112.62 | 113.77 | 116.17 | 17.9491 | 16.0973 | 14.7009 |
| 0.10 | 0.918 | 0.773 | 0.617 | 114.93 | 114.86 | 126.65 | 17.6391 | 15.9283 | 14.6283 |
| ZnSO4 in 5.0% Galactose - Water 1389. 1390. 1391. 1392. | |||||||||
| 303.15K | 308.15K | 313.15K | 303.15K | 308.15K | 313.15K | 303.15K | 308.15K | 313.15K | |
| 0.00 | |||||||||
| 0.01 | 1.644 | 1.163 | 1.342 | 89.18 | 118.10 | 88.86 | 26.0659 | 21.5809 | 22.4147 |
| 0.02 | 1.436 | 1.041 | 1.177 | 103.49 | 122.75 | 117.83 | 24.1845 | 20.1984 | 21.7908 |
| 0.04 | 0.999 | 0.765 | 0.851 | 112.75 | 124.77 | 119.86 | 18.9315 | 16.6598 | 17.5432 |
| 0.06 | 0.943 | 0.740 | 0.764 | 115.58 | 126.80 | 121.90 | 18.2919 | 16.3464 | 16.4442 |
| 0.08 | 0.928 | 0.688 | 0.737 | 116.80 | 127.61 | 123.93 | 18.0639 | 15.6461 | 16.1175 |
| 0.10 | 0.889 | 0.646 | 0.715 | 124.12 | 129.88 | 126.93 | 17.9537 | 15.2249 | 15.9989 |
| ZnSO4 in 7.5% Galactose - Water 1483. 1484. 1485. 1486. | |||||||||
| 303.15K | 308.15K | 313.15K | 303.15K | 308.15K | 313.15K | 303.15K | 308.15K | 313.15K | |
| 0.00 | |||||||||
| 0.01 | 1.171 | 1.295 | 1.072 | 99.63 | 89.99 | 89.83 | 20.7882 | 22.0151 | 19.2282 |
| 0.02 | 1.002 | 1.187 | 0.967 | 113.66 | 108.82 | 108.72 | 19.3441 | 21.5902 | 18.8040 |
| 0.04 | 0.864 | 0.894 | 0.781 | 115.64 | 110.81 | 110.72 | 17.5394 | 17.7667 | 16.3496 |
| 0.06 | 0.848 | 0.827 | 0.703 | 117.62 | 115.97 | 117.48 | 17.3543 | 17.0633 | 15.5660 |
| 0.08 | 0.830 | 0.783 | 0.679 | 121.96 | 119.53 | 119.47 | 17.2692 | 16.5955 | 15.2885 |
| 0.10 | 0.811 | 0.767 | 0.667 | 123.47 | 121.52 | 121.46 | 17.1006 | 16.4875 | 15.2372 |
| ZnSO4 in 10.0% Galactose - Water | |||||||||
| 303.15K | 308.15K | 313.15K | 303.15K | 308.15K | 313.15K | 303.15K | 308.15K | 313.15K | |
| 0.00 | |||||||||
| 0.01 | 1.297 | 1.252 | 1.486 | 91.07 | 81.62 | 118.87 | 22.4074 | 21.3315 | 26.5685 |
| 0.02 | 1.182 | 1.102 | 1.423 | 104.84 | 109.41 | 123.35 | 21.4666 | 20.7705 | 25.9324 |
| 0.04 | 0.971 | 0.951 | 1.060 | 111.43 | 113.68 | 125.29 | 18.9622 | 18.8944 | 20.9844 |
| 0.06 | 0.756 | 0.917 | 0.878 | 121.11 | 121.06 | 127.24 | 16.5023 | 18.7287 | 18.5399 |
| 0.08 | 0.748 | 0.817 | 0.829 | 123.43 | 123.39 | 128.02 | 16.4310 | 17.4094 | 17.8385 |
| 0.10 | 0.721 | 0.779 | 0.776 | 125.60 | 125.57 | 130.20 | 16.1981 | 17.0267 | 17.2276 |
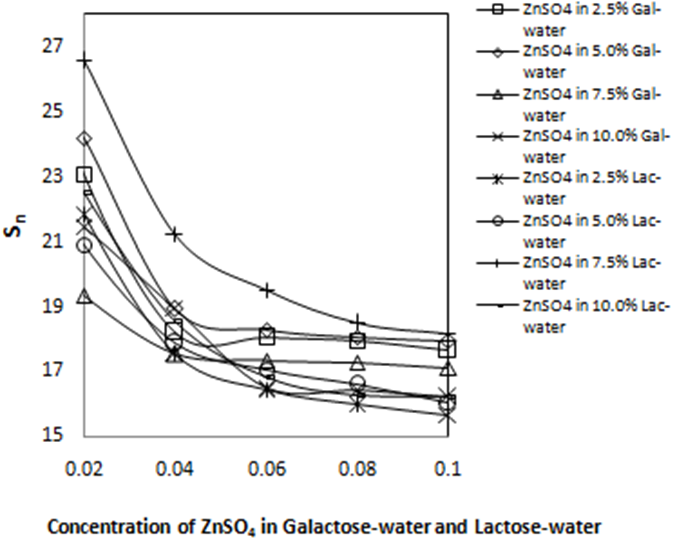
Fig. 14 Variation of Solvation number, Sn vs. Concentration (mole kg-1) of ZnSO4 in Galactose-water and Lactose-water mixed solvent at 303.15K.
Gibb´s free energy
The Gibb’s free energy, ΔG of the studied systems was calculated by using the relaxation time parameter and other constants.
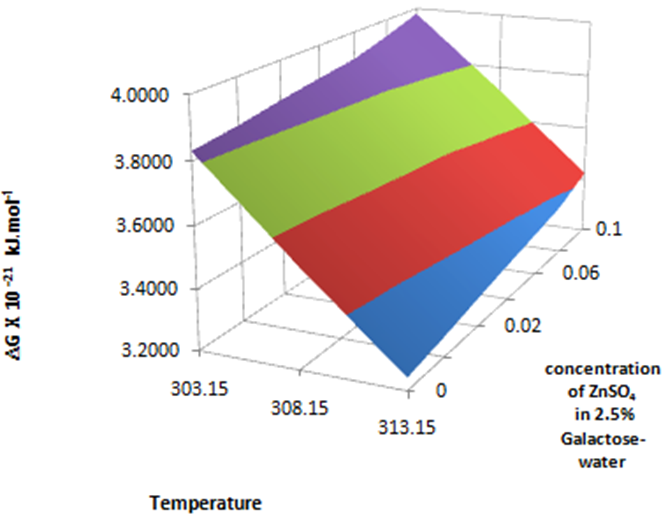
where k is Boltzmaan’s constant (1.23x10⁻²³ JK-1), T is the absolute temperature and h is Planck’s constant (6.6 x 10⁻³⁴ Js). It has been observed that the values of ΔG increase with ZnSO4 as well as with galactose and lactose concentrations. This type of variation suggests closer approach of unlike molecules due to H-bonding. Again ΔG decreases with temperature and it is indicative of the rearrangement of molecules in the mixtures [Representative 3-D plots for ZnSO4 in aqueous galactose mixed solvent at different temperatures (Fig. 16)]. Similar observation was reported earlier [54] and this reveals the decrease in energy leading to dissociation [44]
Conclusion
The results of the present study indicate the existence of ion-solvent or
solute-solvent interaction. ZnSO4 being an important transition metallic
salt for both biologically as well as pharmaceutically situations, interacts well
with these two saccharides in aqueous media. However, from speed of sound, density
and internal pressure, it is shown that there is strong cohesive force acting during
structure making of the solvents in presence of the solute. Relative association and
isentropic compressibility data reveal the structure-breaking and making of mixed
solvents in terms of ion-solvation. This compressibility also indicates that the
ion-solvent interactions are through ion-dipole type between zinc ion and
surrounding solvent molecules. However, the apparent molar compressibilty shows the
ion-solvent interactions of zinc ions to be larger in galactose systems than that in
lactose.

