


 text new page (beta)
 English (pdf)
 Article in xml format
 Article references
 Send this article by e-mail
 Cited by SciELO
  Similars in
SciELO
Similars in
SciELO 
 Permalink
Introduction
The increasing scarcity of fossil fuel reserves and the pollution caused by the high energy demand made of hydrogen (H2) an attractive alternative energy vector. Hydrocarbon steam reforming has attracted attention as an option to generate hydrogen for polymer electrolyte fuel cells [1]. When produced from biomass, bioethanol could be considered as a promising renewable source for H2 production. However, some problems related to its production have to be solved firstly, e.g., the costly purification of the raw feedstocks [2]. The hydrogen economy is still under discussion due to the pull of many sustainable biofuels and the new generation of synthetic biofuels [3]. Therefore, the production of efficiently green hydrogen from bioethanol steam reforming is of paramount importance. Ethanol can be efficiently converted into hydrogen using its catalytic reaction with steam according to the following chemical reaction [4]:
Ethanol steam reforming (ESR) is thermodynamically feasible [5] at temperatures as low as 300 ºC. However, H2 production is not favored at these temperatures, since CH4 is one of the main reaction products, is not reformed unless higher reaction temperatures are used. It is also important to keep low CO concentration to produce high-quality H2 that can be utilized as feedstock for fuel cell applications.
In the past years, there has been continuous research to develop commercial catalysts. Systems such as non-noble (Co, Cu, Ni, Fe) [6-11] and noble transition metals (Pt, Pd, and Rh) [11-17] have been tested in the ESR. From these, Rh has shown to be one of the most promising alternatives since it readily dissociates the ethanol C-C bond. Nevertheless, despite their high activity, Rh catalysts can also deactivate due to carbon deposition, as has been reported by Sharma et al. [12]. The deactivation by coke formation can be overcome with oxygen addition on the flow or increasing the operating temperature. CeO2 and CexZr1-xO2 mixed oxides have been recognized as supports for noble metals on ESR and some other oxidation reactions since they possess excellent redox properties and high oxygen mobility [18-20]. The oxygen mobility can promote the oxidation of CO2 and CHx adsorbed species while activating water to regenerate the surface of the support and release H2 [21-34]. Studies have exhibited that the addition of ZrO2 to CeO2 could improve its redox properties and increase its oxygen storage capacity and thermal stability when used as catalyst support [23-25].
Research on the precursor's influence to synthesize this kind of support has been undertaken for several reactions. However, to our knowledge, it has not been investigated for ethanol reforming catalysts. Therefore, this work focuses on the cerium salt precursor's effect and the support composition on the structural, electronic, and redox properties of the Rh/CexZr1-xO2 catalysts in the steam reforming of ethanol at low-temperature. The results were preliminarily discussed at this stage, considering the ESR's activity and hydrogen yield at low temperatures (300-400 °C).
Experimental
Supports and catalysts preparation
CexZr1-xO2 supports were prepared using the co-precipitation method, varying the cerium salt precursor, as reported by Letichevsky et al. [26]. Two different series of materials were synthesized, CexZr1-xO2-N and CexZr1-xO2-A. The CexZr1-xO2-N series was developed using Ce(NO3)3·6H2O (99.99 %) as Ce precursor, whereas CexZr1-xO2-A materials were prepared using (NH4)2Ce(NO3)6 (99.99 %); in both cases, ZrO(NO3)2·xH2O (99.99 %) was used as a Zr source. The synthesis procedure is described below. For each synthesis, 0.15 M aqueous solution containing both salts precursors was prepared, and the pH value adjusted to 10 by dropwise addition of a 30 vol.-% ammonia aqueous solution. The obtained precipitated hydroxides were filtered and washed with deionized water. The precipitates were aged overnight at room temperature, dried at 120 °C for two hours, and calcined at 500 °C for 5 hours.
The 1.0 wt.-% Rh catalysts were prepared by the wet impregnation technique using an aqueous solution of Rh(NO3)3·xH2O (99.99 %). After impregnation, materials were aged overnight at room temperature, dried at 120 °C for 2 hours, and calcined at 450 °C for 5 hours. The resulting CexZr1-xO2 supports and Rh supported catalysts were stored under dry conditions for further characterization and catalyst preparation. Sigma-Aldrich Co. provided the reactants above.
Supports and catalysts characterization
The textural properties were determined by N2 physisorption at -196 °C on an AUTOSORB instrument. All samples were previously degassed (< 10-4 Pa) at 300 °C. Specific surface area (SBET) was calculated by the Brunauer-Emmet-Teller (BET) equation applied to relative pressures (P/P0) 0.1-0.3. The average pore diameter (DP) was calculated by the Barret-Joyner-Halenda method (BJH). X-ray diffraction (XRD) patterns for calcined supports were recorded using a D5000 Siemens diffractometer using a CuK radiation ( = 0.1538 nm). An operating voltage of 40 kV, current of 30 mA, and graphite monochromator were used. The angular range was varied from 20 to 80°, with increments of 0.02° and counting time of 4 s per step. Average crystallite sizes were determined using the Scherrer equation. Temperature-programmed reduction experiments were carried on an ISRI instrument equipped with a thermal conductivity detector. Before each experiment, 100 mg of the sample was introduced in a quartz reactor, heated at 300 °C in an N2 flow, and held for one hour to remove possible contaminants. After that, a (10 vol.-%)H2/Ar gas mixture flowed into the quartz reactor and heated at a rate of 10 °C∙min-1 from room temperature to 1000 °C.
Diffuse reflectance UV-Vis (DR UV-Vis) spectra were recorded in the 200-800 nm range at a scanning rate of 240 nm∙min-1 using a PerkinElmer Lambda 35 spectrometer equipped with an integration sphere (Labsphere RSA-PE-20). The instrument was calibrated with a LabSphere Spectralon 99% reflectance standard. Raman spectra were recorded using a Raman module coupled to a confocal microscope (Xplora from HORIBA Jobin Yvon), with the confocal hole set to 300 nm. Spectra were recorded with a 638 nm excitation source, a diffraction grating of 600 lines∙mm-1, and the slit-set to 50 μm. A Peltier cooled CCD was used for detection and analysis. The exposition time to the laser source for the acquisition was 6 seconds for each sample. The X-ray photoelectron spectroscopy (XPS) experiments were carried out using a Riber LDM-32. Energy positions of the peak maxima were calibrated using the BE of the C 1s peak from the tape at 284.8 eV as a reference to correct the spectra.
Activity measurements
Ethanol steam reforming experiments were conducted in a continuous flow microreactor (Pyrex; 9 mm I.D.) at atmospheric pressure. Molar water:ethanol= 3:1 mixture supplied to a vaporizer (130 °C) as a liquid flow at 1.8 mL·h-1, N2 flow (100 cm3(STP)·min-1) was used as the vapor carrier and 150 mg of catalyst (150-180 μm particle size) was used in each experiment. Before catalytic activity evaluation, catalysts were reduced in-situ at 180 °C with 100 cm3(STP)·min-1 of a (10 vol.-%)H2/N2 mixture. Subsequently, the reactor was heated to the reaction temperature (300-400 °C), and then the water-ethanol-carrier mix was fed into the reactor. Reaction products were analyzed online with an HP5890 series II gas chromatograph equipped with a thermal conductivity detector (TCD) and flame ionization detector (FID). The conversion of ethanol (x E ) and the percent yields of H2 (Y H2 ) and CO2 (Y CO2 ) were defined using equations (2), (3), and (4), respectively.
Results
N2 adsorption-desorption isotherms
The specific surface area (S BET ), pore volume (V P ), and pore diameter (D P ) obtained for the different supports are summarized in Table 1. The A-series mixed oxides' specific surface areas were higher than pure CeO2-A by a factor around 2. Compared to CeO2-A, both CeO2-N and ZrO2 samples showed 18 % higher S BET values. This difference does not seem to be relevant, and it can be assumed that, in general, the area of the pure CeO2 materials was independent of the used precursor. However, for N-series mixed oxides, the S BET of the Ce0.75Zr0.25O2-N and Ce0.5Zr0.5O2-N materials decreased by 0.84 and 0.75, respectively, when compared to CeO2-N. The V P increased with Zr content for the A-series mixed oxides, whereas an opposite trend was observed for the N-series of materials. Finally, it was not observed a clear relation with the Zr content regarding the D P , although it should be mentioned that D P values were higher for the N-series than for the A-series.
X-ray diffraction (XRD)
The XRD patterns correspondent to the CexZr1-xO2-A and CexZr1-xO2-N materials are shown in Fig. 1. The structural data acquired from the analysis of the diffractograms are compiled in Table 2. Regardless of the precursor used for the synthesis procedure, the pure CeO2 materials showed typical XRD patterns corresponding to a cubic fluorite-type structure (PDF-34-0394).
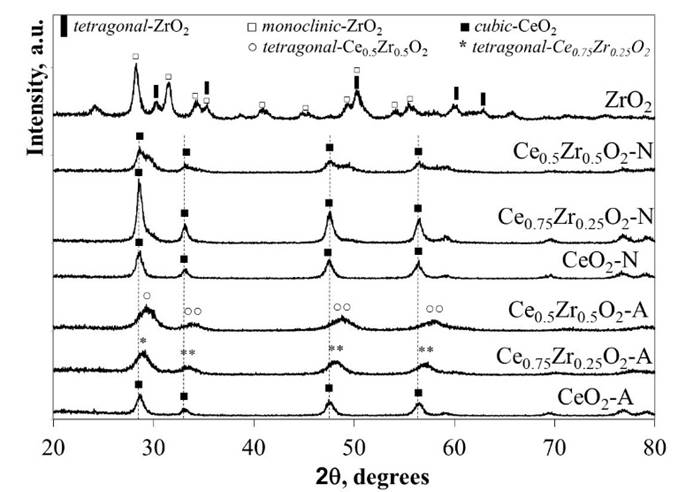
Table 2 Crystallite structure, the average crystallite size (determined from Scherrer’s equation), and cell parameter of the CeO2, CexZr1-xO2, and ZrO2 supports.
| Sample | Structure | d c , nm | a, Å |
|---|---|---|---|
| CeO2-A | Cubic | 22 | 5.41 |
| Ce0.75Zr0.25O2-A | Cubic | 10 | 5.34 |
| Ce0.5Zr0.5O2-A | Tetragonal | 8 | 5.31 |
| CeO2-N | Cubic | 24 | 5.41 |
| Ce0.75Zr0.25O2-N | Cubic | 26 | 5.41 |
| Ce0.5Zr0.5O2-N | Cubic | 18 | 5.41 |
| ZrO2 | Tetragonal Monoclinic | 22 - | - - |
XRD patterns for CexZr1-xO2-A materials fitted well with typical tetragonal structures of the CexZr1-xO2-type solid solutions (PDF-38-1436 and PDF-28-0271, respectively), both consistent with its respective nominal Ce and Zr stoichiometry. Neither Ce0.75Zr0.25O2-A nor Ce0.5Zr0.5O2-A showed additional diffraction peaks suggesting the absence of other crystalline phases as ZrO2, CeO2, or its mixed oxides (at least above 5 nm; limited by the resolution of the technique) when (NH4)2Ce(NO3)6 was used as cerium precursor. The A-series materials' DRX patterns displayed a reflection shift at higher 2θ angles as the Zr fraction was increased. These shifts are consistent with the material unit cells' contraction due to partial substitution of Ce4+ cations for Zr4+ ions with a minor ionic radius (0.97 vs. 0.84 Å, respectively), leading to the formation of solid solutions in agreement with previous reports [25-27]. The decrease in the cell parameter (a), CeO2-A compared to Ce0.5Zr0.5O2-A (5.41→5.31 Å) and Ce0.75Zr0.25O2-A (5.41→5.34 Å; see Table 2), was consistent with the ionic substitution and formation of CexZr1-xO2 solid solution.
A broadening of diffraction peaks was observed in the CexZr1-xO2-A mixed oxides as Zr content was increased, suggesting that Zr presence in the CeO2 lattice inhibited the sintering of crystallites during the calcination step. The above was confirmed with the average crystallite size values estimated by Scherrer’s method included in Table 2. The average crystallite size showed a decrease from 22 to 8 nm for the pure CeO2-A and CexZr1-xO2-A materials, respectively. Finally, neither Ce0.75Zr0.25O2-A nor Ce0.5Zr0.5O2-A showed diffraction peaks corresponding to the crystalline phases of ZrO2, suggesting that ZrO2 not be segregated when (NH4)2Ce(NO3)6 was used as a cerium precursor.
For the N-series of mixed oxides, the XRD patterns did not show shifts in their diffraction lines, as obtained for the A-series materials. Besides, we observed the presence of two shoulders c.a. 29.5 and 49.3º in 2θ, related to the monoclinic and tetragonal phases of ZrO2 or the formation of a CexZr1-xO2 rich in Zr. In this sense, three phases (monoclinic, tetragonal, and cubic) for the CexZr1-xO2 system has been well described by Yashima [28]. The formation of a monoclinic symmetry for CeO2 is favored at low contents (< 10 % molar fraction), while the cubic phase becomes predominant at above 80 wt.-% CeO2. The tetragonal phase is obtained between the mentioned ranges, and it is possible to distinguish between three tetragonal arrangements depending on its distortion. In this sense, the patterns' structural data analysis fits well with the Fm3m space group related to a cubic phase. It was reported that one of the transition tetragonal metastable phases shows no tetragonality of the cation sublattice, and it is possible to be indexed in the cubic Fm3m space group [29]. This result is discussed in the next section under the light of the Raman spectroscopy analysis. The results allowed us to conclude that Ce(NO3)3 as a synthesis precursor does not lead to the formation of homogeneous solid solutions but phase segregation. No definite relation between average crystallite sizes of these materials with their composition could be observed. Hence, the presence of Zr did not prevent the sintering of the material during the calcination step, when Ce(NO3)3 was used as a precursor.
Raman Spectroscopy
The structural properties of the prepared materials were likewise analyzed by Raman spectroscopy (Fig. 2). The main band located among 400-500 cm-1 corresponds to the symmetric F2g vibrational mode of the Ce-O8 unit, where only the O atoms exhibit vibrational modes [30-32]. This band is highly sensitive to any displacement at the oxygen sub-lattice caused by stoichiometry changes, composition, or crystallite size. Both CeO2-A and CeO2-N samples exhibited a vibrational mode of pure CeO2 (459 cm-1). It was possible to observe in Fig. 2a that this band decreased in intensity and widened as Zr content was increased in the bare CexZr1-xO2-A oxides. Furthermore, the same band shifted for the respective Ce0.75Zr0.25O2-A (459→468 cm-1) and Ce0.5Zr0.5O2-A (459→466 cm-1) materials due to a change in their cell parameters [32].
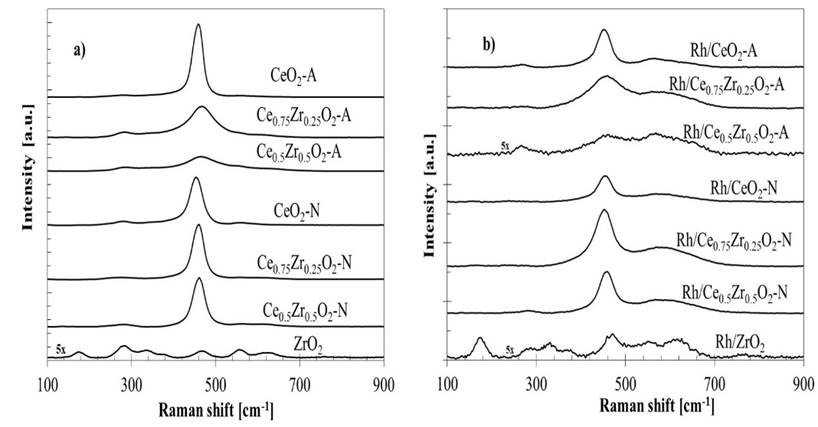
The Raman spectra measured from the CexZr1-xO2-N materials exhibited a similar band shifted, Ce0.75Zr0.25O2-N (459→461 cm-1) and Ce0.5Zr0.5O2-N (459→463 cm-1), suggesting structural changes in the material concerning CeO2-N. However, the N-series mixed oxides spectra did not show significant variations in the band's intensity, suggesting that the abundance of structural Ce-O8 units in these materials was similar to the pure CeO2 oxide. These results indicate that CexZr1-xO2-N materials were composed mainly of CeO2, with a solid solution with a different composition than the nominal value, as proposed by XRD analysis.
The spectrum correspondent to the ZrO2 showed at least seven peaks, and several vibrational modes could de overlapped. The monoclinic phase with Raman-active modes at 176, 380, 475, and 640 cm-1 and the tetragonal phase with four Raman active modes at 276, 313, 470, and 640 cm-1. All acquired spectra for CexZr1-xO2-A and CexZr1-xO2-N materials exhibited a vibrational mode at 280 cm-1, related to the tetragonal ZrO2 phase. This band does not vary with Zr's presence, and it was also observed in pure CeO2 of both series. Therefore, that band could be attributed to the O atoms' displacement from its ideal position in the fluorite structure [33]. The band located at 570 cm-1 has been ascribed to O vacancies [32] and can barely be noticed in the supports. Furthermore, a broadening of the main band for the CexZr1-xO2-A mixed samples indicates a less ordered structure than pure CeO2-A.
For the Rh catalysts, a decrease in intensity was observed for all acquired spectra (Fig. 2b), suggesting a loss of crystallinity and the structure order due to metal-support interactions; these interactions could improve the diffusion of oxygen as it has been pointed out by other authors [28,29,34]. Also, supplementary broadband appears between 540-660 cm-1 were observed for Rh supported catalysts and associated with two different signals, 550 and 600 cm-1. The first band (~550 cm-1) was related to oxygen vacancies generated as charge compensation defects induced by introducing other metal cations into the lattice of CeO2 to maintain the charge neutrality when Ce4+ ions are replaced by other metal ions [35,36]. The second band (~600 cm-1) was assigned to non-stoichiometry oxygen vacancy in the CeO2-like matrix by reducing Ce4+ to Ce3+ [35,37]. According to the above, the appearance of 540-660 cm-1 signals is related to the formation of oxygen vacancies and a partial support reduction induced by surface defects adjacent to Rh clusters embedded in the support, suggesting a strong metal-support interaction effect.
Temperature-programmed H2-reduction
Fig. 3 shows the TPR profiles for pure and mixed oxide supports and supported Rh catalysts. Both CeO2-A and CeO2-N TPR profiles were similar and presented two main reduction peaks. The first one at approximately 520 °C corresponded to the Ce4+→Ce3+ surface reduction process, whereas the second peak between 760-960°C was assigned to the material's bulk reduction process [18]. The low-temperature peak, formerly at 520 °C for CeO2-N, shifted to 570 and 600 °C for Ce0.75Zr0.25O2-N and Ce0.5Zr0.5O2-N materials, respectively. The high-temperature peak, centered at 780 °C for the CeO2-N support, decreased in intensity with increasing Zr content. The TPR profile for CeO2-A also exhibited the two reduction peaks described above, although the consumption of H2 related to the bulk reduction process was higher than in the CeO2-N material. For the CexZr1-xO2-A solid solutions, the bulk reduction process disappearance resulting from the incorporation of Zr and only the peak centered ~570 °C associated with the Ce4+→Ce3+ surface reduction was conserved. It is likely that the high-temperature peak had shifted to lower temperatures and, therefore, had overlapped with the low-temperature peak. In this regard, Zr's incorporation in the CeO2 lattice promotes the surface and bulk reduction of the material due to increased oxygen bulk diffusion to the surface [38,39]. Hence, the reduction temperature of the bulk decreases. ZrO2 was the less reducible material showing only one reduction peak at 640 °C.
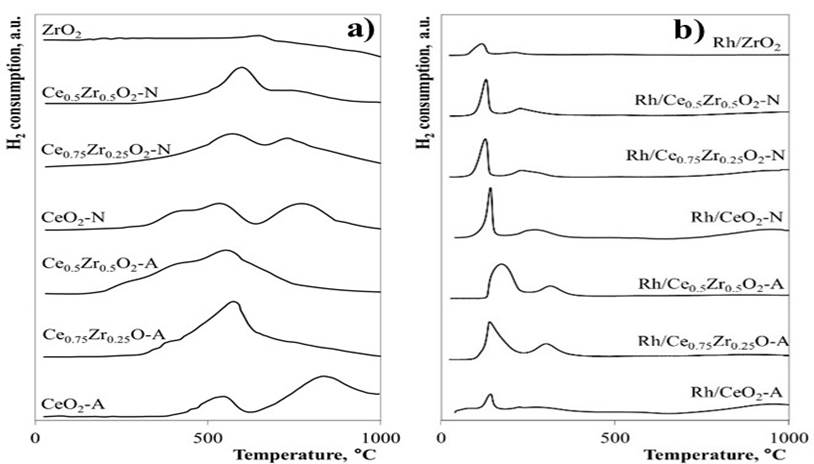
The TPR profiles for the Rh catalysts are shown in Fig. 3b. The Rh/CeO2 catalysts exhibited three reduction peaks centered at 140, 250, and 950 °C. The first reduction peaks have been attributed to the consecutive reduction of highly-dispersed Rh2O3 particles and the support surface adjacent to the metal [40, 41], the second peak is related to bulk-like crystalline in large Rh2O3 particles [15], and the last peak is due to the reduction of the CeO2 bulk [18]. In Rh/CexZr1-xO2-A catalysts, the first two reduction peaks showed a widening as Zr content increased due to a slowdown of Rh-supported species' reduction processes caused by relatively larger Rh2O3 particles or stronger metal-support interactions. In contrast, Rh/CexZr1-xO2-N catalysts showed a slight shift of the Rh2O3 reduction peaks toward lower temperatures suggesting the formation of highly-dispersed and more easily reducible Rh species. Rh catalysts exhibited significantly lower consumption of H2 when compared to the respective supports. This effect has been associated with a partial surface reduction before reducing H2 due to strong metal-support interactions, giving rise to oxygen vacancies adjacent to the metal particles [42], consistent with Raman results.
Diffuse Reflectance UV-Vis (DR UV-Vis)
Fig. 4 shows the diffuse reflectance spectra of the synthesized materials in the UV-visible range, plotted using the Kubelka-Munk function, which is related to the diffuse reflectance of the sample according to the equation (5):
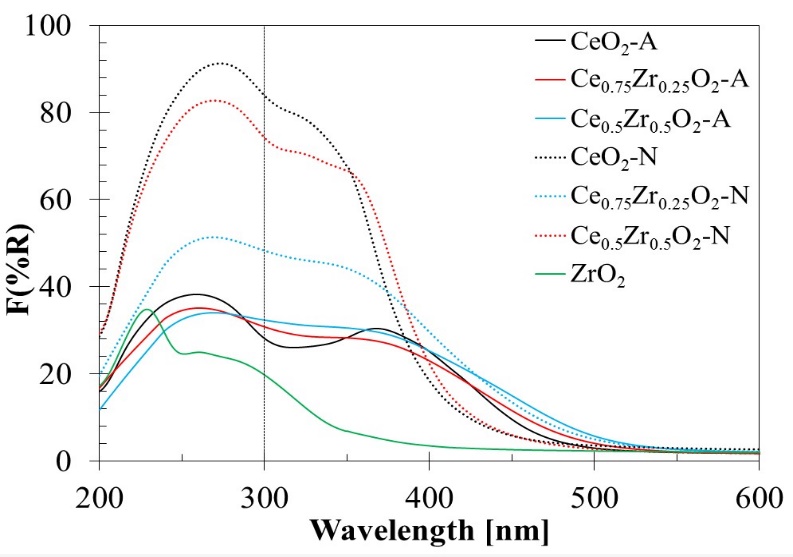
where, R is the absolute value of reflectance.
It has been reported that bulk CeO2 shows only one strong absorption band with its maxima at 300 nm and its absorption threshold near 400 nm [43]. Two absorption bands located at 234-275 nm and 275-380 nm have also been attributed to low-coordination charge transfer transitions of Ce3+←O2- and Ce4+←O2- [24, 44-46], respectively. The ZrO2 spectra presented two absorption bands at 232 and 267 nm that could be associated with a predominant presence of the monoclinic ZrO2 phase [24]. Only the first one at 232 nm is related to the Zr4+←O2- charge transfer transitions from these two bands. It corresponds to electrons' excitation from the valence band to the conduction band, while the band at 267 nm is usually associated with impurities [47].
For the CexZr1-xO2-A and CexZr1-xO2-N materials, a first region observed in 200-300 nm range, and the other between 300 and 450 nm. Within the first region, an absorption band centered at 260 nm for CexZr1-xO2-A was observed, while the maxima were located at 280 nm for CexZr1-xO2-N. CexZr1-xO2-A materials displayed a decrease in intensity (8-12 %) on the shoulder at 260 nm with increasing Zr content, on the Zr-free sample. Based on the Zr-free sample, the decrease observed in the absorption band's intensity at 280 nm for Ce0.75Zr0.25O2-N and Ce0.5Zr0.5O2-N was 12 and 44 %, respectively.
A less intense absorption shoulder was observed at ca. 370 nm and, as it was discussed before, can be attributed to the Ce4+←O2- charge transfer transition. In this region, it was also possible to observe the absorption edge. The adsorption edges shifted to higher wavelengths, scrolling 480 nm for CeO2-A to 507 and 525 nm, Ce0.75Zr0.25O2-A and Ce0.5Zr0.5O2-A, respectively. For CexZr1-xO2-N supports, similar behavior was observed: from 420 nm (CeO2-N) to 435 and 502 nm for Ce0.75Zr0.25O2-N, and Ce0.5Zr0.5O2-N, respectively. The presence of ZrO2 could be causing shifts of absorption bands due to the distortion of the fluorite structure by introducing Zr4+ cations [48]. Because of the presence of Zr4+ ions, a shift to lower wavelengths for the charge transfer band and a shift to higher wavelengths for the absorption threshold reflecting defects can be expected. Indeed, both phenomena have been observed in our samples.
Equation (6) gives the energy dependence of the absorption coefficient (α) for semiconductors in the region near the absorption edge:
where, hv is the energy of the incident photons, and E g is the optical absorption edge energy; the exponent n depends on the type of optical transition produced by photon absorption. With an appropriate choice of n, a plot of (αhV) 1/n vs. hv should be linear near to the edge, and the intercept of the line on the abscissa at (αhv) 1/n = 0 gives E g [49]. UV-vis reflectance data cannot be used directly to measure α because of scattering contributions to the reflectance spectra. Scattering coefficients, nevertheless, depend feebly on energy, and F(%R) can be assumed to be proportional to the absorption coefficient. Therefore, if the data are treated as (F(%R)hv)1/n and plotted vs. hv, this plot can be used to obtain the bandgap energy [46]. Fig. 5 shows the transformed UV-Vis spectra for the different oxides, and the obtained E g values are presented in Table 3. For pure CeO2-N value of 3.24 eV was estimated, which agrees with the value of 3.2 eV previously reported [50]. However, the Eg values for both materials decreased as Zr's amount increased in the support. This effect might be associated with a rise of trivalent Ce3+ located at CeO2 grain boundaries and, in a minor proportion, around oxygen vacancy sites, as reported by Patsalas et al. [51]. Similarly, the lower values obtained for the CexZr1-xO2-A materials indicated a larger concentration of Ce3+ than in the case of the CexZr1-xO2-N oxides. These results also suggested an increase in oxygen mobility in these materials, which would lead to an increase in their capacity for oxygen storage and improved redox properties as the amount of Zr was increased in the support.
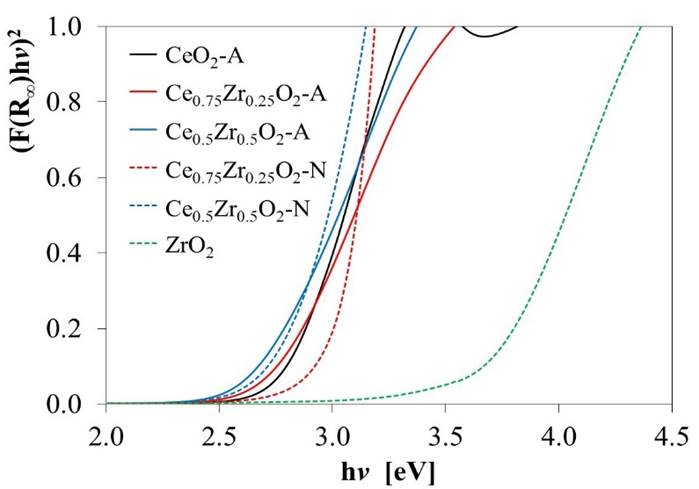
Fig. 5 Transformed diffuse reflectance UV-Vis spectra used to estimate the bandgap energy values (E g ) reported in Table 3.
Table 3 Bandgap energy values (E g ) for CeO2, ZrO2, and CexZr1-xO2 supports, estimated from the onsets in Fig. 5.
| Estimated E g , eV | ||
|---|---|---|
| Material | -A series | -N series |
| CeO2 | 2.79 | 3.24 |
| Ce0.75Zr0.25O2 | 2.73 | 3.15 |
| Ce0.5Zr0.5O2 | 2.67 | 2.88 |
| ZrO2 | 3.67 | 3.67 |
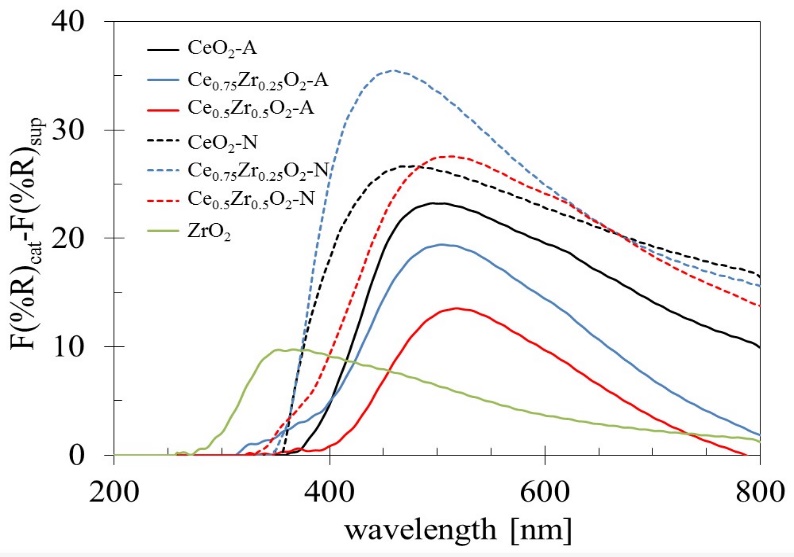
To obtain an approximation of the absorption bands corresponding to Rh species in the catalysts, the spectra of the supports (F(%R) sup ) were subtracted to those obtained for the Rh catalysts (F(%R) cat ) (Fig. 6). As a result, all Rh catalysts showed a distorted absorption band with maximums between 275 to 520 nm, and a shoulder located around 600 nm. This broadband would be formed by the contribution of two absorption bands located at 320 and 410 nm, corresponding to the allowed transition 1A1g→1T1g, 1T2g of Rh3+ dispersed ions [52]. Also, it has been reported that Rh0 nanoparticles give broadband form 300-800 nm [53], and the band intensity at 600 nm has been used as a measure of the amount of metallic Rh0 [48]. In general terms, the Rh/CexZr1-xO2-N catalysts exhibited more intense bands than those observed with the Rh/CexZr1-xO2-A catalyst. The main band observed for the Rh catalysts (regardless of the Ce precursor used in synthesis) seems to be centered at different wavelengths depending on the support and makes it challenging to interpret: ~350 nm for Rh/ZrO2, at 460 nm for CeO2-N and Ce0.75Zr0.25O2-N, and finally at 520 nm for CeO2-A, Ce0.75Zr0.25O2-A, Ce0.5Zr0.5O2-A, and C0.5Zr0.5O2-N. The intensity at 600 nm suggested that the decrease in Zr content in Rh/CexZr1-xO2-A catalysts increased superficial Rh0 particles, while an inverse behavior was noticed in Rh/CexZr1-xO2-N catalysts.
Catalytic evaluation
The catalytic activity data on the ethanol steam reforming for the catalysts are listed in Tables 4 to 6. The conversion and product distribution at different temperatures showed that the Rh/CexZr1-xO2-A catalysts (Rh-A series) resulted in higher activity than the Rh/CexZr1-xO2-N materials (Rh-N series), particularly at 300 °C. The exception was the Rh/CeO2-A catalyst that at 300 °C only converted 7% of the ethanol-fed. In the Rh-A catalysts series, conversion increased with Zr content, although this effect was not apparent at 350 and 400 °C, where both Rh/Ce0.75Zr0.25O2-A and Rh/Ce0.5Zr0.5O2-A catalysts reached 100% ethanol conversion. In contrast, the Rh-N catalysts series did not show any apparent relation between support composition and ethanol conversion. At 400°C, almost all catalysts reached 100 % ethanol conversion, except for Rh/CeO2-A and Rh/Ce0.75Zr0.25O2-N, which only exhibited 83 and 70%, respectively. It is also noteworthy that all the catalysts tested in this work showed good stability during the experiments' whole duration (5 h). The results obtained with the Rh/CeO2-A catalyst at 300°C indicated that the first step in the ESR consists of the dehydrogenation to produce acetaldehyde, i.e., equation (7).
Table 4 Conversion and product distribution at 300 °C.
| Catalyst | Conversion, % | Product distribution | ||||
|---|---|---|---|---|---|---|
| H2 | CO2 | CH4 | CO | CH3CHO | ||
| Rh/CeO2-A | 7 | 0.50 | 0.00 | 0.00 | 0.00 | 0.50 |
| Rh/Ce0.75Zr0.25-A | 76 | 0.32 | 0.02 | 0.36 | 0.30 | 0.00 |
| Rh/Ce0.5Zr0.5-A | 84 | 0.71 | 0.23 | 0.04 | 0.02 | 0.00 |
| Rh/CeO2-N | 68 | 0.61 | 0.16 | 0.12 | 0.12 | 0.00 |
| Rh/Ce0.75Zr0.25-N | 21 | 0.69 | 0.15 | 0.06 | 0.05 | 0.05 |
| Rh/Ce0.5Zr0.5-N | 62 | 0.61 | 0.15 | 0.11 | 0.12 | 0.01 |
| Rh/ZrO2 | 46 | 0.61 | 0.10 | 0.11 | 0.15 | 0.03 |
Table 5 Conversion and product distribution at 350 °C.
| Catalyst | Conversion, % | Product distribution | ||||
|---|---|---|---|---|---|---|
| H2 | CO2 | CH4 | CO | CH3CHO | ||
| Rh/CeO2-A | 36 | 0.50 | 0.04 | 0.22 | 0.19 | 0.06 |
| Rh/Ce0.75Zr0.25O2-A | 100 | 0.41 | 0.21 | 0.33 | 0.06 | 0.00 |
| Rh/Ce0.5Zr0.5O2-A | 100 | 0.63 | 0.24 | 0.12 | 0.02 | 0.00 |
| Rh/CeO2-N | 98 | 0.63 | 0.22 | 0.12 | 0.04 | 0.00 |
| Rh/Ce0.75Zr0.25O2-N | 43 | 0.58 | 0.16 | 0.16 | 0.06 | 0.04 |
| Rh/Ce0.5Zr0.5O2-N | 90 | 0.63 | 0.20 | 0.11 | 0.06 | 0.00 |
| Rh/ZrO2 | 93 | 0.61 | 0.13 | 0.10 | 0.16 | 0.01 |
Table 6 Conversion and product distribution at 400 °C.
| Catalyst | Conversion, % | Product distribution | ||||
|---|---|---|---|---|---|---|
| H2 | CO2 | CH4 | CO | CH3CHO | ||
| Rh/CeO2-A | 83 | 0.74 | 0.24 | 0.01 | 0.01 | 0.00 |
| Rh/Ce0.75Zr0.25O2-A | 100 | 0.45 | 0.23 | 0.30 | 0.02 | 0.00 |
| Rh/Ce0.5Zr0.5O2-A | 100 | 0.65 | 0.24 | 0.10 | 0.01 | 0.00 |
| Rh/CeO2-N | 100 | 0.66 | 0.24 | 0.08 | 0.01 | 0.00 |
| Rh/Ce0.75Zr0.25O2-N | 70 | 0.63 | 0.20 | 0.11 | 0.04 | 0.01 |
| Rh/Ce0.5Zr0.5O2-N | 100 | 0.59 | 0.22 | 0.15 | 0.04 | 0.00 |
| Rh/ZrO2 | 100 | 0.65 | 0.21 | 0.09 | 0.05 | 0.00 |
The Rh supported on -A material series did not produce acetaldehyde in the range of temperatures studied in this work. While at 300 °C, the mixed oxides of the Rh-N series could not completely reform it. Even at 400°C, some acetaldehyde was observed when the Rh/Ce0.5Zr0.5O2-N catalyst was used. Although, product distribution provided a global landscape of both: the temperature effect and catalyst composition on the percent yield of the different catalysts. It is even more important to analyze how such variables affected the H2 production and the H2 and CO2 yields. Hence, the H2 production and the H2 (Y H2 ) and CO2 (Y CO2 ) yields have been summarized in Table 7.
Table 7 H2 produced, and H2 and CO2 yields (Y H2 and Y CO2 ) at different temperatures
| 300°C | 350°C | 400°C | |||||||
|---|---|---|---|---|---|---|---|---|---|
| Catalyst | n H2,out , mol | Y H2 | Y CO2 | n H2,out , mol | Y H2 | Y CO2 | n H2,out , mol | Y H2 | Y CO2 |
| Rh/CeO2-A | 0.07 | 33.3 | 0.0 | 0.43 | 37.8 | 7.0 | 4.66 | 97.3 | 92.3 |
| Rh/Ce0.75Zr0.25O2-A | 0.67 | 29.4 | 2.9 | 1.40 | 38.9 | 35.0 | 1.56 | 41.7 | 41.8 |
| Rh/Ce0.5Zr0.5O2-A | 4.00 | 89.6 | 79.3 | 3.37 | 72.7 | 63.2 | 3.66 | 76.2 | 68.6 |
| Rh/CeO2-N | 2.04 | 71.4 | 40.0 | 2.81 | 73.8 | 31.7 | 3.66 | 78.0 | 60.0 |
| Rh/Ce0.75Zr0.25O2-N | 0.63 | 71.1 | 41.7 | 3.20 | 72.1 | 57.9 | 4.00 | 80.5 | 72.7 |
| Rh/Ce0.5Zr0.5O2-N | 1.83 | 71.1 | 37.5 | 3.90 | 54.5 | 34.8 | 2.19 | 70.7 | 54.1 |
| Rh/ZrO2 | 1.14 | 65.0 | 23.8 | 2.97 | 73.5 | 54.1 | 2.88 | 66.3 | 53.7 |
For the Rh-A series, it was observed that at 300 and 350°C, increasing the amount of Zr in the support resulted in a rise of H2 production and both Y H2 and Y CO2 . At 400°C, the CH4 produced in the reaction masked the effect of the support composition in the Rh-A catalysts series. Conversely, there was no apparent effect of the support composition on H2 production for the Rh-N catalysts series. Despite the differences of produced hydrogen, similar Y H2 were observed with these materials, particularly at low temperatures. In Y CO2 , Table 7 shows that save for a few exceptions; its behavior was similar to Y H2 .
X-ray photoelectron spectroscopy (XPS)
XPS measures were carried out to obtain further information about the rhodium particles' chemical environment supported on the CexZr1-xO2-N samples. Fig. 7 shows the Ce 3d (A) and Zr 3d (B) emission regions spectra obtained for the calcined CexZr1-xO2-N samples as well for the Rh/CexZr1-xO2-N samples. The region between 894-875 eV corresponds to Ce 3d5/2, and the region between 894 to 913 eV corresponds to Ce 3d3/2. Usually, the emission region of the Ce 3d decomposed with the contribution of two Ce cationic species. Peaks centered at 882 and 898 eV are typically related to Ce4+ states, while shoulders observed at 885 and 901 eV are assigned to Ce3+. The Zr 3d core level emission region usually overlaps the Zr 3d5/2 line with binding energy (BE) of 180.5 eV and the Zr 3d3/2 line with BE of 182.5 eV [54]. The observed region of emission and BE values for the Ce 3d and Zr 3d emission regions for CeO2-N (a), Rh/CeO2-N (b), pure ZrO2 (e), and Rh/ZrO2 (f) resulted in good agreement with the literature [55]. While for the mixed Ce0.5Zr0.5O2-N (c) and Rh/Ce0.5Zr0.5O2-N (d) samples, a small BE shift to lower values (0.6 to 1.1 eV) in both regions was observed.
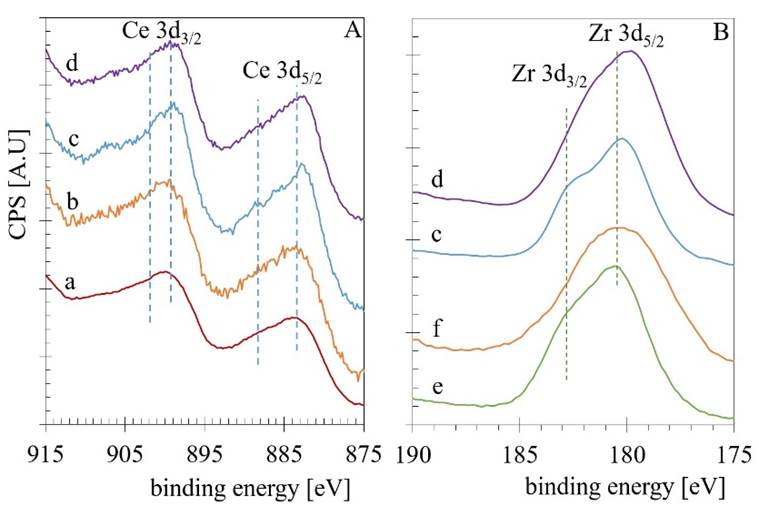
Fig. 7 The Ce 3d (A) and Zr 3d (B) emission regions spectra obtained for the calcined CexZr1-xO2-N samples as well for the Rh/CexZr1-xO2-N samples.
The presence of the Ce3+ could indicate the formation of a significant quantity of oxygen deficiencies. Therefore, an appropriate deconvolution was done following the procedure reported by Damyanova et al. [55]. The quantification results and the BE values for the Ce 3d5/2 and Zr 3d5/2 lines are presented in Table 8. The high-resolution XPS analysis of the Rh 3d emission region was also acquired for the Rh-containing materials (see Fig. 8A). The Rh 3d XPS spectrum of the Rh/ZrO2 (Fig. 8 A-a) Catalysts reveals that the Rh 3d5/2 BE is about 308.42 eV and for the Rh 3d3/2 ca. 312.83 eV. The observed difference (Δ=4.41eV) resulted slightly lower than the characteristic spin-orbit splitting reported to be 4.74 eV in the metallic rhodium [56]. The BE values for Rh 3d5/2 in Rh2O3 are reported as 308.3 eV [57], while 307.4 eV for the Rh0. Thus, the splitting contraction could be related to the spectrum's modification by the presence of those two ions (Rh3+ and Rh0) in the envelope. In general, the other two spectra obtained for the Rh/CeO2-N (Fig. 8 A-b) and the Rh/Ce0.5Zr0.5O2-N (Fig. 8 A-c). Samples were very similar in shape but with a noticeable change to lower BE, especially that one obtained for the Rh/Ce0.5Zr0.5O2-N which displayed a shift for the Rh 3d5/2 emission line of 1.26 eV to reach 307.16 eV. Then, a decomposition process in this region including the photoelectron emission of both ions (Rh3+ and Rh0) was done as reported Singh et al. [58]. As an example, the decomposition of the spectrum obtained for the Rh/CeO2-N is given as Fig. 8B. The quantification results are presented in Table 8.
Table 8 Quantification results and BE values for the Ce 3d5/2, Zr 3d5/2, and Rh 3d5/2 lines.
| % Ce ions | BE, eV | BE, eV | %Rh ions | |||||
|---|---|---|---|---|---|---|---|---|
| Sample | Ce3+ | Ce4+ | Ce 3d5/2 | Zr 3d5/2 | Rh3+ | Rh0 | Rh3+ | Rh0 |
| CeO2-N | 17.1 | 82.9 | 883.2 | - | - | - | - | - |
| Rh/CeO2-N | 17.2 | 82.8 | 883.1 | - | 308.9 | 307.2 | 53.3 | 46.7 |
| Ce0.5Zr0.5O2-N | 15.2 | 84.8 | 882.1 | 180.0 | - | - | - | - |
| Rh/Ce0.5Zr0.5O2-N | 15.1 | 84.9 | 882.0 | 179.8 | 308.6 | 307.1 | 19.4 | 80.6 |
| ZrO2 | - | - | - | 180.5 | - | - | - | - |
| Rh/ZrO2 | - | - | - | 180.3 | 308.5 | 307.3 | 97.7 | 2.3 |
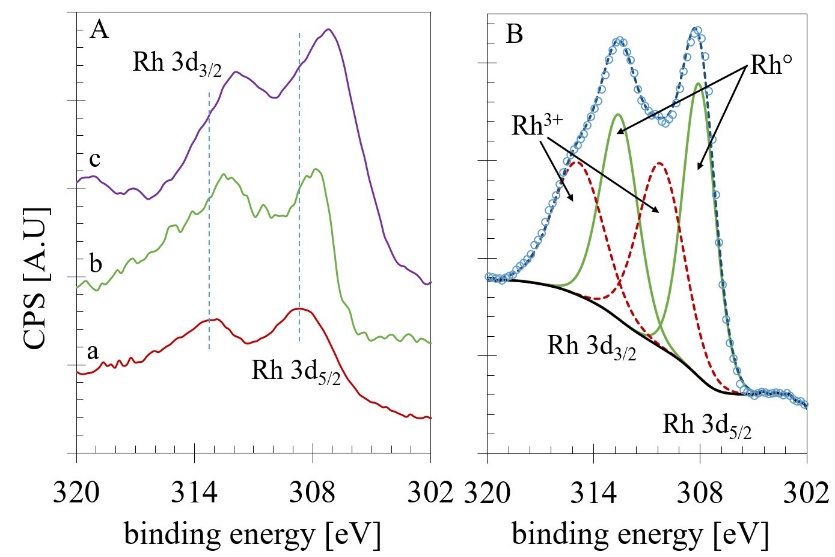
Fig. 8 A) XPS analysis of the Rh 3d emission region B) deconvolution process for the spectrum obtained for the Rh/CeO2-N sample.
The results exhibited that the Ce4+ ion in the Ce-containing supports is predominant with around 83.8%, the binding energies for all core level were in good agreement with the literature. For the decomposition of the Rh emission region, the materials displayed different behavior. The Rh/ZrO presented the highest quantity of Rh3+ (97.7%) among samples, while for the Rh/CeO2-N sample, the amount of this cation decreases until 53.3%. As we mentioned before, the spectrum correspondent to Rh/Ce0.5Zr0.5O2-N resulted shifted to lower BE assigned to the metallic rhodium. Therefore, in the decomposition process, this sample presented the lower quantity of Rh3+ (19.4%). These results support the idea that an increase in the Zr content in Rh/CexZr1-xO2-N catalysts is reflected in a rise of superficial Rh0 particles. Noteworthy was the effect led by the Ce0.5Zr0.5O2-N mixed oxide with more than 80 % of the Rh in the metallic oxidation state.
Discussion
Two different cerium salt precursors were used in the synthesis of the pure and mixed cerium-zirconium oxides. When ammonium cerium(IV) nitrate (-A Series) was employed in the synthesis procedure, solid solutions were obtained, and the specific surface area of mixed oxides presented ca. 2-fold increase in comparison with pure oxides and mixed oxides synthesized using cerium(III) nitrate (-N series). An increase in the Zr content for the -A material series also increased the reduction temperature, thereby suggesting lower reducibility of these materials than -N supports. Besides, it was observed a higher H2 consumption by -A supports, confirming that the inclusion of Zr when ammonium cerium(IV) nitrate was used, improved the reducibility of the supports, thus increasing the availability of O2- anions for oxidation reactions such as the WGSR and the oxidation of CHx adsorbed species. The observed support effect on the H2 reduction capability directly impacts the Rh particle size and reducibility since the main reduction peaks in -N series was shifted to lower temperatures (150⇾120 °C). It showed better symmetry than those supported on CexZr1-xO2-A. Hence, a highly-dispersed and more easily reducible Rh species on the surface was supposed. It was also possible to observe that CexZr1-xO2-N materials presented a lesser conductor character (higher Eg values) than the -A support series regarding the DRS results.
On the other hand, the subtraction of the support spectra(F(%R)sup) from the Rh catalysts spectra (F(%R)cat) reveled a spectral approximation for Rh species (F(%R)sup-(F(%R)cat; Fig. 6) [54]. If the fixed wavelength at 600 nm is assigned to the metallic Rh species, we can observe an increase of Rh0 when the Zr content was increased on Rh/CexZr1-xO2-N catalysts series. The XPS analysis further confirmed this assumption. It also seems that it is possible to suggest a correlation between the rhodium metallic species at the surface with the E g obtained for the supports. Fig. 9 shows the effect of Zr content on both E g on the supports and its impact on relative Rh particles' amount.
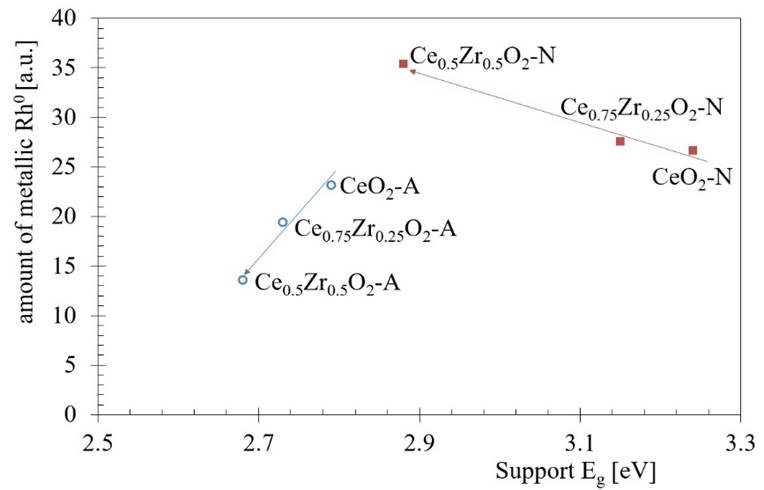
Fig. 9 The relation between the Zr content on both electronic properties (E g ) for the supports and the relative Rh particles amount. The direction of the arrows indicates the increase in the Zr content.
Results presented in Tables 4 to 7 pointed toward a mechanism in which both Rh and support are highly involved. The support exhibited a critical role since CeO2 and CexZr1-xO2 materials can readily provide oxygen species from their surfaces to promote oxidation, therefore avoiding the formation of CH4 that also competes for hydrogen atoms. At high temperatures, it seems that CH4 desorption was kinetically favored over its oxidation, thus preventing the production of CO. This can be further oxidized to produce CO2 and more H2 through the water gas shift reaction (WGSR); the formation of CH4 is an undesired reaction as it decreases the H2 yield. Results also suggested that once CH4 was formed, it does not reform to produce CO and H2 because the reaction is not thermodynamically favored below 450 °C. Therefore, oxidative oxidation properties play a fundamental role in avoiding methane production and improving the ethanol steam reforming reaction's efficiency at low temperatures.
As it is well known, the ideal catalyst must re-oxidize its surfaces, for instance, by taking oxygen from adsorbed water molecules. Besides, it should be able to oxidize methane before methane forms and desorbs from the catalytic surface. According to Raman results (Fig. 2), -A material series had a more disordered structure, which facilitated the diffusion of oxygen atoms from the bulk to the surface. Also, the generation of surface defects adjacent to Rh clusters by strong metal-support interaction effect was evidenced. In this sense, the average crystallite size (Table 2) may be a critical property since it can modulate the specific surface area, increase the Rh dispersion, and generate adjacent oxygen vacancies to Rh clusters. In this sense, the presence of adjacent Rh0 sites and oxygen vacancies favored the ethanol adsorption in oxometallacycles form [59]. This configuration would facilitate the breaking of the C-C bond and subsequent formation of adsorbed CO- and -CHX species; meanwhile, the improved oxygen mobility evidenced for -A material series could also promote the oxidation of these adsorbed species, favoring the formation of CO2 and H2 over CO and CH4 subproducts. Consistent with the above, a significant increase in ethanol conversion accompanied by high H2 and CO2 yields were reached when Rh/CexZr1-xO2-A were used as a catalyst. On the other hand, Rh/CexZr1-xO2-N catalysts series were, in general, slightly less active for the C-C bond rupture, but as it was mentioned before, they improved the H2 production. The differences observed in the redox properties of Rh catalysts suggest that the amount and size of reducible Rh species are related to the activity and percent yield of these materials.
Conclusion
The Ce precursor and Zr composition can substantially influence the structural and electronic properties of CeO2-ZrO2 mixed oxides, influencing the dispersion and reducibility of the supported Rh species, and the catalytic activity in the steam ethanol reforming reactions. The use of ammonium cerium(IV) nitrate as Ce precursor allowed the formation of homogeneous CeXZr1-XO2 solid solution, while segregated CeO2 and ZrO2 were obtained with the use of cerium(III) nitrate. The CeXZr1-XO2 solid solution showed improved oxygen mobility, caused by the distortion of like-fluorite CeO2 lattice due to Ce4+ substitution by Zr4+ and better dispersed Rh particles but more difficult to reduce it to Rh0 due to stronger Rh-support interactions when compared to segregated CeO2-ZrO2 materials. The amount and size of reducible Rh species significantly influenced the steam reforming reaction's activity and product yield. In this sense, the formation of surface defects adjacent to Rh clusters by strong metal-support interaction effect was suggested by Raman analysis. It would be favoring the close contact between Rh0 site and the oxygen vacancy, favoring cyclic-like ethanol adsorption, and facilitate the breaking of C-C bond and further oxidation of adsorbed CO and CHX species. Therefore, the redox properties of the Rh/ CeXZr1-XO2 materials could be controlled by the structure and composition of the support, in this case, the CeXZr1-XO2 solid solution with equimolar Ce:Zr ratio.

