


 nueva página del texto (beta)
 Inglés (pdf)
 Artículo en XML
 Referencias del artículo
 Enviar artículo por email
 Citado por SciELO
  Similares en
SciELO
Similares en
SciELO 
 Permalink
Introduction
Batteries used in large-scale applications should have a low cost, a good safety, a long cycle-life, a high power deliverance, and a good charging rate [1]. Organic type lithium-ion batteries (LIB) may be an excellent candidate for such applications due to their high energy density (> 120 Wh Kg-1), but they suffer from severe safety and economic problems in terms of large scale application [2]. These batteries contain flammable organic electrolytes, which tend to ignite, to cause explosions, and to produce smoke in wrong operating conditions [3]. Furthermore, they are expensive due to their water sensitive assembly environment and the use of costly organic salts and electrolytes [4].
This situation has prompted the developed of less-expensive “green” battery materials and devices using aqueous electrolytes [4-6]. However, there are challenges adopting aqueous electrolytes (e.g., a smaller electroactive zone, material degradation in the presence of oxygen, co-intercalation of the proton, the side reaction of hydrogen-oxygen evolution, and the dissolution of the electrode materials) [7, 8]. Although these challenges are difficult, aqueous electrolyte batteries are promising to use in large-scale applications. Research has been conducted in neutral and alkaline solutions using LiCoO2, LiMn2O4, LiNixCo1-xO2, and LiFePO4 as cathodes [2, 9-11]. Among these materials, olivine-type LiMPO4 cathodes (where M=Co, Fe, Mn, or Ni) have emerged as a promising alternative [12-14]. For example, the LiMnPO4 compound is low cost, non-toxic, and easy to fabricate [15, 16]. However, pure LiMnPO4 has an intrinsic low electronic conductivity [17]. This feature could be increased by adding conductive carbon (15-30%) [18, 19], but carbon has to be limited because it can increase the electrode surface area and enhance the kinetics of water oxidation [20].
The electrochemical response of LIB has to be studied using different electrochemical techniques such as cyclic voltammetry (CV) and electrochemical impedance spectroscopy (EIS) [21-24]. EIS is a powerful tool for distinguishing and evaluating electrochemical mechanisms. However, interpreting the results can be difficult [25]. Hence, different strategies have been implemented such as simple equivalent circuits, transmission line modeling, mechanistic models, reaction mechanisms, and neuronal networks [25-28].
The most common method that is used for describing EIS results is electric analogs. However, this type of analysis is incomplete because it can only reproduce certain electrochemical properties due to the lack of electrical elements associated with the process in electrochemical reactions such as diffusion, adsorption/desorption, and the negative impedance of depassivation processes [29]. Hence, other interpretation methods are required to describe EIS results. The coverage model developed by Epelboin [30] describes the reaction of adsorbed species and their electrochemical behavior on an electrode surface. This model uses a small sine wave perturbation of potential to quantify the electrochemical reaction constants, the coverage factor of one or more intermediates adsorbed at the interface, and the double layer capacitance. The model has been adapted to intercalation cathodes [21] and to growing of lithium dendrites [31].
This work aims to characterize the electrochemical behavior of LiMnPO4 cathodes with the addition of multi-walled carbon nanotubes (MWCNTs) to improve their electronic conductivity. Cyclic voltammetry was used to identify the potential of reactions, the capacitive behavior of the composite, and the faradaic components. In addition, EIS was applied to identify and quantify the mechanism at the interface using an adaptation of the coverage model to analyze the results.
Experimental
LiMnPO4 preparation and characterization
The precursor solution was made up of LiNO3 (reagent grade; Sigma Aldrich, 3.48g), Mn(NO3)2·4H2O (ACROSS; 97.5%, 12.94g), H3PO4 (Sigma Aldrich; 85 wt.%, 12.94g), and citric acid (Sigma Aldrich; 99%, 19.2g). These compounds were dissolved in a mixture of ethanol (20g) and water (40g). The solution was heated to 80°C for 12h on a hot plate and then dried at 120°C in a vacuum oven. Subsequently, the powder was stored at 550°C for 10h, mixed, and ground. Finally, the sample was heated at 700°C in air for 10h. The crystal structure of LiMnPO4 was characterized using a Bruker D8 diffractometer with a Cu target operating at 40kV- 40mA.
Electrode preparation and characterization
LiMnPO4 and MWCNTs (Aldrich 724769 O.D.×L. 6-9nm×5µm, 95% carbon) were mixed in different quantities to achieve 90wt% of the cathode weight, and the other 10wt% was a binder of polyvinylidene fluoride (PVDF, Kynar HSV-900). The solvent was 1-methyl2-pyrrolidine (NMP, ACROSS), and the number of milliliters added to the composite varied for each composition. The mixture was placed on a 316 stainless steel current collector and dried at 120°C for 12h. The slurry thickness was leveled at 30µm using a doctor’s blade. Table 1 lists the LiMnPO4 and MWCNTs ratios existing in 90wt% of the cathodes. A Tescan LYRA-3 GMH, scanning electron microscopy (SEM), was used to obtain high-resolution images of the active material geometry. The porosity was determined using optical microscopy and SEM. The images were processed using Image Processing and Analysis in Java (Image J) to obtain the pore number, diameters, areas, and porosity [32].
Electrochemical characterization
The electrochemical experimentation was carried out in a three-electrode arrangement. The working electrode was the composite mixture placed on a current collector (316 stainless steel), the reference electrode was Ag/AgCl (KCl saturated), and the counter-electrode was a Pt mesh. The area of the working electrode was 11.40 cm2 with loading of approximately 9 mg. The electrolyte was made up of 1M LiNO3/ HNO3 with a pH=2.
Cyclic voltammetry was set at a scan rate of 0.5 mV s-1 toward the positive scan direction with lower and upper boundaries of 0.4 and 1.4V vs. Ag/AgCl, respectively. The positive scan direction is set to promote the delithination reaction at the first battery cycle. The third cycle was reported in Fig. 3 to represent the redox potential in the followed charge-discharge condition. Electrochemical impedance spectroscopy was performed in a frequency range of 0.1-10000 Hz with 5mV of applied amplitude. The experiments were conducted using a Bio-logic SP-200TM. Different bias potentials were applied: 0.8, 1.0, 1.2, and 1.4 V vs. Ag/AgCl.
Coverage factor model adapted to the intercalation of lithium
The intercalation reaction of the LiMnPO4 cathode is shown by the following equation (1):
where, k
1
is the oxidation reaction constant:
The charge balance is given by equation (2):
where,
The faradaic current density (
(3):
Hence, the faradaic admittance due to this perturbation is obtained via the dependence of current on voltage, as shown in equation (4)
The partial derivatives of current with respect to potential and intercalation fraction are shown in equation (5) and (6), respectively.
The relation of intercalation fraction and the potential can be obtained from the equation (2). However, the dependence of the intercalation fraction as a function of time in non-steady conditions has to be used in the mathematical formulation and it is shown in the following expression [21, 26, 30].
Linearizing the expression (7) for a small wave perturbation, the equation (8) is acquired [21, 26, 30].
Here, β is the charge density for a monolayer of adsorbed species and ω is the angular frequency.
This expression can be rearranged to obtain the last term of equation (4), which is shown below as equation (9).
Including equations (5), (6), and (9) in equation (4), the faradaic admittance (
where,
The faradaic admittance (
The impedance of the Li deintercalation process on a porous electrode was
described by Levi et al. [34]. They noted
that the EIS response of the composite by itself has to be evaluated in addition
to the electrochemical effect because the microstructure influence of the porous
film and the electrolyte (
Electric analog for water oxidation reaction at a porous electrode
The equivalent analog that represents electrochemical reactions (e.g., water oxidation) at a porous interface is a parallel combination of the reaction resistance and the capacitance of the double layer [35]. This last element combination is in series with the film resistance, and all of these components are in parallel with the film capacitance [35]. The mathematical expression is shown in equation (13).
where,
Results and discussion
X-ray diffraction results
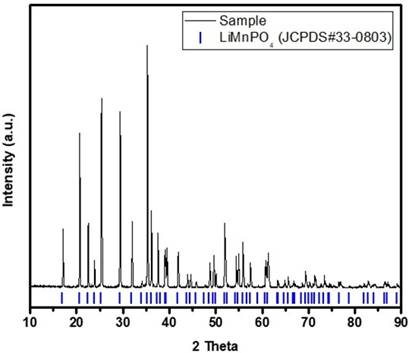
The powder diffraction pattern of the synthesized LiMnPO4 is shown in Fig. 1. The Bragg peaks of the processed compound matched the standard pattern of LiMnPO4 (JCPDS# 33−0803) with a narrow peak width intensity, which can be classified as a highly crystalloid, single-phase, olivine-type LiMnPO4.
Scanning electron microscope results
The scanning electron microscope images are shown in Fig. 2. For cathode 1 (0% LiMnPO4), the MWCNTs were intertwined into a spindle-like microstructure with a hierarchical distribution of pore size. The PVDF dissolved in NMP has been characterized previously [36]; it exhibited a porous morphology as the one acquired in this study. The percentage of porosity is uniform for all the electrodes, as shown in Table 1. This fact ensures that the liquid phase transportation property persists from cathode 1 to 6. For cathode 2 (20wt% LiMnPO4), there were white spots that revealed LiMnPO4 has a low electrical conductivity, and a charging effect is acquired. For electrode 3 (40wt% LiMnPO4), the particles were distributed in the MWCNT networks with increase in surface density. For cathode 4 (60 wt%LiMnPO4), the surface density of LiMnPO4 can be found significantly increased and some aggregates of sizes around 10-15 um can be observed. For cathode 5 (80wt% LiMnPO4), there was a wider distribution of particles. However, the fraction of areas with aggregates increased significantly compared with the other cathodes. Cathode 6 (100wt.% LiMnPO4) was completely occupied by LiMnPO4 based on the white color due to the charging of LiMnPO4.
Voltammetry
The goal of this electrochemical test was to determine the reaction potentials in the system. As a result, the scanning window was established in the range from -500mV to + 500mv in relation to 0.9V vs. Ag/AgCl [37-39]. There are several phenomena that can be obtained in the CVs of LixMnPO4/MWCNTs electrodes such as the capacitance of the composite material, the intercalation-deintercalation of Li+ from the MnPO4 host, and the water oxidation when the potential swift was higher than the operation window offered by the electrolyte.
The CV results for cathode 1 are shown in Fig. 3 (a). A flat response of the current is obtained from 0.5-1.1 V. The current increases its value from 1.1 V to 1.4 V. Any reduction current can be observed in the backward scan from 1.4 to 1.1V until a plateau was obtained again from 1.0-0.4 V. This result is associated with a capacitive behavior and a non-reversible electrochemical reaction. The former is related to the capacitive behavior of the electrode composite by itself, and the latter is related to the oxidation of water.
Fig. 3 (a) Voltammetry results for electrode 1, 2 and 3, and (b) for electrodes 4, 5 and 6, including a zoom for electrode 6.
The results of cathodes 2 and 3 (20 and 40wt% LiMnPO4) are shown in Fig. 1 (a). For both electrodes, the current is constant from 0.5-1.1 V, and then it increases with a maximum around 1.2 V. Subsequently, a peak is obtained at 1.4 V (the vertex potential) where the current is 5.3 and 3.9 mA for electrodes 2 and 3, respectively. In the reverse scan, a cathodic peak was obtained at 1.0 V for electrode 2 and 0.9 V for electrode 3. At potentials lower than 0.8 V but above 0.4 V, the current exhibited a flat behavior. These results can be linked to the capacitive behavior of the composite, one pseudo-reversible electrochemical reaction associated with the intercalation of lithium, and one non-reversible reaction related to the oxidation of water.
The behaviors of cathodes 4 and 5 (60 and 80wt% LiMnPO4) are shown in Fig. 3 (b). There is a capacitive behavior that is not completely square due to a pseudo-reversible electrochemical reaction (deintercalation) and the overlap with the electrochemical irreversible process (water oxidation). The difference between the anodic and cathodic peaks for the pseudo-reversible reaction is higher than the one for electrodes 2 and 3. The increment in the current response is related to the larger quantity of LiMnPO4. The maximum current at 1.4 V was 3.3 mA for electrode 4 and 2.6 mA for electrode 5. These results reveal that the capacitive double layer composite response is less important and that the pseudo-reversible reaction is the primary process for storing energy in this potential region. The oxidation of water was noted as well, but the kinetics of the process decreased based on the current magnitudes in the pure water oxidation behavior. The vertex potential was adopted as an example.
The results of cathode 6 (100 wt% LiMnPO4) are shown in the zoom-in of Fig. 3 (b). The graph has a square behavior between 0.4-1.0 V for currents around 0.05 mA, and then it behaved like electrode 1 at the higher potential region. However, the maximum current was 0.1 mA at 1.4 V. In the reverse scan, the current followed the same line as the oxidation of water until a current plateau was attained from 0.4-1.3 V. This behavior is associated with the capacitance of the LiMnPO4/binder and the water oxidation.
Electrochemical impedance spectroscopy
The lithium intercalation process in organic electrolytes has been studied previously using EIS [34, 40, 41]. These studies have shown that a semicircle obtained at high frequency (HF) should be associated with the formation of a surface electrolyte interface (SEI), which in turn involves the migration effect into this layer. Furthermore, a semicircle at medium frequency (MF) should be related to the intercalation kinetics, a line with a slope around 45° in the Nyquist representation is due the solid diffusion in the composite particles and/or the diffusion in the electrolyte at low frequency (LF) [42], and a pure capacitive result at LF is linked to the charge storage of battery materials [40]. In addition, the semicircle at HF is due to the roughness of current collector and the porosity of a thick composite coating [33].
In the case of an aqueous electrolyte (e.g., LiNO3/HNO3),
SEI formation might be absent or its effect could be negligible due to an
ultra-thin film produced in highly conductive electrolytes [43]. However, other studies have proposed a
SEI formation in an aqueous solution based on the surface layer model [43, 44]. In this work, the response of a semicircle at HF is not
associated with a SEI because its presence has been acquired at a high solute
concentration (e.g., 5 M LiNO3) [43]. The impedance of the current collector in 1M LiNO3
was tested and the EIS magnitudes were on the order of 105 Ω
cm2 and adsorption was acquired at 1.2 and 1.4 V of bias
potential. Those features were not noted when the composite was on the current
collector. Therefore, the current collector response is not linked to the
results at HF. Hence, we included a circuit analog that was made of a parallel
combination of
The results of cathodes 1, 2, and 3 (ranging from 0-40wt% LiMnPO4) are shown in Fig. 4 (a-c). There is a dispersed semicircle at HF-MF and a capacitive line at LF. The dispersed semicircle is slightly dependent on the bias potential, and the capacitive behavior strongly changes with the bias perturbation. The former has a very small increment/decrement in its diameter, and the latter diminishes from a capacitive line at 0.8 V to another semicircle at 1.4 V. The semicircle at HF-MF is the physical response of the composite layer and the charge transfer reaction of LiMnPO4, and its change is due to the applied bias potential on the LiMnPO4 material. On the other hand, the semicircle at LF has a slope over 45º. The high capacitive behavior is resulted from water adsorption on the MWCNTs for electrode 1 and adsorption of water-deintercalation of lithium for electrodes 2 and 3. The semicircle at LF and 1.4 V is completely linked to water oxidation reaction as it was observed in the CV results.
Fig. 4 Nyquist diagrams at different bias potentials (vs. Ag/AgCl) for Cathode 1 (a), Cathode 2 (b), Cathode 3 (c), Cathode 4 (d), and Cathode 5 (e).
The Nyquist diagrams for electrodes 4 and 5 (60 and 80%LiMnPO4) are illustrated in Fig. 4 (d-e). These electrodes show different behavior. A semicircle is recorded at HF and MF, and a line with a slope around 45° is obtained at LF. The semicircle at HM-MF decreased in diameter as the potential increased; the line at LF remained the same magnitude up to 1.4 V, where its shape changed to another semicircle. The semicircle is now attributed to the delithination reaction, and its diameter change is due to the potential modification that results in an increase in the reaction rate. At LF, the line results from the Li+ solid-state diffusion in the LiMnPO4. At 1.4 V, the semicircle at HF is associated with the layer, and the one at LF purely results from the water oxidation process inside the pores.
The impedance behavior of electrode 6 is shown in Fig. 5. It seems that only a partial-semicircle is acquired in the Nyquist diagram (Fig. 5 (a)) at potentials below 1.1V. At 1.4 V, the clear semicircle is completely distinguishable. However, the Bode phase angle diagram that is shown in Fig. 5 (b) clarifies there are two overlapped processes. They decrease their maximum phase angle with the potential increment. This behavior corresponds to an electrochemical reaction at porous surfaces. The first maximum is associated with the composite material, and the second is associated with the oxidation of water. This idea is supported by the CV results for electrode 6. There was not a lithium reaction due to the extremely low conductivity of LiMnPO4.
Quantitative results of EIS
The variables were quantified by fitting the experimental results to the proposed model. The fitting process follows five steps that have been described previously and involve applying genetic algorithms, evolution strategies, and the Levenberg-Marquardt method [45]. The solutions have to be found among meaningful physical ranges of the variables. The results of the fittings are shown in Figures 4-5, where good agreement can be observed.
The experimental results were fitted at 0.8, 1.2, and 1.4 V because they showed three different situations of the system. At 0.8 V, the main effect should be the capacitive behavior of the composite film with little intercalation current. At 1.2 V, the response should be mainly due to the deintercalation reaction of Li, but the water oxidation effect was recorded as well. At 1.4 V, the water oxidation is associated with the results. All the fitted parameters are listed in Tables 2-4.
Table 2 Fitting results of the proposed model at 0.8V of bias potential.
| Electrode /Variable | R film (Ω cm2) | Q film (F cm-2 s1--n) | n film | R ct (Ω cm2) | Q dl (F cm-2 s1--n) | n dl | R e (Ω cm2) | - | - | - | - | - | - | - |
|---|---|---|---|---|---|---|---|---|---|---|---|---|---|---|
| 1 | 66.96 | 1.27×10⁻⁴ | 0.7 | 98972 | 6.85×10⁻³ | 0.91 | 32.92 | - | - | - | - | - | - | - |
| Electrode/Variable | k 1 (mol cm-2 s-1) | k 2 (mol cm-2 s-1) | a(V) | b(V) | θ |
|
β(mol cm -2) | Q dl (F cm-2 s1--n) | n dl | σ(mol cm 2 s-1/2) | R e (Ω cm2) | R film (Ω cm2) | Q film (F cm-2 s1--n) | n film |
| 2 | 9.70×10⁻⁵ | 4.27×10⁻⁶ | 19 | 19 | 0.71 | 0.88 | 1.01×10⁻¹⁰ | 4.59×10⁻³ | 0.86 | 0 | 40 | 28.15 | 9.97×10⁻⁶ | 0.98 |
| 3 | 8.18×10⁻⁵ | 7.59×10⁻⁶ | 19 | 18 | 0.79 | 0.73 | 9.99×10⁻⁷ | 4.14×10⁻³ | 0.85 | 0 | 31 | 146.93 | 1.00×10⁻⁵ | 1 |
| 4 | 9.52×10⁻⁵ | 6.38×10⁻⁶ | 20 | 19 | 0.83 | 1.16 | 9.99×10⁻⁷ | 6.41×10⁻³ | 0.70 | 1279.76 | 40 | 602.47 | 1×10⁻⁵ | 1 |
| 5 | 9.52×10⁻⁵ | 6.46×10⁻⁶ | 19 | 16 | 0.9 | 0.92 | 9.99×10⁻⁷ | 8.48×10⁻³ | 0.70 | 1998.34 | 37 | 216.3 | 1×10⁻⁵ | 1 |
| 6 | 9.23×10⁻⁶ | 4.49×10⁻⁶ | 19 | 18 | 1 | 0.78 | 2.35×10⁻⁹ | 1.60×10⁻⁵ | 0.73 | 0 | 42 | 3030.80 | 9.90×10⁻⁵ | 0.78 |
Table 3 Fitting results of the proposed model at 1.2V of bias potential.
| Electrode /Variable | R film (Ω cm2) | Q film (F cm-2 s1--n) | n film | R ct (Ω cm2) | Q dl (F cm-2 s1--n) | n dl | R e (Ω cm2) | - | - | - | - | - | - | - |
|---|---|---|---|---|---|---|---|---|---|---|---|---|---|---|
| 1 | 71.79 | 1.53×10⁻⁴ | 0.7 | 1424 | 6.70×10⁻³ | 0.89 | 32.94 | - | - | - | - | - | - | - |
| Electrode/Variable | k 1 (mol cm-2 s-1) | k 2 (mol cm-2 s-1) | a(V) | b(V) | θ |
|
β(mol cm -2) | Q dl (F cm-2 s1--n) | n dl | σ(mol cm 2 s-1/2) | R e (Ω cm2) | R film (Ω cm2) | Q film (F cm-2 s1--n) | n film |
| 2 | 8.22×10⁻³ | 5.70×10⁻⁵ | 16 | 17 | 0.49 | 0.87 | 1.01×10⁻⁹ | 4.56×10⁻³ | 0.78 | 0 | 39 | 23.88 | 9.99×10⁻⁶ | 1 |
| 3 | 2.38×10⁻³ | 9.01×10⁻⁴ | 17 | 19 | 0.54 | 0.73 | 9.99×10⁻⁷ | 4.27×10⁻³ | 0.80 | 0 | 20 | 137.14 | 8.52×10⁻⁶ | 1 |
| 4 | 7.70×10⁻² | 3.72×10⁻⁴ | 16 | 19 | 0.52 | 0.87 | 1.89×10⁻¹¹ | 1.77×10⁻³ | 0.70 | 203.39 | 19 | 396.05 | 1×10⁻⁵ | 1 |
| 5 | 1.57×10⁻² | 5.37×10⁻⁴ | 18 | 19 | 0.57 | 0.50 | 4.73×10⁻¹¹ | 3.54×10⁻³ | 0.70 | 312 | 22 | 300.14 | 1×10⁻⁵ | 1 |
| 6 | 2.72×10⁻⁵ | 2.45×10⁻⁵ | 17 | 19 | 0.99 | 0.77 | 1.61×10⁻⁹ | 7.05×10⁻⁵ | 0.70 | 0 | 44 | 3687.88 | 9.69×10⁻⁵ | 0.81 |
Table 4 Fitting results of the proposed model at 1.4V of bias potential.
| Electrode /Variable | R film (Ω cm2) | Q film (F cm-2 s1--n) | n film | R ct (Ω cm2) | Q dl (F cm-2 s1--n) | N dl | R e (Ω cm2) |
|---|---|---|---|---|---|---|---|
| 1 | 96.65 | 1.31×10⁻⁴ | 0.76 | 370 | 5.62×10⁻³ | 0.77 | 33.66 |
| 2 | 39.70 | 7.61×10⁻⁵ | 0.80 | 335 | 5.39×10⁻³ | 0.84 | 41.12 |
| 3 | 112.00 | 6.92×10⁻⁵ | 0.81 | 470 | 3.35×10⁻³ | 0.72 | 30.94 |
| 4 | 356.84 | 1.00×10⁻⁴ | 0.74 | 748 | 3.46×10⁻³ | 0.70 | 30.48 |
| 5 | 690.88 | 8.47×10⁻⁵ | 0.76 | 1129 | 2.78×10⁻³ | 0.74 | 32.18 |
| 6 | 2286.64 | 1.10×10⁻⁴ | 0.70 | 6443 | 9.89×10⁻⁶ | 0.7 | 82.40 |
The values of the reaction constants are related to the charge transfer resistance (
Another important phenomenon is the diffusion of Li, which is linked to The
Warburg coefficient (σ). The presence of σ
indicates that solid state diffusion and the electrochemical reaction are
controlling the system in a so-called “mixed-control mechanism.” The diffusion
process was completely acquired in the electrode with 60 and 80wt%
LiMnPO4. The values reveal the diffusion rate in the sample with
80%LiMnPO4 was higher than in the one with 60%LiMnPO4.
The higher rate of diffusion observed in cathode 5 (80%) compared with cathode 4
(60%) at 0.8 V can be explained by the rate of the electrochemical reaction and
film composition. As the concentration of MWCNTs increases, the solid diffusion
of lithium is facilitated because more current is crossing the
LiMnPO4 particles and the deintercalation reaction is improved.
This means the concentration difference (driving force) between the surface and
center of the particles is higher in electrode 4 than in electrode 5. However,
the semicircle at HF and MF has a diameter of 500-750 Ω cm2 for
electrode 4 and 250-300 Ω cm2 for electrode 5.
The fitting results for 1.4 V are listed in Table
4. At this potential, the oxygen evolution reaction dominates the
process on the electrodes. As the quantity of LiMnPO4 increases in
the electrode,
Intercalation factor (θ)
One of the most important variables is the intercalation factor, θ, listed in Tables 2-3. The intercalation factor changes a little at 0.8 V, a finding that is supported by the CV results. At 0.8, the intercalation factor was 0.71, 0.73, 0.83, 0.90, and 1.00 for electrodes 2, 3, 4, 5, and 6, respectively. Therefore, the addition of MWCNTs increases the conductivity of the particles, which results in faster current exchange for the Li extraction even at this potential. This finding is consistent with the results of previous studies done with the same model. The intercalation factor decreased with the addition of MWCNTs close to open circuit in a LiCoO2 cathode [21], as shown in Fig. 6. The deintercalation factor decreases at 1.2 V as the percentage of MWCNTs increases. It was 0.49, 0.54, 0.52, 0.57, and 0.99 for electrodes 2, 3, 4, 5, and 6, respectively. These findings are in agreement with the oxidation peak acquired in the CV results (i.e., where the maximum current for the lithium deintercalation was approximately 1.2 V). The rate of deintercalation increased by several orders of magnitude, this is from 10-5 to 10-2 mol cm-2 s-1 with the potential increment. Therefore, the intercalation factor went down; the addition of MWCNTs helps to improve the performance of a LiMnPO4 cathode but can also increase the charge transfer resistance due to higher adsorption and oxygen evolution as a side reaction. The effects of all the variables due to the potential modification are illustrated in Fig. 6.
Conclusion
The SEM results revealed a porous surface with nearly the same percentage of porosity yielded a uniform liquid state diffusion rate. Cyclic voltammetry identified the redox potential of LiMnPO4 and the onset of oxygen evolution. A capacitive behavior of the composite, the lithium deintercalation, and the water oxidation were noted between 0.8 and 1.4 V vs. Ag/AgCl. Electrochemical impedance spectroscopy showed the different behaviors of the electrode at 0.8, 1.2, and 1.4 V. At 0.8 V, the capacitive behavior of the porous structured electrode was the primary feature. However, as the fraction of LiMnPO4 increased the intercalation process began to control the system at 60w% LiMnPO4/40%MWCNTs and 80/20 ratios. At 1.2 V, the presence of a semicircle at LF was associated with the deintercalation of lithium and the water oxidation for electrodes 1, 2, and 3. In addition to electrodes 4 and 5, the semicircle at HF and MF was mainly related to the intercalation; the line at LF was related to the diffusion in the solid state in the LiMnPO4. At 1.4 V, all of the behaviors in the EIS results were dominated by oxygen evolution. These dominating processes at each potential were demonstrated to correlate with the results of the coverage factor adapted to the lithium intercalation phenomena, which include the intercalation factor, the reaction kinetic constants, and the double layer capacitance.

