


 nueva página del texto (beta)
 Inglés (pdf)
 Artículo en XML
 Referencias del artículo
 Enviar artículo por email
 Citado por SciELO
  Similares en
SciELO
Similares en
SciELO 
 Permalink
Introduction
Commonly, plastics are widely used in many applications such as packaging, building materials and commodities, and also as hygiene products. Despite their numerous advantages, the problem of environmental pollution caused by the indiscriminate dumping of plastic waste has assumed a global proportion, exceeding 200 million tons per year [1-2]. The amount of plastics discarded in the marine environment annually is up to several hundred thousand tons due to their poor biodegradability [2]. As an example, polyethylene and polypropylene are the most widely used synthetic polymers, and 65% of polymer residues in Europe are composed of these polymers [3].
One of the most important applications of polyolefins that cause this amount of contaminants is the packaging of food. Foods are packaged primarily to protect them from the environment and to provide information on ingredients and nutrition to consumers. Traceability, convenience and the identification of sabotage are secondary functions of increasing importance. The materials that have been commonly used in food packaging are glass, metal, paper and paperboard, and plastic.
However, food packaging has become a central focus of waste reduction efforts, since proper waste management is important to protect human health and the environment as discussed above. As an example, previous research [4] showed that there has been a 37% increase in municipal solid waste, from 179.6 million tons in 1988 to 245.7 million tons in 2005, being the packaging the use with the maximum contribution of total solid waste, with 31.2%. Only food packaging represents almost two-thirds of total packaging waste by volume.
The use of plastics over glass and metals has continued to increase due to their good material properties and low cost [4]. With the growing demand for high quality foods by consumers, and from the concerns about limited natural resources and the environment, the use of renewable resources to produce edible or biodegradable packaging materials that allow to maintain the quality of the product, but also reduce the problem of waste disposal is being explored. Accordingly, a variety of renewable biopolymers such as polysaccharides, proteins, lipids, and their composites, derived from plant and animal resources, have been investigated for the development of edible/biodegradable packaging materials in order to replace their non-biodegradable petrochemical-based counterparts [2]. Therefore, an alternative to this problem of non-biodegradability is the use of biopolymers, which have received increased attention due to the demand to replace petroleum-based polymers with safety, environmentally-friendly and renewable materials [5]. Most of the investigated biopolymers for food packaging are polysaccharides (e.g. starch and chitosan), polylactic acid (PLA), polyvinyl alcohol (PVA), and polycaprolactone (PCL) [5].
Chitosan is a biopolymer derived from the deacetylation of chitin, the main structural component of crustacean exoskeletons. It is a pH-dependent cationic copolymer composed of glucosamine and acetylglucosamine [6-15]. Chitin occurs in nature as ordered crystalline microfibrils forming structural components in the exoskeleton of arthropods or in the cell walls of fungi and yeasts. Chitosan-based materials have played a significant role in biomedical applications due to their nontoxicity, biocompatibility and biodegradability [6]. When the degree of deacetylation of chitin is more than 50%, it becomes soluble in aqueous acid media and is called chitosan. Solubilization occurs by protonation of the -NH2 function at the C-2 position of the D-glucosamine repeat unit, whereby the polysaccharide is converted to a polyelectrolyte in acidic media. Chitosan is the only natural cationic polymer and, therefore, finds many applications that derive from its unique character. Being soluble in aqueous solutions, chitosan finds a vast number of applications such as solutions, gels, films and fibers. Chitosan films are widely used to prolong the shelf-life of fruits and vegetables and have a great potential for use in coatings, and encapsulation [11]. According to the reasons cited above, chitosan is one of the most widely used active packaging materials due to its biocompatibility, biodegradability, excellent film-forming ability, and inherent antibacterial and antifungal properties [8-10, 13-15].
On the other hand, titanium dioxide (TiO2) is the most studied crystalline system in the area of metal oxide surfaces, being rutile and anatase the most important forms. This material is very important in society due to its multiple applications. As a given example, it is used in heterogeneous catalysis, photocatalysis, solar cells for hydrogen and electrical energy, for gas sensors, white pigments, anticorrosive coatings, optical coatings, ceramics and electronic devices such as varistors. -In addition, it plays an important role in the biocompatibility of osseous implants and is studied for the isolation of doors in the new generation of Metal Oxide Semiconductor Field Effect Transistors (MOSFET) and spacer materials in magnetic spin valve systems [16]. It is also used in a nanostructured form for lithium batteries and electronic devices [16,17].
Also, TiO2 is the most widely used white pigment, due to its high refractive index (2.5-2.7 at 599 nm) and low absorption; these properties produce a high scattering of light that opaque materials, exhibiting excellent brightness and opacity, and good thermal stability [18]. It has been successfully used in nanometric form with thermostability and insipidity and can modify the properties of biodegradable film in spite of TiO2 particles are prone to aggregation, which may affect their effectiveness when used to improve the properties of the film [8]. The nature of the solvent actually influences the level of the observed pigment aggregation, which tends to be higher in water-based systems [19].
To solve this situation, ionic dispersants are normally used to disperse the TiO2 pigment in water-based systems, which provides electrosteric stabilization. During the drying stage of the film, evaporation of water causes the polarity of the system to decrease, and consequently, the ionized state of the ionic dispersant can not be maintained. Therefore, this process may lead to a loss of stability resulting in the aggregation of pigment particles during drying, which will affect the optical properties of the paint, such as brightness and opacity. Steric stabilization, via nonionic dispersants, is not sensitive to pH or changes in ionic strength [18]. Since the TiO2 particles tend to agglomerate and precipitate, their high density limits their suspension stability. Despite the unstable behavior of TiO2 particles in the aqueous suspension, this is very important in many applications, but its study has been limited in comparison with the extensive knowledge of polymers composites. In order to avoid the problem of particle agglomeration inside polymers, the particles are modified on their surface with the aim of making them suitable for polymers; these modifications improve the interactions between both materials.
Within metallic oxides, silanization has been used to modify their character: either hydrophilic or hydrophobic [20]. Silanization is a synthetic route that drastically changes the surface of metal oxides; this chemical reaction has been used successfully in several systems [20,21].
In this work, the formation of Chitosan-Methyl cellulose films is presented using TiO2 particles, which were chemically modified by silanization; this modification improves the dispersion of the particles in the polymeric matrix and also the mechanical properties, such as resistance to breakage.
Experimental
Materials
Titanium dioxide (TiO2) particles with an average diameter of 350 nm and a crystalline structure of rutile was obtained from DuPont (R-104 Dupont, Mexico). 3-aminopropyl-trimethoxysilane (APTMS) from Sigma-Aldrich, 97%, Mexico. Lactic acid from Karal, 85%, Mexico. Chitosan from Sigma-Aldrich, medium molecular weight, 95-97% deacetylation, Mexico. Methylcellulose from Sigma, viscosity 4,000 cP, Mexico. Distilled water pH 6.5-7.5 from Equiba, Mexico. Industrial ethyl alcohol 96 ° GL from Equiba, Mexico.
Silanization Process
To carry out the silanization process on the surface of titanium dioxide particles, a modification was made to the procedure established by previous investigators [22]. The particles were dried under vacuum for 10 h at 50 °C, dispersed in dry toluene and stirred for 30 min. A mixture of 100 mL of toluene, 5 g of TiO2 and 1mL of 3-aminopropyl-trimethoxysilane (APTMS) was added dropwise for the formation of an APTMS layer on the titanium; this mixture was heated by a reflux system for 12 h and let settle for 4 h. Then, this was filtered and washed 3 times with toluene and ethanol to remove unreacted APTMS. Finally, the particles of silanized titanium dioxide (S-TiO2) were put to dry in a vacuum oven for 4 h at 65°C.
Films manufacturing process
A first solution with lactic acid in deionized water was prepared in a proportion of 2% v / v, in this solution 4 g of chitosan were added and then it was stirred for 20 h. A second solution was prepared in a ratio of 1: 1 v / v ethanol and 0.5 g of methylcellulose was added; and then stirred for 3 h. When finished, the two solutions prepared were mixed and stirred for 24 h for homogenization purposes. In addition, a 2% v/v solution of lactic acid in deionized water was prepared, where 0.05 g/0.1 g of modified and unmodified TiO2 were added and stirred for 1 h; after that time, 4 g of chitosan were added and stirred for 20 h. Finally, the methylcellulose was added and the mixture was stirred for 4 h. Finally, for each film, 100 mL of the film-forming solution was poured onto 36 cm by 25 cm acrylic plates. The films were dried at a temperature of 40 for 12 h.
Characterization of Silanized Particles
The Fourier Transform Infrared (FTIR) spectra were measured using a FTIR-ATR Spectrum equipment 100 model, in order to confirm the silanization process. The spectra were analyzed in a range of 4000 to 800 cm-1, with a resolution of 4 cm-1.
29Si and 13C, NMR spectra of the particles were obtained in a Bruker Ascend (400 MHz) instrument operating at 400 MHz (29Si) and at 100 (13C) MHz. The parameters for 13C were a scan number (NS) of 16 and a pulse length (P1) of 8.5 microseconds.
The Thermogravimetric Analysis (TGA) tests were performed using a TA Instruments model Q500 equipment in a range of 25 to 600 °C and a temperature ramp of 10 °C/min under nitrogen atmosphere. The 5 mg samples were placed in platinum crucibles.
The Zeta potential tests were carried out with the help of the Delsa Nano C particle analyzer A53878 equipment, preparing solutions of NaOH and HCl at a concentration of 0.001% w/v and occupying disposable cells with two electrodes placed in the solution inside the cell, for measurement. The stability of the TiO2 particles, as well as the silanized particles (S-TiO2) were evaluated in water through their precipitation time, given by the force of gravity at a different pH, which ranged between 2 and 12, and occupying a dual light source of 30 mV and a 658 nm laser diode.
Characterization of Films
The color values of the films were determined using a colorimeter (CR-400, Minolta, Konica Ramsey, NJ, USA). The color scale used to measure color values was: L*, the luminosity variable; a*, from red to green; and b*, from yellow to blue. This scale is proposed by CIE: L, a*, b*, also known as CIELAB [23]. Another useful color parameter, is chroma “c*”, this quality describes the extent a color differs from a gray of the same value and is calculated as the hypotenuse of the right triangle formed by the origin and the values of coordinates a* and b*, therefore chroma is calculated as c*=(a∗2 + b∗2)1/2 [24]. Five points were measured in each film, one in the center and four around the perimeter.
Water vapor permeability (WVP) provides a relative indication of the barrier efficacy. This test was determined gravimetrically according to the procedure of the ASTM-E00996-00 standard and using the same permeability cells that consist of a glass container with a 3.5 cm i.d., 4 cm e.d. and a depth of 5 cm. The cell was filled with 30 mL of distilled water to generate a relative humidity of 100% and covered with the film.
The cell was placed into a desiccator containing silica gel to provide a relative humidity of 11-13%. The weight variation of the permeability cells was determined by recording the weight of the cell with the film, assuming that the weight variation in occurred only by the passage of water vapor through the film. The tests were performed in triplicate and the water vapor permeability was calculated using equation (1) [25].
where, Q = mass change in time (g); X = thickness (mm); t = time (s); A = area of the film (m2) and ΔP = difference of the partial vapor pressure of the atmosphere with silica gel and pure water (Pa).
Differential scanning calorimetry (DSC) tests were carried out using a TA-instruments equipment, model Q-2000. Each of the 5 samples was analyzed, with a sample size of 5 mg, temperature of 20 °C to 300 °C and a ramp of 10 °C/min.
The Scanning Electron Microscopy (SEM) test was carried out with the help of a JEM-6610LV JEU model. The morphology of the films was captured with a 50x grayscale magnification using a voltage of 20 kV and stored in JPG format.
All the mechanical properties of the films were determined with the help of a universal machine that allows to know the capacity with which materials will maintain the integrity and resistance during the handling and transport of food, as well as their flexibility [26]. These tests were performed with a load cell of 5 kg and a speed of 2 mm/s. In advance, 5 samples were cut for each film to perform the test; each film had a width of 1 cm and a length of 10 cm per sample. Tensile stress was presented in the elongation to obtain tension-strain curves and Young's modulus, the latter being the relationship between the strength of a film and its deformation before it breaks. According to [27], at high values of Young’s Modulus, the films will be harder and more fragile.
Results and Discussion
Physicochemical characterization of the particles
Fourier transformed infrared Spectroscopy (FTIR) reveals information about the molecular structure of chemical compounds and is useful for the characterization of a biopolymer. The specific vibrations of the samples can be seen in Fig. 1; in this, the evolution of the FTIR spectra as function of temperature is presented. Si-O bands are observed in regions between 1400 and 700 cm-1 and bending vibrations at 900 cm-1, which remain stable after the heating treatment, indicating that Si-O is thermally stable in the analyzed range [28]. Similarly, the vibrations attributed to the NH2 groups at 2921 and 1600 cm-1 were stable up to 400 °C [29].
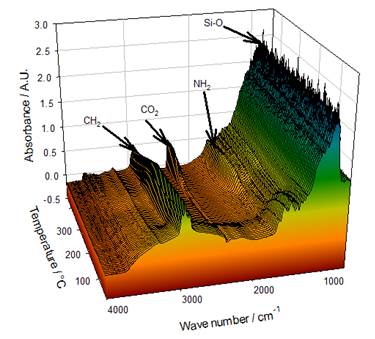
On the other hand, some changes occur in the high frequency region where the appearance of CO2 in regions between 2600 cm-1 and 2400 cm-1 could be seen after 300 °C. These bands begin to appear when the intensity of the -CH2-CH3 vibrations starts to decrease; since the vibrations attributed to the amino groups remain unchanged. This formation of CO2 could be related to the decomposition of some groups in the APTMS, which did not react in the silanization process. The previous analysis is related to what was observed in the thermogravimetric curves (See Fig. 4), when the loss of weight occurred as a function of temperature.
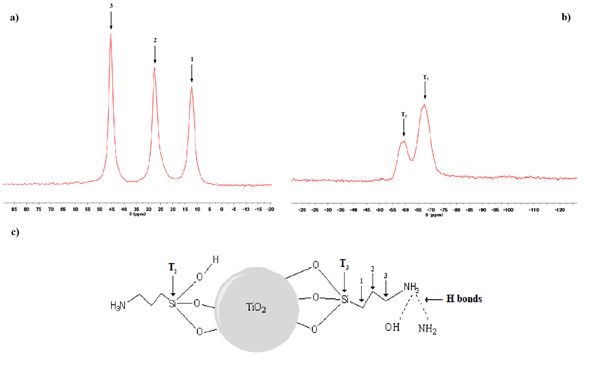
Fig. 2 RMN spectra of silanized titanium dioxide particles. a) 13C and b) 29. C) Proposed scheme for of silanized titanium dioxide particles.
In Fig. 2, the characterization by NMR spectrum for a) 13C and b) 29Si is shown. As can be seen in Fig. 2 a) NMR spectrum for 13C shows the signal at 47, 28 and 14 ppm attributed to the 3 carbons of the propyl group identified as 1, 2 and 3, correspondingly in the Fig. 2c) While Fig. 2b) NMR spectrum for 29Si shows two different signals, the first one at around -57 ppm corresponding to T2 and the second one at -67 corresponding to T3, which are bonded to the TiO2 surface as schematized also in Fig. 2c).
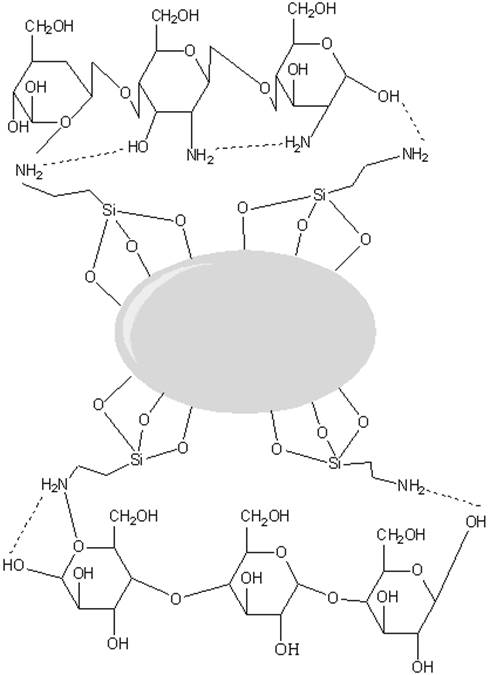
Also, Fig. 3 shows a schematic of interaction among the bonded particles, in which the silane molecules are linked to the TiO2 surface through Si-O- bonded to chitosan and to the polymer. This interaction provides better mechanical and WVP properties, as demonstrated by the corresponding tests.
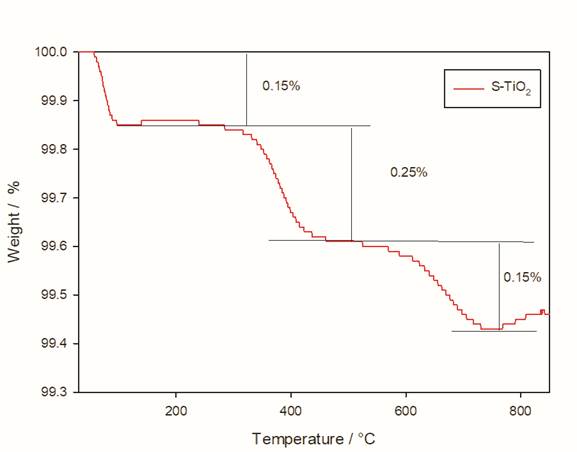
In Fig. 4, there are three weight losses for the silanized particles, the first in the range of 120 to 150 °C, with a weight loss of 0.15% that corresponds to the evaporation of the remaining toluene; there is a second drop of 0.25% in a temperature range of 300 to 350 °C related to the amount of unreacted methyl groups from APTMS that allow the formation of CO2; this observation is in accordance with the FTIR analysis. Finally, a third drop is observed with a loss of 0.15% at a temperature of 600 °C, corresponding to the loss of silane layers, as can be seen there is a wide temperature range for this decomposition since the organic layer decomposes slowly from the silica surface [28].
Based on the observation of the FTIR analysis and the results from TGA, it is proposed that the silanization process induce the formation of a Si-O network around the surface of titanium dioxide as reported in previous investigations that using this silanization method [22], while some of the APTMS groups remain unreacted as free pendant methyl groups, since it is assumed that the reaction is not carried out at 100%; while the amino groups are on the outer layer between the surface of the titanium dioxide and the external media.
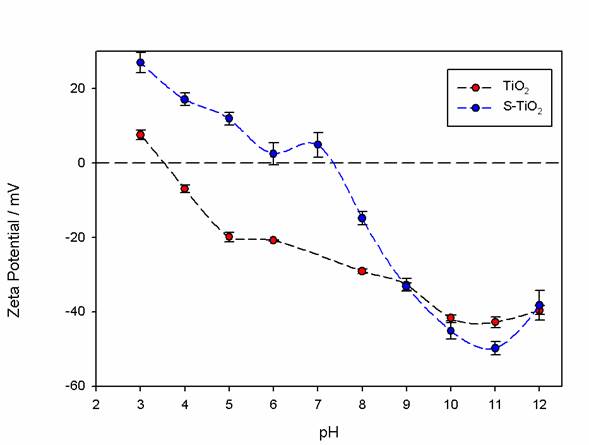
To evaluate the changes promoted by the silanization process and the colloidal stability of TiO2 and S-TiO2, the Zeta potential was studied as a function of pH. The highest absolute values of the Zeta potential imply a greater electrostatic repulsion between particles and, therefore, better stability [29,30]. As observed in Fig. 5, the Zeta potential of the TiO2 particles (red color) varied relative to the S-TiO2 (blue color) from 10 mV to 27 mV at pH=3. This may be due to the addition of new surface charge generators, such as the amino-terminal groups of the silanization process; also, a shift of the isoelectric point in the particles with pH values of 3.5 to 7.3 is observed. The value of the Zeta potential at pH=3 is emphasized because this is the value at which the chitosan will dissolve in the polylactic acid solution and the particles will be added to this solution in order to prepare the films. For this, it is necessary to promote the dispersion of titanium dioxide particles in this stage.
Physicochemical characterization of the films
In Table 1, the color parameters L*, a*, b* and c* of the studied films are presented; these parameters are those established by CIELAB for the color scale [31]. The value of the brightness parameter (L*) in all the studied samples indicates that all the films are bright, while the increase in the percentage of particles improves this property thanks to the presence of titanium dioxide particles. However, it can be see that the greatest value in this property is due to the use of S-TiO2 particles (L*=54), this is attributed to the improved dispersion of the particles inside the film; this value is up to 20% higher compared to the sample with unmodified particles. According to the values in color space (a and b), it is observed that the films have a slight yellow-greenish tint, which is attributed to the property characteristic of chitosan.
Table 1 Colorimetric parameters of the studied films.
| Samples | L* | a* | b* | c* |
|---|---|---|---|---|
| CMC | 40.7 | -0.1 | 0.1 | 0.3 |
| 0.05 CMC/TiO2 | 42.5 | -0.7 | 0.5 | 0.8 |
| 0.1 CMC/TiO2 | 48.2 | -1 | 0.3 | 1.1 |
| 0.05 CMC/S-TiO2 | 44.6 | -0.6 | 0.2 | 0.6 |
| 0.1 CMC/S-TiO2 | 54 | -1.4 | 0.1 | 1.4 |
The values of the water vapor permeability tests carried out on the films are
summarized in Table 2, where the
solubility coefficient is defined as the maximum mass of the migrating molecule
that dissolves in a unit volume of the material at equilibrium [
Table 2 Water vapor permeability values of the films.
| Samples | x10 7 (g*m/h*m 2 *Pa) |
|---|---|
| CMC | 7.84 |
| 0.05 CMC/TiO2 | 6.68 |
| 0.1 CMC/TiO2 | 7.13 |
| 0.05 CMC/S-TiO2 | 6.64 |
| 0.1 CMC/S-TiO2 | 7.32 |
In Fig. 6, three weight losses of the films can be seen by the TGA analysis, observing an initial loss at a temperature between 85 and 120 °C, which is attributed to the evaporation of water and ethanol in the samples [37]. After the loss of volatile matter, the other components begin to decompose thermally; in this way, a second weight loss is appreciated in a temperature range of 140 to 210 °C, this loss corresponds to the decomposition of chitosan [38]. A final drop is observed in a temperature range of 300 to 320 °C corresponding to the degradation of chitosan [39].
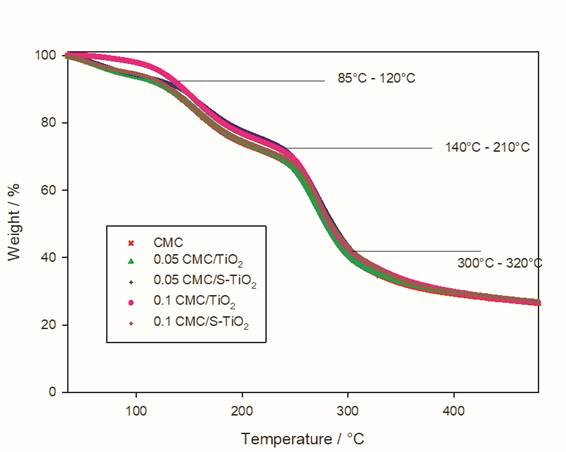
Fig. 7 corresponds to differential calorimetry tests. In this, an endothermic peak can be seen in a temperature range of 89 to 144 °C, corresponding to the evaporation of water. In the same way, a second peak can be observed in a region of temperature of 170 to 195 °C, this peak is attributed to the partial decomposition of the chitosan, since water acts as a plasticizer with the chains of chitosan and therefore, an intermolecular hydrogen bond is formed with chitosan through the amino and -OH groups, which favors a molecular change that facilitates the mobility of chitosan [37,39,40]. As can be seen in Fig. 7, the addition of particles has an effect that defines better the transition of the endothermic peak since the red line corresponding to CMC without particles shows spliced peaks. Therefore, it is possible to conclude that for non-silanized particles, in a smaller amount, the endothermic transitions become narrower. This same behavior is observed with the silanized particles, which is due to the fact that the structures of the material have a higher order. However, there is no effect of the load on the thermal behavior of the compound, as shown in Fig. 7, where no changes are observed due to the effect of the load for the thermal analysis, contrary to the effect observed in the mechanical and WVP tests.
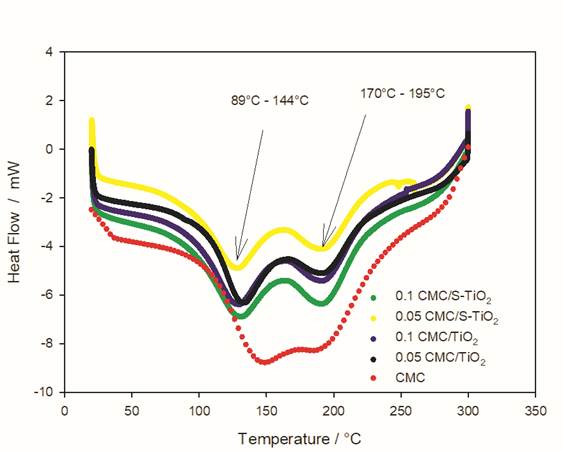
Fig. 7 Differential scanning calorimetry results of the studied composites and the unfilled CMC film.
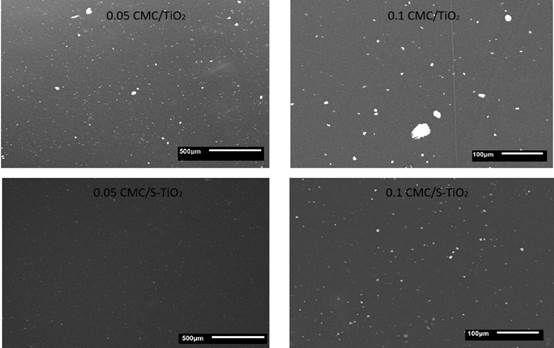
To evaluate the dispersion of the TiO2 and S-TiO2 particles inside the biopolymer films, the surface of the material was scanned by Scanning Electron Micrography (SEM). The SEM images are presented in Fig. 8. The micrographs (A) and (B) are those with unmodified TiO2; in this composites, the particles exhibit poor dispersion and formation of agglomerates, a characteristic problem of TiO2. Otherwise, it can be seen in the micrographs (C) and (D) corresponding to S-TiO2, a better dispersion of the particlesthat is attributed to the coupling of the silanized particles in the polymer matrix. With this, it is concluded that the coupling achieves a good dispersion in the films with S-TiO2 avoiding the formation of agglomerates, which results in a better intermolecular interaction in the matrix.
The effect of the inclusion of S-TiO2 particles on the mechanical properties in the chitosan films is summarized in Table 3. An increase in the strength of the films with S-TiO2 can be observed, about 20 MPa compared to the films without filling (CMC), whose resistance is 15 MPa. The enhancement due to the effect of the silanized particles is about ≈28% at low percentages and rises even more when increasing the percentage of S-TiO2, whose resistance is 23 MPa, showing an improvement of 53% with respect to the films of CMC. According to the degree of deacetylation in the material (95-97%), hydrated polymorphic species of the polymer can be obtained, which may be interacting with the particles modified with the silane through hydrogen bounds, which helps to improve the mechanical properties. As observed in the results shown in Table 3 at higher load, the resistance to the breakage of films increases, this due to addition of the particles, observing higher values when the films were made with silanized particles because the interaction between the polymeric chains and the silanes; this interactions generate strong forces that causes greater resistance to breakage due to the attraction that the layers exert.
Table 3 Mechanical resistance to the breakage of films.
| Samples | MPa |
|---|---|
| CMC | 15 ± 1.22 |
| 0.05 CMC/TiO2 | 16 ± 1.17 |
| 0.1 CMC/TiO2 | 18 ± 0.49 |
| 0.05 CMC/S-TiO2 | 20 ± 1.30 |
| 0.1 CMC/S-TiO2 | 23 ± 0.89 |
These reported values agree with previous data reported by other authors, and it is evident that the addition of unmodified particles has less effect on increasing the resistance to breakage due to agglomeration of the particles inside the films; as seen in the SEM analysis. This lack of dispersion is attributed to the greater interaction among unmodified particles that allows them to promote formation of clusters [41-42].
Conclusions
It was possible to successfully produce composite films based on a biopolymer, such as chitosan and TiO2 superficially modified with aminopropylsilane. Modification of the surface allowed easy integration and excellent dispersion in the chitosan biopolymer matrix, which resulted in an improvement of 53% in the mechanical properties of S-TiO2, compared to the unfilled biopolymer. Another property that was improved by integrating the S-TiO2 into the biopolymer was color, which gave a value of L*=54 swhile the biopolymer without additive had value of L*= 40.7. All of the above indicates that these Chitosan/S-TiO2 composites are could potentially mitigate environmental problems, since they are materials that can compete with commercial polymers.
The obtained films can be a viable alternative to the common problems that appear in chitosan films, such as color, resistance to breakage, etc. In addition, this is an alternative to avoid formation of agglomerates and the reduction of the particle size; thanks to the inclusion of silanized particles of titanium dioxide.

