


 nueva página del texto (beta)
 Inglés (pdf)
 Artículo en XML
 Referencias del artículo
 Enviar artículo por email
 Citado por SciELO
  Similares en
SciELO
Similares en
SciELO 
 Permalink
Introduction
Chemisorption and physisorption are two different mechanisms that are used for storing various gases in porous materials [1]. Porous materials, particularly carbons, are of intense scientific interest in the context of physisorption [2]. Carbon porous materials with high specific surface area or with a large number of sorption sites available to the physisorption of different gases [3]. Activated carbons are porous substances with large internal holes consisting of micro, meso and macro pores. These carbonaceous materials offer highly developed pore structures and very large surface areas [4]. They are currently available in forms of granular or powder, acid and water washed, impregnated, wood or coal based. The carbons are activated by pyrolytic decomposition leading to the formation of graphite lamellae giving rise to free space [5]. Preparation of activated carbons with different pore sizes are achieved by using physical or chemical activation processes. In the physical activation steam is used as the main activation agent, whereas in the chemical activation process often ZnCl2 or phosphoric acid is employed. In each method, the development of porosity will mainly be dictated by the primary structure of the source of carbon containing material used. With the chemical activation process a large amount of porosity, predominantly meso pores is formed [6]. Physically activated carbons have a high pore surface area, are amenable to modification and, unlike several other adsorbents, are easily regenerated [7].
The analysis of adsorbent materials is based on adsorption capacity, selectivity for carbon dioxide over other gases in the gas stream, adsorption/desorption kinetics, mechanical strength, tolerance to impurities, regeneration of sorbents and sorbent costs [8]. Today, there are more than 150 types of activated carbons in the market which are used in numerous industrial applications [9]. Separation of CO2/CH4 mixtures from biogas, removal of carbon dioxide from flue gas and H2/CO2 separation from steam-ethane reformers are some of the possible applications of activated carbon adsorbents [10]. Application of activated carbons has been compared to other possible adsorbents such as zeolites, MOFs and amine modified materials [11, 12].
One of the most important applications of activated carbon is in separation of toxic and hazardous substances from contaminated water [13]. Siriwardane et al. investigated activated carbon and zeolite capacities for carbon dioxide, nitrogen and hydrogen up to 20 bar. They found that above about 2 bar the activated carbon capacity for carbon dioxide continued to rise considerably up to 20 bar whereas, the zeolites, which had higher capacities at low pressure, did not increase significantly at elevated pressures. They suggested that activated carbon is more suited for separations at high pressures, such as those used in pre-combustion captures [14]. Also, Drage et al. evaluated several types of activated carbons derived from phenolic resins, polyacrylnitrole (PAN) derived resin and commercially developed activated carbons. They showed that an activated PAN derived material had significantly improved adsorption capacity due to an increased pore surface area [15]. Also, Panella et al. showed that amorphous carbon nanotubes, activated carbon and porous carbon samples all show the same adsorption properties. The complete reversibility and fast kinetics of the process indicate that the interaction between different sorbate-sorbent molecules is due to physisorption [16]. On this premise, by controlling size and pore area, Zaworotko et al. succeeded to separate and capture CO2 in a series of metal-organic materials [17]. Also, Kim showed that the organic molecular porous are able to separate CO2 and have the highest selectivity of CO2 over CO [18]. In another related close study, Steel and Koros investigated the carbon porous materials and related effects on gas separation properties by applying pyrolysis temperature to alter the carbon structure and succeeded to change the average pore size [19].
The percentages of micro and meso pores are also key determinant factors in selecting an activated carbon for a specific application. This study was therefore set-up to establish the effect of particle size and carbon type on the surface area and porosity of the activated carbons that are produced. N2 gas at -196 °C was used to measure adsorption equilibrium isotherms. The isotherms obtained were analyzed by either Langmuir, BET or BJH procedures [20] to determine the surface area and micro pore volume of the samples. Moreover, we used methods such as adsorption of methylene blue [21] and Iodine [22] to characterize these products.
Materials and Methods
The materials and analytical procedures used in this study are described below.
Reagents and chemicals
The instrument used for determination of surface area (BET) is made by Micromeritics Instrument Corporation. The elementary iodine received from Kansar Khazar (Iran). It is of laboratory quality grade, with more than 99.9% purity and particle size ranging between 0.5-2 mm corresponding to mesh of 35 to 10. Sodium thiosulfate and potassium iodate were sourced from Merck chemicals. Other laboratory chemicals used were of analytical grades. All solutions were prepared in distilled water. Solutions of 0.1 N Iodine, 0.1 N Sodium Thiosulfate and 0.1 N Potassium Iodate were prepared according to ASTM-4607 procedures. The four types of activated carbons were produced according to an industrial process employed at Beshel Activated Carbon. The process used is briefly described below.
Active carbon preparation
It has been shown that cellulose materials have different structures and densities, and when these materials convert to activated carbon, different nano cavities would be appeared, so they have great potential in absorbing different gases with different molecular radii [23]. In this regard, four different cellulose materials including; Pistachio wood (PE-BAKI), Walnut wood (WN-BAKI), Forest Wood (FW-BAKI) and Coal (CO-BAKI) with 4x8 mesh (on a U.S. Standard Mesh Size) were selected for the production of activated carbon. These materials, 100 kg each, were individually pyrolysed in industrial rotary furnace operating at 400-550 °C for 3-4 hours. The pyrolysed materials were activated in an industrial rotary furnace running at 800-920 °C with a residence time of 45-60 minutes using steam as the activator. All samples produced were left to cool down to ambient temperature. They were then crushed and the particles produced were divided in three separate groups using sieve with mesh sizes of 8x30, 30x50 and 60x80.
Results and discussion
In this section, adsorption experiment, including iodine and methylene blue numbers, surface area, pore volume and comparison of surface area and pore volume are measured. To obtain iodine and methylene blue numbers for each particle, their iodine and methylene blue adsorptions were measured as followings:
Measurement of Iodine Number
Iodine number is a widely used parameter for activated carbon testing for its simplicity and a rapid assessment of adsorbent quality. It gives an estimate of its surface area and porosity. The iodine number is defined as the milligrams of iodine adsorbed by one gram of material when the iodine residual concentration of the filtrate is 0.02N (0.01 mol L-1), which is based on a three-point isotherm [24]. Iodine number was determinate according to ASTM: D 4607-94 (2006) by adding of 0.3-0.8 g of activated carbon with particle size 100 mesh in 100 ml of 0.1 N iodine. After 30±1s of vigorously shaking the mixture was filtrated through a paper filter with porosity of less than 2 microns. 50 ml of the filtrate was subsequently titrated with 0.1 N solution of thiosulfate. The iodine number was then calculated according to the following equation:
Where, X/M = iodine absorbed per gram of carbon (mg/g), DF= dilution factor, S = sodium thiosulfate (mL) and M = mass of carbon used (g). A = Iodine normality (N2)(12693.0) and B= Sodium thiosulfate normality(N1) (126.93). Determinations of N1 and N2 values are described in the ASTM: D 4607-94(2006).
The results of the iodine number measured for a batch with 100 mesh of activated carbon produced from each material are listed in Table 1.
Table 1 Iodine number for samples of activated carbons produced from Pistachio, Walnut, Forest Wood and Coal.
| Sample | PE-BAKI | WN-BAKI | FW-BAKI | CO-BAKI |
|---|---|---|---|---|
| Iodine Number (mg/g) | 780 | 900 | 1000 | 197 |
These numbers suggest higher porosity for activated carbons produced from forest and walnut woods and lower porosity for that of Coal. Note the measurements indicate that the level of porosity for activated carbon produced from coal with high content of carbon to be an order of magnitude lower than the others. The data of Table 1 show that all used materials could be converted to activated carbon of good quality and the activated carbon produced from coal has a satisfactory structural strength and are more compact and has the worst activity amount used carbon active. The higher Iodine number for FW-BAKI suggests the higher activity of activated carbon, especially in the absorption of materials with a molecular weight less and with a diameter less than 20 angstroms [25].
Measurement of Methylene Blue
The Methylene blue number is defined as the maximum amount of dye adsorbed by 1 g of adsorbent. The number of methylene blue is used to analyze the presence microporosity (>1.5 nm) and meso porosity developed. The quantity of the methylene blue adsorbed reveals the adsorptive properties of a carbon towards larger molecules [26]. The methylene blue number was determined by mixing of 0.3-0.5 g of 100 mesh activated carbon with 30 ml of methylene blue solution and agitating the mixture till the blue color disappears. Then 5 ml of methylene blue was added to the solution followed by further agitation. This process was continued until the color of methylene blue was visually judged to be retained. The methylene number was then determinate by using the following equation:
where, MBN= Methylene Blue Number, absorbed mg methylene blue per gram of carbon (mg/g), MBVT=total amount of methylene blue used (mg) and M= mass of carbon used (g).
Results of methylene blue number measurements for each activated carbon samples with particle size 100 mesh are shown in Table 2.
Table 2 Methylene Blue Number for the four different activated carbon samples.
| Sample | PE-BAKI | WN-BAKI | FW-BAKI | CO-BAKI |
|---|---|---|---|---|
| Methylene Blue, Number, (mg/g) | 180 | 200 | 200 | 3 |
The results obtained from both, iodine number and methylene blue for activated carbon particles follows the same trend. Although, the WN-BAKI and FW-BAKI have different structures and textural properties, the formation of micro and meso cavities depends on their nanostructure and the main role in the absorption of the methylene blue is the meso cavity with a diameter of 2 to 50 nanometers and both of them have mesopore. The lowest methylene blue number belongs to coal, because of high carbon content and low porosity. WN-BAKI has the highest methylene blue number, so it has more meso pore than others.
Measurement of Surface Area
All samples were dried at 110 °C for 24 hours prior to measurement of their surface areas by nitrogen adsorption technique. The measured surface areas from fitting the isotherms with B.E.T. or Langmuir equations are shown in Tables 3, 4, 5 and 6.
Table 3 Surface areas for activated carbons from PE-BAKI sieved with different mesh: 8X30, 30X50 and 60X80
| PE-BAKI Mesh | Surface Area (m2/g) | |||||
|---|---|---|---|---|---|---|
| B.E.T | Langmuir | T-Plot Micropore | T-Plot External | B J H Adsorption Cumulative | B J H Desorption Cumulative | |
| 8 X 30 | 454.5 | 601.8 | 364.5 | 89.9 | 12.4 | 12.9 |
| 30 X 50 | 536.6 | 715.8 | 401.8 | 134.7 | 30.1 | 40.9 |
| 60 X 80 | 840.6 | 1127.9 | 589.7 | 250.8 | 78.5 | 96.9 |
Table 4 Surface areas for activated carbons from WN-BAKI sieved with different mesh: 8X30, 30X50 and 60X80
| WN-BAKI Mesh | Surface Area (m2/g) | |||||
|---|---|---|---|---|---|---|
| B.E.T | Langmuir | T-Plot Micropore | T-Plot External | B J H Adsorption Cumulative | B J H Desorption Cumulative | |
| 8 X 30 | 275.1 | 363.1 | 219.6 | 55.4 | 10.4 | 10.3 |
| 30 X 50 | 502.0 | 669.4 | 363.9 | 138.0 | 45.2 | 52.9 |
| 60 X 80 | 584.5 | 780.6 | 407.1 | 177.4 | 60.0 | 68.9 |
Table 5 Surface areas of activated carbons produced from FW-BAKI and sieved with different mesh: 8X30, 30X50 and 60X80
| FW-BAKI Mesh | Surface Area (m2/g) | |||||
|---|---|---|---|---|---|---|
| B.E.T | Langmuir | T-Plot Micropore | T-Plot External | B J H Adsorption Cumulative | B J H Desorption Cumulative | |
| 8 X 30 | 422.6 | 562.4 | 295.4 | 127.1 | 53.3 | 68.6 |
| 30 X 50 | 649.1 | 866.1 | 455.7 | 193.3 | 84.0 | 105.3 |
| 60 X 80 | 661.1 | 883.0 | 443.1 | 218.0 | 95.4 | 118.4 |
Table 6 Surface area of activated carbons from CO-BAKI sieved with different mesh: 8X30, 30X50 and 60X80
| CO-BAKI Mesh | Surface Area (m2/g) | |||||
|---|---|---|---|---|---|---|
| B.E.T | Langmuir | T-Plot Micropore | T-Plot External | B J H Adsorption Cumulative | B J H Desorption Cumulative | |
| 8 X 30 | 59.6 | 80.7 | 58.1 | 1.4 | 0.7 | ---- |
| 30 X 50 | 81.5 | 107.9 | 73.3 | 8.2 | 0.23 | 0.17 |
| 60 X 80 | 87.8 | 116.2 | 77.7 | 10.0 | 0.24 | 0.18 |
The standard de Boer T-Plot technique was used to obtain the external surface area. A micro pore area which is the difference between BET and the external area of the activated carbon samples were also obtained. Barrett-Joyner-Halenda (BJH) procedures was used to calculate surface areas for small meso and micro pore sizes. These results are also shown in Tables 3 to 6. Results are obtained from BET show that 60 X 80 mesh of PE-BAKI has the highest surface area among all used materials, and results are obtained from the standard de Boer T-Plot technique show that 60 X 80 mesh of FW-BAKI has the highest external surface area among all used materials.
It should be noted that the samples with a same mesh size differ in adsorption properties, this difference may cause due to different kind of pore (passing pores, dead end pores, closed pores and inter-connected pores) and/or where the pore is actually located (inside the particle versus between the particles) and/or pore shape and especially dependence to mean pore diameter.
Measurement of Pore Volume
The results of pore volume measurements according to de Boer T-Plot and BJH procedures for four different activated samples with three meshes, 80x30, 30x50 and 60x80 are shown in Tables 7-10.
Table 7 Pore volume of activated carbons prepared from PE-BAKI sieved with different mesh; 8X30, 30X50 and 60X80
| PE-BAKI Mesh | Pore Volume (cm³/g) | ||
| T-plot Micropore | B J H Adsorption Cumulative | B J H Adsorption Cumulative Volume | |
| 8 X 30 | 0.168 | 0.016 | 0.010 |
| 30 X 50 | 0.185 | 0.035 | 0.037 |
| 60 X 80 | 0.271 | 0.087 | 0.094 |
Table 8 Pore volume of activated carbon prepared from WN-BAKI sieved with different mesh; 8X30, 30X50 and 60X80
| WN-BAKI Mesh | Pore Volume (cm³/g) | ||
|---|---|---|---|
| T-Plot Micropore | B J H Adsorption Cumulative | B J H Adsorption Cumulative Volume | |
| 8 X 30 | 0.101 | 0.013 | 0.0087 |
| 30 X 50 | 0.168 | 0.052 | 0.050 |
| 60 X 80 | 0.188 | 0.068 | 0.069 |
Table 9 Pore volume of activated carbon prepared from FW-BAKI and with different mesh; 8X30, 30X50 and 60X8
| FW-BAKI Mesh | Pore Volume (cm³/g) | ||
|---|---|---|---|
| T-plot Micropore | B J H Adsorption Cumulative | B J H Adsorption Cumulative Volume | |
| 8 X 30 | 0.136 | 0.079 | 0.081 |
| 30 X 50 | 0.211 | 0.114 | 0.121 |
| 60 X 80 | 0.204 | 0.135 | 0.143 |
Table 10 Pore volume of activated carbon produced from CO-BAKI and sieved with different mesh; 8X30, 30X50 and 60X80
| CO-BAKI Mesh | Pore Volume (cm³/g) | ||
|---|---|---|---|
| T-plot Micropore | B J H Adsorption Cumulative | B J H Adsorption Cumulative Volume | |
| 8 X 30 | 0.028 | 0.0012 | ----- |
| 30 X 50 | 0.033 | 0.0064 | 0.0016 |
| 60 X 80 | 0.035 | 0.0069 | 0.0018 |
Results are obtained from the standard de Boer T-Plot technique show that 60 X 80 mesh of PE-BAKI has the highest pore volume among all used materials. It should be noted that, there are some parameters that could affect in differences of surface area and pore volume as well, such as; their production techniques, chemical raw materials, chemical composition, structure, surface morphology, and synthesis conditions, such as temperature, pH, and reactant ratios, activation times [27].
Comparison of Surface Area and Pore Volume with Different Meshes
The change in Langmuir surface area for four different activated carbons with mesh size of 30x50 and 60x80, in comparison with those with mesh 8x30 is shown in Fig. 1.
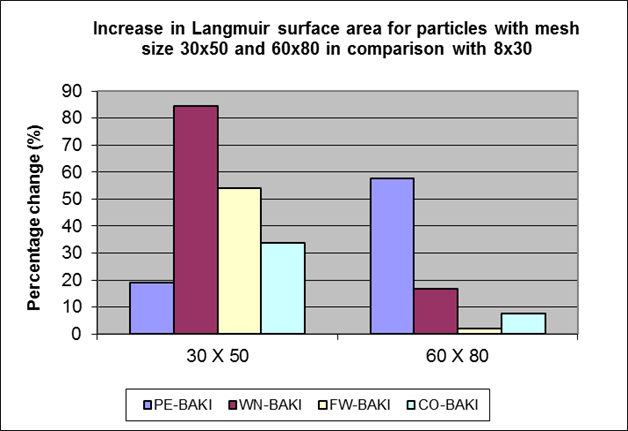
Fig. 1 Change in Langmuir surface area for particles of 30x50 and 60x80 meshes in comparison with 8x30.
Similarly, the change in micro-pore volumes for T-plot analysis for the four different activated carbons with mesh size of 30x50 and 60x80, in comparison with those with mesh 8x30 is shown in Fig. 2.
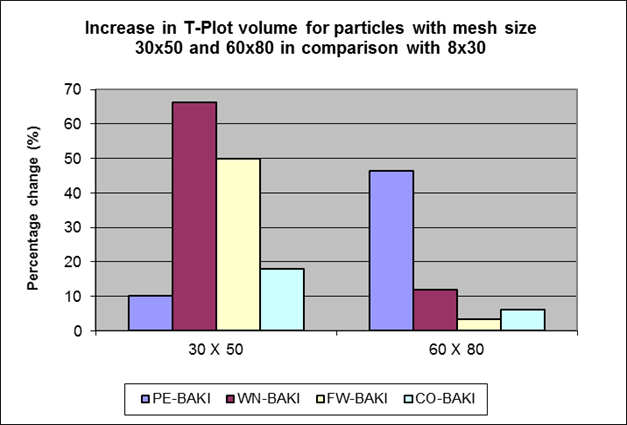
Fig. 2 An increase in T-Plot micro pore volume for particles of 30x50 and 60x80 meshes in comparison with 8x30
As shown in these figures, the most increase in pore area and volumes with reduction in particle sizes are seen for activated carbons made from walnut wood followed by forest wood whereas the least changes are observed for activated carbons made from coal. This study suggests that walnut wood is a valuable resource for producing activated carbons. The results of this study shows by reducing particle size of activated carbons their surface area and micro pore volume increase based on B.E.T. and Langmuir surface area calculations and T- Plot procedures for micro pore volume calculations. The percentage of surface area and micro pore volume increase for particles of 30x50 and 60x80 mesh sizes compare with 8x30 mesh for the four activated carbons type produced are summarized in Table 11.
Table 11 The Latest Results
| Mesh size | Pistachio wood | Walnut wood | Forest wood | Coal | |
|---|---|---|---|---|---|
| 8x30 | Surface area m2/g | - | - | - | - |
| Volume g/cm3 | - | - | - | - | |
| 30x50 | Surface area m2/g | 18.9 | 84.4 | 54.0 | 33.7 |
| Volume g/cm3 | 10.12 | 66.33 | 50.0 | 17.85 | |
| 60x80 | Surface area m2/g | 57.57 | 16.6 | 1.9 | 7.69 |
| Volume g/cm3 | 46.48 | 11.9 | 3.43 | 6.06 |
The largest change in surface area and micro pore volumes with decreasing particle sizes are observed for activated carbons produced from walnut wood whereas activated carbons produced from coal show the lowest increases. Activated carbons produced from pistachio and forest wood perform somewhere in between those of walnut and coal.
Conclusion
The main objective of the present work is to make a technical comparison between activated carbons obtained from different sources. The results of this study showed that activated carbon with forest wood based from four types of activated carbon produced from pistachio wood, walnut wood, forest wood and coal with different mesh sizes of 8 × 30, 30 × 50 and 60 × 80, has highest surface area. Our results showed that the adsorption properties of the different activated carbons as a function of their respective pore size. We indicated that the changes in surface area determine the effectiveness and suitability of an activated carbon. The results obtained from measurements of iodine number, methylene blue, surface area, pore volume and comparison of surface area and pore volume, show that by decreasing of particle sizes of each sample, increase the surface area and micro pore volumes significantly. With decrease of particle size the surface area increase from 562 to 883 m2/g. The highest pore volume belongs to pistachio wood, which was increased from 0.168 to 0.271 cm3/g from 8x30 to 60x80 mesh.

