


 text new page (beta)
 English (pdf)
 Article in xml format
 Article references
 Send this article by e-mail
 Cited by SciELO
  Similars in
SciELO
Similars in
SciELO 
 Permalink
Introduction
Ibuprofen is a nonsteroidal anti-inflammatory drug that inhibits the cyclooxygenase system, particularly the COX-2 enzyme. It is generally employed as analgesic and antipyretic for a variety of inflammatory pathologies, including chronic therapies for osteoarthritis and rheumatoid arthritis [1]. This drug is sometimes associated with a “peppery” taste that limits its use as analgesic and antipyretic in children. Moreover, ibuprofen irritates the throat associated with sting/prick, itch and tickle [2]. Ibuprofen has poor water solubility although it has good absorption, producing peak plasma concentration around 1-2 hours after oral administration. An important limitation is its short half-life (~2 h), requiring several dosages for effective and prolonged pharmacological activity, increasing adverse effects. The development of formulations such as nanoparticles, aimed at minimizing adverse effects, improve its activity and prolong the drug release [3] is an option from a technological point with high potential.
For pharmaceutical purposes, nanoparticles are defined as solid colloidal particles with a size range of 1-1000 nm and that consist of macromolecular or lipidic materials in which a therapeutic ingredient is dissolved, trapped, encapsulated, adsorbed or linked [4,5]. “Nanoparticle” (NP) is a collective term applied to any type of submicronic particle characterized by one of two different kinds of architecture: nanospheres (NE) and nanocapsules (NC) [6]. Nanospheres can be defined as solid, colloidal matrix-type particles in which a drug is dissolved, trapped, encapsulated, and chemically-bonded or adsorbed to the polymeric matrix [7]. Nanocapsules, in contrast, are vesicular systems that act as a type of reservoir where the trapped substance is confined in a cavity that consisting of a liquid nucleus (oil or water) surrounded by a membrane made of solid material [8] (Fig. 1). Given the advantages that polymeric nanoparticles offer for pharmaceutical use due to their capacity for controlled release, this study was intended to evaluate ibuprofen release profiles from NC and NE to determine the degree of difference in terms of drug delivery between the two structures and establish release models and mechanisms in relation to the structural characteristics. NC and NE systems were prepared using the same formulation, method and dosage. Thus, the study presents a direct comparison of these different pharmaceutical vectors with a widely used drug.

Results and Discussion
Formulation and characterization of size and zeta potential
The selection of the formulations to be evaluated (Table 1) reflects the proportions suggested by Mora-Huertas et al. [9] and previous experiences by our research group.
Table 1 Formulations selected for nanoparticle preparation.
| Ingredient | Function | Proportion |
|---|---|---|
| Ibuprofen | Active ingredient | 250 mg |
| Eudragit® E 100 | Polymer | 1.0-2.0 % (w/v) of the solvent of the phase internal |
| Oleic acid | Oil | 2.5-5.0 % (v/v) of the solvent of the internal phase |
| Polyvinyl alcohol (PVA) | Stabilizing agent | 2.0-5.0 % (w/v) of the solvent of the external phase |
| Ethyl acetate (AcOEt) | Internal solvent phase (organic) | 20 mL |
| Purified wáter | External solvent phase (aqueous) | 80 mL |
| Purified wáter | Dilution phase | 300 mL |
To ensure that the variable evaluated was the structural difference between NC and NE, we decided to establish the base formulation considering only the NC, since their encapsulation efficiency depends on the solubility of the active ingredient in the oil phase [10]. Here, it is important to consider that the comparison made between these two systems is not based on the size, but on NC and NE composition.
After selecting the formulation to be used when performing the comparative study of the release profiles, we proceeded to evaluate particle size, the polydispersion index (PDI), and the zeta potential (ζ) as a function of the proportions of the components selected. Results are shown in Table 2; submicronic dispersions were obtained for all the formulations prepared.
Table 2 Results of the proportion of components on particle size and ζ potential.
| Nanocapsules | ||||||
|---|---|---|---|---|---|---|
| Batch | % Polymer | % Oil | % Stabilizing agent | Mean diameter ± SD (nm) | PI ± SD | Mean ζ ± SD (mV) |
| 1 | 1 | 5 | 2 | 241.2 ± 2.5 | 0.138 ± 0.175 | 38.1 ± 1.5 |
| 2 | 1 | 5 | 3 | 228.3 ± 0.4 | 0.138 ± 0.094 | 37.0 ± 3.3 |
| 3 | 1 | 5 | 5 | 219.0 ± 2.1 | 0.294 ± 0.090 | 39.2 ± 1.6 |
| 4 | 1 | 2.5 | 3 | 196.6 ± 6.6 | 0.097 ± 0.049 | 37.6 ± 3.8 |
| 5 | 1 | 3.5 | 3 | 205.5 ± 3.1 | 0.214 ± 0.145 | 39.2 ± 2.3 |
| 6 | 1.5 | 5 | 3 | 228.0 ± 1.6 | 0.171 ± 0.030 | 35.7 ± 3.1 |
| 7 | 2 | 5 | 3 | 221.4 ± 4.1 | 0.178 ± 0.019 | 36.3 ± 2.8 |
| Nanospheres | ||||||
| Batch | % Polymer | % Stabilizing agent | Mean diameter ± SD (nm) | PI ± SD | Mean ζ ± SD (mV) | |
| 1 | 2 | 3 | 183.4 ± 3.7 | 0.144 ± 0.065 | 20.9 ± 4.4 | |
Observations of formulations 1, 2 and 3 for NC indicated that increasing the percentage of the stabilizing agent in the aqueous or continuous phase reduced the mean diameter of the systems. This significant difference (p < 0.05) is due to the effect of the stabilizer in suspension, which is adsorbed into the interphase o/w and prevents coalescence of the globules formed during emulsion. Meanwhile, observations of formulations 2, 4 and 5 showed a relation in which the increase in the concentration of oil in the organic phase increased mean particle size (p < 0.05).
Other observations included that formulations 2, 6 and 7 had no relation between the percentage of polymer in the organic phase and particle size. This may indicate that, at the polymer concentrations evaluated, particle size is determined principally by the amount of encapsulated oil and the percentage of stabilizing agent. This result coincided with reports of formulations prepared using the emulsion-diffusion method, in which the increase in polymer concentration did not influence particle size [11], although there are reports that the polymer concentration can influence the thickness of the polymeric membrane formed [12,13].
Nanoparticle dispersions are often polydispersed; that is, they may contain particles that vary greatly in terms of the distribution of sizes and forms, instead of particles of only one size and shape, large particles would sediment [14]. Therefore, the polydispersion index (PDI) is a parameter that relates the physical stability of NP. Its value must be as low as possible to ensure long-term stability. Table 2 shows the PDI results for the prepared NP obtained with light scattering technique. These values are between 0.097 and 0.249. A PDI value of 0.1-0.25 indicates a narrow size distribution, while values above 0.5 indicate broad distributions [15].
The positive value registered for NPs resulted from the positive charge of the polymeric chains of Eudragit, a cationic copolymer based on dimethyl aminoethyl methacrylate, butyl methacrylate and methyl methacrylate, and from the incorporation of a non-ionic stabilizing agent. The values of the ζ potential for the seven formulations evaluated fell in a range of 35.7-39.2 mV, which means that these suspensions had good stability in suspension [16].
The absolute value of the ζ potential of the NE was found to be lower than the value observed in the NC carried out with the same formulation. This difference may be due to a greater interaction between the PVA and Eudragit on the surface of the NE, which formed a firmly-bonded layer which caused a reduction in electrophoretic mobility that led to the decrease in the ζ potential of the NE [17].
Due to the good stability of the NC batches, formulation number 7 (2% polymer, 5% oil and 3% stabilizing agent) was selected for the release tests because it contained the highest percentages of oil and polymer of all the formulations evaluated, thus being capable of dissolving and encapsulating a larger amount of ibuprofen.
The comparison of the NP systems demonstrated that the mean diameter of the NE is less than NC prepared using the same formulation. These size differences coincided with the results obtained by Schaffazick et al. [18] for NC and NE produced with Eudragit S90, and to the sizes generally obtained for both systems as described in the literature, due to their structural differences [7].
Drug loading
A drug loading percentage of 43.2 ± 0.9 % of ibuprofen was obtained in NE, which depends, among other variables, on the polymer-drug ratio, their interactions and the preparation method employed. While for NC, a percentage of 75% was determined, which related well with data reported for the emulsification-diffusion method [9] due to the high solubility of the drug in the oil core (233.2 mg / mL). Ibuprofen, as a hydrophobic drug can be more effective when dissolved in the oleic core of a NC than when enclosed only in the polymeric matrix of a NE [19].
Nanoparticle density determination
Nanocapsules, and nanoemulsion were compared after ultracentrifugation on a density gradient, in order to evaluate whether non-encapsulated oleic acid remained in the formulation and determine the yield of NCs production. Fig. 2 presents the positions of the bands obtained for the NP systems evaluated on a density gradient. Each line corresponds to one density marker. The density values shown in Fig. 2 were provided by the manufacturer of the marker pearls. The order of these markers is related to their density on a Percoll gradient. Higher density markers reflected a greater distance from the meniscus (lower height compared to the bottom of the tube).
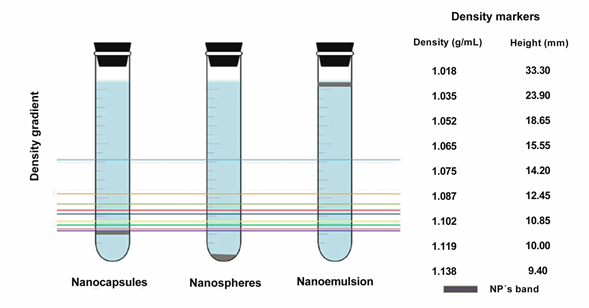
Fig. 2 Schematic representation of the density determination of the nanoparticulate systems. Left, location of the nanoparticles in the tubes after centrifugation and their comparison with the density markers. Right, density values of each marker, from top to bottom, and their corresponding measured height from the bottom of the tube for interpolation of the NPs values. (The top blue line corresponds to 1.018g/mL density marker).
That figure shows that the density band for NC is well defined, corresponds to 1,140 g/mL, and occupies an intermediate position between those of the NE and nanoemulsion prepared under the same conditions. The existence of a unique density band indicated high yields, which also means that all of the oleic acid oil is well trapped in the core of the NC with a narrow distribution of the NC weight. It is noteworthy that this method was quantitative, employed with the intention to verify that NC possessed a vesicular cavity, with no polymer aggregates or free emulsion in the final suspension. This result coincided with the report by Quintanar-Guerrero, et al. who employed the same determination method for polylactic acid nanoparticles (PLA) [20]. Regarding the nanoemulsion system, the band remained at the application point, while in the case of the NE system, sediment was formed. This suggested that adequate interaction of the polymer and oil was achieved during the formation of the NC, as these are less dense than the NE due to the oil nucleus they encapsulate, but denser than the emulsion because of the polymeric membrane that formed. This suggested that, the amount of polymer was sufficient to envelop all the oil droplets. Formation of the sediment in the NE tube is due to the compact structure of this system, which consists only of the desolvated polymer and drug. This result also indicated that the density of the NE lies beyond the density gradient formed during centrifugation; therefore, it was not possible to obtain a reliable density value for this system utilizing extrapolation. Finally, the band that corresponded to the nanoemulsion -composed of oil globules in suspension-showed no migration through the gradient due to the lesser density of the oil with respect to the Percoll gradient formed.
In vitro drug release
In order to compare the differences between NC and NE, due to the difference in the internal structure of both systems and the release of the drug to the outside, the ibuprofen release profile from NC and NE through the dialysis membrane method was investigated. The dialysis technique performed in PBS solution at physiological pH 7.4 provides an important approximation of the distribution of encapsulated drug in vivo after intravenous administration [21]. Fig. 3 shows the diffusion profile of the dissolved ibuprofen through the membrane, as well as the mean release profiles obtained for the systems evaluated. The characteristic initial burst (grater for NE), registered for the first minutes of the experiment was followed by a slower continuous rate. Clearly, there is no similarity among the three curves shown, and the diffusion of the dissolved drug occurred more quickly (>70% in 2 h). This suggests that the dialysis membrane presented no significant resistance to drug diffusion. Usually, general opinion holds that demonstrating that the diffusion of the free drug through the dialysis membrane occurs more quickly than the release profile measured for the drug in the NP, this confirms that the specifications of the dialysis membrane are appropriate for the release test [22].

Fig. 3 Ibuprofen release from nanocapsules and nanospheres by the dialysis membrane method and its comparison with the drug without carrier. Each point represents the mean (n=4) with standard deviation.
The profile for “Ibuprofen” corresponds to the total amount theoretically contained in each dialysis bag. The percentages of ibuprofen released after 4 h of sampling were 81.7% ± 11.5% and 62.0% ± 5.4% for the NC and NE formulations, respectively.
Statistical evaluation of the release profiles was performed using a Student t test at three different moments -60, 105 and 220 minutes- which correspond to 25%, 50% and 75%, respectively, of the amount of ibuprofen theoretically released by the NC. This analysis determined that at the three intervals assessed there was a statistically-significant difference between the percentages of ibuprofen released by the NC and NE, with the former demonstrating fastest release time. These differences in release velocities were due to the structural differences of these NP, since in the case of the NE the polymer that disperses the drug in the matrix prolonged release because of the increased diffusion distance. The sustained ibuprofen release offers several important advantages over immediate-release dosage forms of the same drug, i.e. less frequent dosing or a decrease in local inflammation.
The study also evaluated the differences between the release profiles of ibuprofen in the NP systems employing the Zero order, First order, Higuchi, and Korsmeyer-Peppas mathematical modeling analyses.
Fig. 4 shows the analyses of the mean release profile of ibuprofen employing NC, following the models mentioned. It is clear that the model that most closely adjusts for the profile, according to the criterion established (R2 correlation coefficient closest to 1), is the Zero order model, which indicated that the amount of drug released is independent of concentration, in that the same amount of drug was released per time unit. This type of kinetics is ideal for achieving prolonged pharmacological action [23]. In the case of the NC, drug release proceeded through partition from the reservoir into the polymeric membrane, followed by diffusion through the membrane toward the release medium. As long as drug saturation is maintained in the nucleus, there will be a concentration gradient through the membrane and release will proceed at a constant velocity.

Fig. 4 Ibuprofen release profiles adjusted to different mathematical models to estimate the mechanism of release from nanocapsules. A) zero order; B) first order; C) Higuchi; and D) Korsmeyer-Peppas.
Fig. 5 also presents the analyses of the release profile of ibuprofen employing NE. Here, the first order model is that which best adjusts to the release kinetics. This indicated that the amount of ibuprofen released is proportional to the amount of drug that remains inside the particles. According to Mulye and Turco [24], this model is also followed by porous matrices with water-soluble drugs. This coincides with our system when we consider that ibuprofen is highly-soluble in the medium because it is ionized (pKa 4.51 [25]) at the pH selected (7.6).

Fig. 5 Ibuprofen release profiles adjusted to different mathematical models to estimate the mechanism of release from nanospheres. A) zero order; B) first order; C) Higuchi; and D) Korsmeyer-Peppas.
The release coefficient values (n) determined for NC and NE using the semi-empirical Korsmeyer-Peppas model are 0.799 and 0.816, respectively. These are similar and coincide with results reported in the literature with formulations that include Eudragit® E100 [26]. They further indicated that the systems adhere to an anomalous (i.e., non-Fickian) diffusion release mechanism that refers to a combined controlled release through the phenomena of the diffusion of the drug from the matrix and the swelling and erosion of that matrix [27]. This can be explained by the properties of the polymer. The polymer Eudragit® E100 is soluble at pH values below 5 but, swells and becomes permeable above this pH [28]. In the case of the NC, the reduction in the concentration gradient and the increase in the diffusion distance caused a decrease in the transport velocity of the drug, which can be counteracted by the increase in porosity that results from the swelling and erosion and, in turn, leads to an increase in transport velocity that results in an apparent kinetics of zero order. In the case of the NE, due to the characteristic swelling of the polymer of the matrix in which the drug is dispersed, a gel layer forms that controls water penetration and drug diffusion [24]. In the matrix-type systems, there is no membrane that could function as a barrier to diffusion, therefore this system showed a high initial release followed by a reduction in the release velocity accompanied by an increase in the diffusion distance for the molecules located in the center of the carrier [23,30].
In this research, NC and NE of Eudragit E100 were obtained employing the emulsification-diffusion method and the density of the NC was of 1,140 g/mL being intermediate to the densities of NE (higher than) and nanoemulsion (less than). This demonstrated the structural differences between NP systems, their adequate formation and high yield. The dialysis membrane method for the in vitro evaluation of the systems proved to be suitable for performing the comparative release assay because it did not exhibit impediment in terms of the diffusion of the drug towards the release medium. The release kinetics of both systems were adjusted to different models evaluated. Release kinetics corresponding to NC followed the zero-order model while for NE the kinetics were fitted to the first order model. These differences in release kinetics were due to the structural differences between both systems of NPs. The diffusional mechanism determined for both NP systems according to the coefficient “n” of the Korsmeyer-Peppas semi-empirical model was anomalous (not Fickian) diffusion controlled by phenomena of drug diffusion and swelling of the polymer at the selected pH. This similarity in the coefficients was due to the nature of the polymer and coincided with results described in the literature.
Experimental
Materials
Eudragit® E100 and Ibuprofen were generously donated by Helm de México, S.A. de C.V. Percoll®, oleic acid and dialysis tubes (cellulose membrane MCWO 14,000 Da) were obtained from Sigma (St. Louis, USA). Density Marker Beads® were purchased from Pharmacia LK B (Sweden). Poly(vinyl alcohol) (PVA) with a molecular mass of 31,000 (Mowiol® 4-88) was obtained from Hoechst (Frankfurt-am-Main, Germany). Ethyl acetate (AcOEt) was supplied by Fermont (Monterrey, Mexico). Deionized water was obtained from the Elix 5® system (Millipore, USA). All other chemicals were of at least analytical grade and used without purification.
Nanoparticle preparation
The emulsification-diffusion technique with minor variations was employed to prepare nanoparticles [20]. Typically for NC, the solvents used in the internal (ethyl acetate, AcOEt) and external phases (purified water) were saturated for 5 min before use to ensure thermodynamic equilibrium between the two liquids. Once the phases were separated, the amounts of polymer (Eudragit®) and oil that corresponded to each lot were dissolved in 20 mL of AcOEt saturated with water. This organic solution was then emulsified with 80 mL of an aqueous solution saturated with AcOEt and the stabilizing agent (PVA 2-5% w/v) using a high-speed, rotor-stator agitator (Ultra-Turrax T18, IKA) at 15,500 rpm for 6 minutes. After this, 300 mL of purified water was added to the emulsion under moderate agitation to induce the diffusion of the AcOEt towards the continuous phase and the formation of NC. Preparation of the NE followed the same procedure, except that no oil was added to the formulation. A third system, a nanoemulsion was prepared using the same method, both whithout the addition of the polymer in order to compare it is density whit the NC y NE. The remaining stabilizer and un-encapsulated ibuprofen were removed by ultracentrifugation at 30,000 rpm for 60 min at 20°C (Beckman Optimal LE-80K, CA, USA). Finally, these were frozen, first at -5°C for 30 min, then at -40°C for 180 min, and finally freeze-dried for 24 h at 100 x 10-3 mbar (Labconco®, United Kingdom). The formulations evaluated are summarized in Table 1.
Determination of particle size
Mean particle size and polydispersity index (PDI) of the prepared nanoparticle suspensions were determined by the laser light scattering technique with Nanosizer equipment (N4 plus, Coulter, USA). The laser light wavelength (He/Ne, 10 mW) was 678 nm. Measurements were obtained at a 90° fixed-angle for 180s at 20°C. Scattering intensity data were analyzed by digital correlation under a unimodal analysis mode. Dispersions were diluted with MilliQ® water until the appropriate particle concentration was reached, as indicated by the particle counts per second. Measurements were performed in triplicate.
Determination of zeta potential (ζ)
The zeta potential was determined by Electrophoretic Mobility employing Laser Doppler Velocimetry in a Zetasizer applying the Smoluchowski approximation (NanoZS90, Malvern, UK) at 25°C in a capillary cell. Measurements were performed by triplicate. Samples were diluted with MilliQ® water and all determinations were performed in triplicate.
Experimental drug loading
In order to quantify the amount of drug in the supernatant, the nanoparticles were ultracentrifuged at 30,000 rpm, 5°C, 3 hours. Drug-loading was determined by spectrophotometry at 265 nm of the supernatant. Quantification was achieved by comparing the absorbance of 265 nm of ibuprofen sample to a calibration curve.
Determination of the density of nanoparticulate systems
To evaluate the density as a function of nanoparticle dispersion, the isopycnic centrifugation technique was utilized on a density gradient of colloidal silica (Percoll®). Three different suspensions were prepared, each one corresponding to one of the nanoparticulate systems (NC, NE and nanoemulsion). The suspensions were concentrated using a rotatory evaporator (Laborota 4000, Heidolph). For each suspension, 50 µl of concentrate were added to 7 mL of a Percoll® 45% (v/v) diluted with 0.15 M NaCl. Samples were centrifuged at 15,000 rpm for 3 hours at 5°C by ultracentrifugation (Optima™ LE-80K, Beckman) to generate the density gradients. The height of each band was measured with a Vernier calibrator from the bottom of the tube to the center of the band. Density marker beads (30 µL of each one) were treated in the same way. The density of the samples was calculated on the basis of the curve obtained upon plotting the reciprocal of the height against the reciprocal of the density of the markers.
Evaluation of ibuprofen release profiles
The ibuprofen release tests were conducted using a membrane dialysis method containing 25 mL of nanoparticle suspension equivalent to 50 mg of ibuprofen, as follows: dialysis tubes were attached to a basket of a USP dissolution apparatus I and placed in beakers with 400 mL of phosphate buffer solution 0.1 M at pH 7.6 ± 0.1, 37 ± 0.5°C, and stirred at 100 rpm. Samples (3 mL) were collected without replacement at 15, 30, 45, 60, 75, 90, 105, 120, 140, 160, 180, 200, 220 and 240 min. Ibuprofen quantification was carried out by spectrophotometry at 221 nm interpolating on a calibration curve. For comparison with free ibuprofen, free drug release profile was performed under the same conditions employing 50 mg of the drug, samples were collected at 20, 40, 60, 90 and 120 min., respectively.

