


 nueva página del texto (beta)
 Inglés (pdf)
 Artículo en XML
 Referencias del artículo
 Enviar artículo por email
 Citado por SciELO
  Similares en
SciELO
Similares en
SciELO 
 Permalink
Introduction
Because the worldwide market for benzodiazepines is extremely large, they continue to be developed, evaluated and introduced for clinical use. The assay methods applied to determine their concentration are important in evaluating their pharmacokinetics, bioavailability and clinical pharmacology, and to detect and identify them in toxicological and forensic samples involving road traffic offences and/or drug overdoses.
It is well known that the enantiomers of the benzodiazepines possess different biological activity. For instance, the (+)-enantiomers of the 3-chiral benzodiazepines have been found to possess higher potency in displacing [H] diazepam binding [1] than the respective (-)-enantiomer in synaptosomal preparations from rat cerebral cortex [2]. It has been reported that esterases in liver and brain homogenates of mice have an opposite stereoselectivity; esterases in liver homogenate predominantly hydrolyse (-)-3R-oxazepam acetate, whereas esterases in brain homogenate predominantly hydrolyse (+)-3S-oxazepam acetate [3]. Nowadays, these differences in biological activity of the enantiomers have become evident for almost all compounds of pharmaceutical and biological interest. Therefore, analytical methods for chiral separations, preparative purposes, purity control of the enantiomers, and pharmacological studies are of great importance and in high demand.
Chiral benzodiazepines are currently analyzed through the use of high performance liquid chromatography (HPLC) applying various types of synthetic chiral stationary phases [4-6] such as Chiralcel-OD-R® [7], β-cyclodextrin chemically bonded to silica [8] and Chiral-AGP® (protein based column) [9]. For the non-chiral separation of these compounds, capillary micellar electrokinetic chromatography (MEKC) using sodium dodecyl sulfate [10-13] and capillary electrochromatography (CEC) with cholesteryl-10-undecenoate as capillary modifier [14] have been used for their analysis in body fluids for toxicological and forensic purposes. A chiral separation of benzodiazepines by CEC was reported by Lloyd et al. [15] using a capillary packed with human serum albumin. It is well known that capillary electrophoresis (CE) offers several advantages in the field of chiral separations compared to other techniques (i.e. low reagents consumption, high efficiency, rapid development). There are two reports of the chiral separation of benzodiazepines using MEKC, one using sodium cholate as a chiral selector [16] and another using polymeric surfactants and mass spectrometry [17], with poor resolutions no greater than 1.6. However, until now, there are no reports about the chiral separation of the benzodiazepines by this technique using CD´s.
In CE, chiral separation can be achieved using various chiral selectors. However, among a long list, cyclodextrins (CD) have become the most popular, because they are inexpensive, provide a fast equilibration of the CD-solute complex, they possess a high efficiency and a good peak symmetry. CD’s have been widely used as chiral selectors in many HPLC and CE applications [18-20]. A very important requirement for the separation of enantiomers by CE is that either the analyte, the CD or both must be charged and, as a consequence, possess different mobilities toward the bulk solution. In the benzodiazepines case, the compounds are neutral in a very wide pH range (pH 2.9 to 11.6). Neutral CD´s are not used for the analysis of these uncharged enantiomers because separation is not possible without the addition of charged additives such as ionic CD’s [21] or surfactants [22]. Therefore, charged CD’s are very advantageous chiral agents for neutral compounds. Sulfated cyclodextins have become increasingly important chiral selectors within last few years. They have been successfully used in the separation of enantiomers in a wide variety of compounds [23-27]. They are strong electrolytes that can be used at any pH required, possess the maximum number of charged functional groups on the 6-position of the glucose moieties, and are not mixtures of different isomers. As described in Wren and Rowe's model [28], the greater the mobility difference between the free and complexed analyte, the better the resolution. Uncharged compounds, because they co-migrate with the electroosmotic flow, are moving in opposite direction than the negatively charged selectors.
In this work, a rapid method in determining the separation conditions for chiral resolution of the 3-chiral-1,4-benzodiazepines by capillary electrophoresis using sulfated cyclodextrins is described. Additionally, to better understand the mechanism that takes place in the separations, the evaluation of the drug-CD equilibrium constant formation and a molecular modeling study was carried out for each compound. A final comparison of the experimental and the theoretical studies was carried out to make more accurate conclusions about how a specific chiral selector discriminates between enantiomers.
Experimental
Apparatus and Reagents
A fully automated capillary electrophoresis instrument CE ultra, (TermoQuest Co., San Jose, CA, USA) equipped with a fast scanning UV-VIS detector, was used for all measurements. An uncoated fused silica capillary 50 μm I.D., 43.3 cm total length (37.1 cm length to the detector cell) was utilized. Sodium tetraborate (Na2B4O7), phosphoric acid, and triethanolamine were provided by MERCK (Darmstadt, Germany). Heptakis-6-sulfato-β-cyclodextrin (HSβCD), heptakis-(2,3-diacetyl-6-sulfato)-β-cyclodextrin (HDASβCD), and heptakis-(2,3-dimethyl-6-sulfato)-β-cyclodextrin (HDMSβCD) by Regis Technologies (Illinois, USA). The racemic 3-chiral 1,4-benzodiazepines drug substances: temazepam, lorazepam, oxazepam, and lormetazepam were gifts from diverse sources. A viscometer Ubbelohde from Analis (Gent, Belgium) No. 7728, thermostated at 15 oC was used for the viscosity determinations. Calculations of the pKa values of the benzodiazepines were done using ACD/Labs Software (ARC Laboratories, Amsterdam, The Netherlands). Structure optimization determination and molecular modeling were performed in a supercomputer CRAY YMP/464.
Methodology
The acidic phosphate/triethanolamine buffer was prepared by titration of a 25 mM phosphoric acid solution with triethanolamine, until reaching the required pH. The background electrolyte (BGE) borate buffer was prepared by titration of a 20 mM sodium tetraborate solution with either 0.1M NaOH or 0.1 M HCl, until the required pH. Preconditioning of the capillary was done daily with 0.1 M NaOH, water, and buffer, respectively, for 5 min each at 100 psi. The temperature was set at 15 oC. Between runs, a pre-wash of 3 min at 100 psi with BGE followed by a 0.6 min capillary filling with the selected cyclodextrin in the run buffer, was always done. Hydrodynamic injection of the sample for 5 s at 0.8 psi was performed. An electric voltage of 20 kV was applied for the separation. The UV detection was performed at 230 nm. Due to the limited water solubility of the benzodiazepines, methanol (10 %) was used to prepare the standard solutions.
The benzodiazepines were screened using a 3 levels, 4 factors fractional factorial design (34-2). It was proved in a previous paper that the 3-levels design was effective and cost saving scheme for the selection of the proper CD [29]. The factors examined were (i) type of CD, (ii) CD concentration, (iii) pH of the background electrolyte (BGE), and (iv) % of organic modifier (methanol, MeOH). The resolution between the R- and S-enantiomers was taken as a response function, which describes the degree of separation in an optimal way. Additionally, the analysis time is considered as a second optimization criterion [30].
Calculations
For each factor three effects were estimated, namely for the intervals between the levels [1, 0], [0, -1] and [1, -1]. Only two of those three effects are independent. Therefore, the following effects were calculated (equation 1 and 2).
in which ΣY(1), ΣY(0), and ΣY(-1) represent the sum of the responses (resolution between enantiómeros, Rs) where the factors x (CD type, % CD, pH and % MeOH) are at level 1, 0 and -1, respectively (Table 1), with “N” representing the number of design experiments [29,31-32] for a 3 levels, 4 factors fractional factorial design (34-2) used here N= 9 experiments. The aim of this evaluation is to select the experimental conditions that lead to the best separation (i.e. the highest resolution) and the equations are based on the well-known procedure for calculating the direct effects for 2-level screening designs [33-36].
Results and Discussion
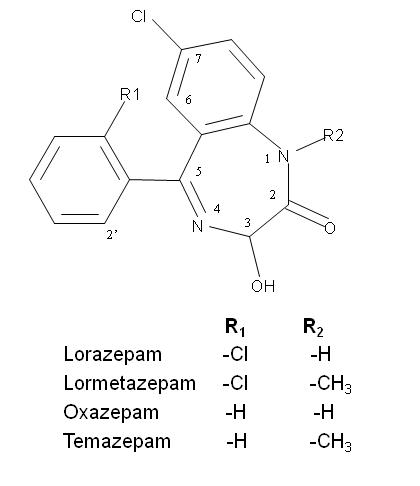
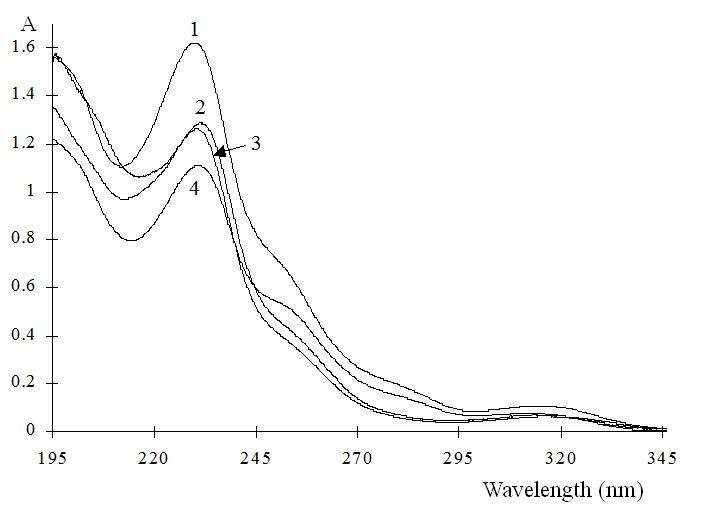
The general molecular structure of the 3-chiral-1,4-benzodiazepines and the absorption spectra are shown in Fig. 1 and Fig. 2 respectively, with an absorption maximum around 230 nm. They are neutral compounds in a wide pH range (i.e. between pH 3.0 to 11.6). This observation can be explained by the fact that most benzodiazepines contain a considerably weak basic imine moiety and, hence, have pKa values ranging from 1.4 to 3.0. Then, in normal free solution capillary zone electrophoresis (CZE) they co-migrate with the electroosmotic flow (EOF). Charged CD’s, such as the sulfated ones, were tested as chiral selectors for benzodiazepines. These chiral selectors are negatively charged compounds and, therefore, the complexes formed migrated toward the positively charged electrode in absence of EOF.
In the first approach, the measurements were performed at low pH (2.5) to ensure cationic form of each analyte hence promoting their interaction with the HSβCD. In these conditions, the EOF is almost negligible. Therefore, when reverse polarity is applied, the unique mechanism that can take the benzodiazepines towards the detector is a complex formation with the anionic CD. A 25 mM phosphate/triethanolamine buffer, pH 2.5 with the addition of 5% HSβCD was used as the run buffer for the separation. Electropherograms of the benzodiazepines measured at low pH are shown in Fig. 3. Separation can be observed in some cases, but bad baseline and peak broadening was observed under these conditions. It should be mentioned that it is not evident to observe separations when the compounds are in the cationic form (pKa 2.95, for both oxazepam and temazepam [37]). For the compounds that are still in the neutral form, (pKa 1.3 for both lorazepam and lormetazepam) 2 peaks can be clearly distinguished.
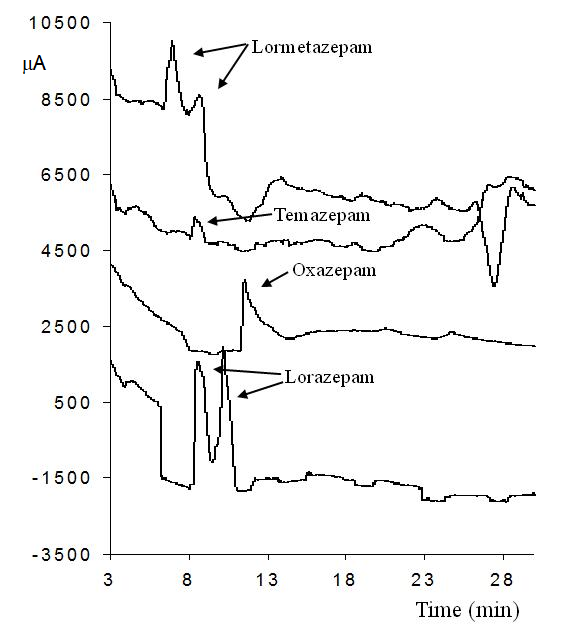
Fig. 3 Electropherograms of the benzodiazepines measured at low pH. Separation conditions: 25 mM phosphate/triethanolamine buffer, pH 2.5 with the addition of 5% HSβCD, hydrodynamic injection 5 s, 8 psi, -20 kV, 15 oC.
The second strategy was to increase the pH to keep the analytes as neutral species, achieving fast and efficient separations. Then, a basic pH using 20 mM borate buffer was applied to measure the benzodiazepines. Experimental results show that when normal polarity is applied in an uncoated fused silica capillary, the strong EOF occurring at high pH (>7) can take the negative complexes towards the negatively charged electrode. Thus, separation and more prominent peak shapes were observed at basic pH range. At pH value below 7, comigration of the analyte-CD complex with the EOF or even zero peaks were observed using normal polarity.
After these preliminary experiments, an experimental design was used to explore the experimental domain to find an acceptable resolution value utilizing the lowest number of experiments. The 3-levels, 4-factors fractional factorial design (34-2) mentioned in the methodology was applied. A subset (fraction) of 9 experiments of the total runs (81) of the complete factorial design 34 was chosen. The selection was made using the randomly arranged design matrix and taking each ninth experiment until completing the nine. The examined factors and levels are shown in Table 1.
The design and the resolution for the series of experiments can be seen in Table 2. The effect of the factors was calculated according to Eqs. 1 and 2 and is shown in Fig. 4. The calculation of the CD type effects for Temazepam is exemplified using the resolution of Table 2. Equations 3 and 4 show the effect (E) between the independent levels [1, 0] and [0, -1], respectively:
Table 2 The 34-2 fractional factorial design and the response (resolution) for the benzodiazepines.
| F A C T O R S | R E S P O N S E (Rs*) | ||||||
|---|---|---|---|---|---|---|---|
| CD type |
% CD | pH | % MeOH | (1) | (2) | (3) | (4) |
| 1 | 0 | 0 | -1 | 0.73 | 1.03 | 0.44 | 0.67 |
| 1 | -1 | 1 | 0 | 0.36 | 0.73 | 0 | 0.59 |
| 1 | 1 | -1 | 1 | 0.69 | 0.73 | 0 | 0.63 |
| 0 | -1 | 0 | 1 | 0 | 0 | 0 | 0 |
| 0 | 0 | -1 | 0 | 0.61 | 0.67 | 0 | 0 |
| 0 | 1 | 1 | -1 | 0.70 | 0.59 | 0 | 0 |
| -1 | 0 | 1 | 1 | 2.72 | 17.5 | 0.47 | 4.72 |
| -1 | 1 | 0 | 0 | 8.82 | 33.2 | 3.09 | 6.37 |
| -1 | -1 | -1 | -1 | 2.88 | 9.57 | 0.87 | 1.38 |
(1)= Temazepam, (2) = Oxazepam, (3)= Lormetazepam, (4) = Lorazepam, Rs = resolution
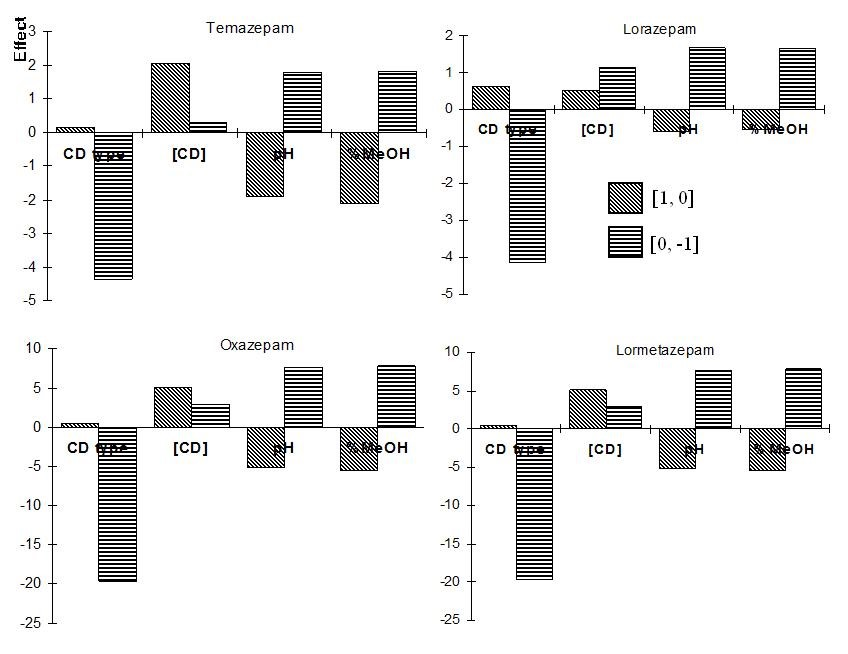
Fig. 4 Calculated main effects from the 34-2 fractional factorial design applied for the screening of the benzodiazepines.
It should be stated that this experimental design is applied to map the experimental domain in as much detail as possible (in nine experiments) with less focus on the calculation of the effects. Given the fact that different CD types are examined in the design and they can have different optimal concentration for each analyte, the calculated effects can be without any practical meaning.
A clear tendency of HSβCD (Table 1, coded as level -1) to improve the compound separation compared to HDMSβCD (level 0) and HDASβCD (level +1) was observed in the experiment No. 8 (Table 2 in bold). Very high resolutions, ranging from 3.09 to 33.2 for the different substances, were obtained in experiment 8 when HSβCD was used as chiral selector. This behaviour can also be observed in Figure 4 (i.e. Temazepam graph), where one of the bars corresponding to the effect [0, -1] for the type of CD has the highest absolute value (-4.37). This means that the use of level -1 (HSβCD) improves the resolution greatly for all benzodiazepines (Figure 4).
The highest CD concentration of 5% (level +1) leads to an increase in resolution for all substances (Table 2, exp. 8) and also can be seen in the effect [1,0] bars for CD concentration that show positive high values for all cases. We cannot conclude, from the design, that the other factors pH and % methanol have a clear influence in the enantiomeric resolution of the benzodiazepines. From the design, we can conclude that experiment 8 gives the best resolutions for all compounds. This experiment is equivalent to the following conditions: 5.0 % HSβCD, pH 9.0 with the addition of 15% MeOH. The electropherograms of the benzodiazepines separation, where they have shown the highest resolution values, can be observed in Fig. 5.
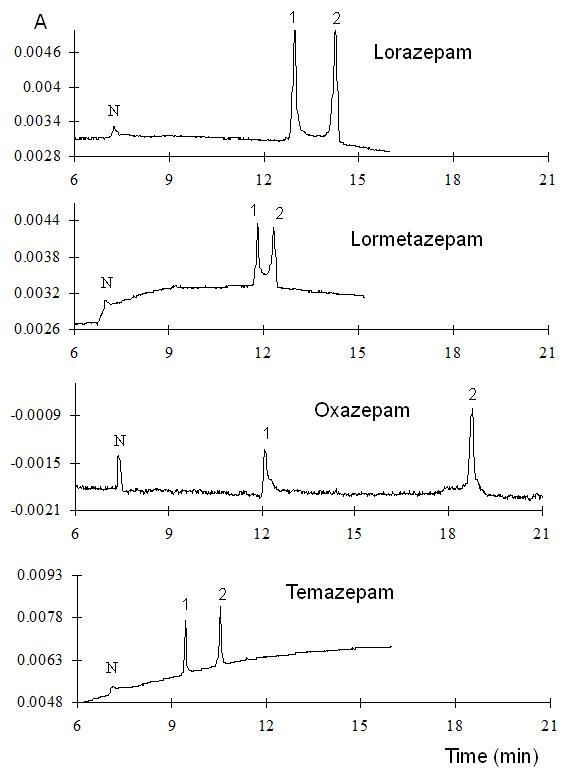
Fig. 5 Electropherograms of the enantiomeric separation of the benzodiazepines at the conditions that the highest resolution values were found. Separation conditions: 20 mM borate buffer, pH 9 with the addition of 5% HSβCD and 15% of methanol, hydrodynamic injection 5 sec, 8 psi, 20 kV, 15 oC.
The interaction between the highly sulfated cyclodextrins and neutral compounds, such as the benzodiazepines, is believed to be based on the hydrophobically driven inclusion complexation. Bergholdt and Lehmann [38] proposed that the extremely high efficiencies obtained using this type of anionic CD can be due to the phenomenon called "stacking" induced by the opposite direction of mobility of these negatively charged CD's to the EOF. Because neutral analytes migrate in the uncomplexed form with the EOF, this is also opposite to the electrophoretic mobility of the anionic chiral selector when fused silica capillary is used. Due to this stacking effect, narrower peaks are obtained, and the mobility of the complexes is reduced allowing sufficient time for the zones to be separated.
It was observed that the addition of methanol up to 15% increases the resolution and migration time of Oxazepam (Table 3). This behaviour could be due to the improvement in the solubility of Oxazepam and to the decrease of the electroosmotic flow with the addition of methanol. This allows the complexes to reduce their mobility, spending enough time in the capillary column to be better separated. The addition of higher than 15% of methanol does not improve the resolution nor the peak height. This is probably due to the analytes peak broadening, due to the excessive increase in migration times until unacceptable values were achieved (Table 3).
Table 3 Effect of the percentage of methanol in the separation parameters for Oxazepam.
| % MeOH | MT 1 | MT 2 | R s | H 1 | H 2 |
|---|---|---|---|---|---|
| O | 8.29 | 12.60 | 32.5 | 250 | 339 |
| 15 | 11.39 | 15.63 | 33.2 | 1031 | 1422 |
| 30 | 19.10 | 28.89 | 33.0 | 1060 | 1427 |
% MeOH = percentage of methanol, MT = migration time (min)
Rs = resolution, H = peak height
Other conditions, as in Fig. 5, except for the variable content of MeOH
The objective of the 3-levels, 4-factors fractional factorial design (34-2), applied here, was not to find an optimal separation but to explore the experimental domain in such a way that one has a good chance of finding a minimum resolution, at an acceptable time, by performing a limited number of experiments (only 9).
Binding constants determination
To study the mechanism involved in the host-guest complex formation of HSβCD with the benzodiazepines, the binding constants of all the analytes with the CDs were determined experimentally. In addition, the knowledge of the binding constants values is very useful to calculate one of the most important parameters for separation: the optimal CD concentration [39-40]. In this way, it will be possible to evaluate the performance of our experimental design to predict the best condition for the separation of the benzodiazepine enantiomers.
A series of eight HSβCD solutions at different concentrations (1.24 mM to 37.9 mM) prepared in 20 mM borate buffer, pH 9.0 with the addition of 15% MeOH, were used as the background electrolyte for the determination of the equilibrium constants of the benzodiazepines host-guest complexes.
It is well known from the literature [41] that the mobility depends on the viscosity of the medium, the ionic strength, and the temperature. The mobilities of the drug-CD complex were calculated and corrected for the changes in viscosity and EOF. The EOF was determined using methanol as the neutral marker which was simultaneously detected at 200 nm. Electrophoretic mobilities were calculated by subtracting the EOF mobilities from the measured mobilities and then corrected for viscosity multiplied by the correction factor, Nx/No, where Nx and No are the viscosities at the ligand concentration [CD] and at free ligand concentration. In this work it was assumed that solute interactions with the wall-bound are negligible, only 1:1 complexation occurs, and no correction in the ionic strength was done. Therefore, conditional equilibrium constants K´ were obtained from our experiments.
As a result, five different HSβCD (1.24, 11.19, 22.06, 32.12, and 37.9 mM) concentrations were measured for viscosity with 1.11, 1.20, 1.26, 1.34, and 1.39 centipoises respectively. A linear (Newtonian) behavior of the CD solution viscosity, as a function of its concentration, was observed (slope 0.0072, intercept 1.1101 and R2 0.9946). Binding constants were determined by CE using the relationship between the CD concentration and the electrophoretic mobility of the analyte. The relationship used in this work (Eq. 3) was originally derived by Kuhn et al [41] to calculate binding constants for lectin-sugar systems and was later adapted by Tanaka et al [42] for enantioselective complexation using anionic CD.
where μf, μCD are the electrophoretic mobilities of the free and complexed analyte, μi, is the solute mobility measured at concentration, [CD]. The equilibrium constant is calculated from the intercept/slope of the linear equation. The advantage of this equation is that it is not necessary to know the value of the maximum mobility of the drug-CD complex which, many times, was observed to be overestimated at high CD concentration [43].
After mobility data were corrected for changes in solution viscosity, caused by changes in ligand concentration and in EOF, they were plotted against free-HSβCD concentration using the double-reciprocal format Eq. 3 (1/μi-μf vs 1/[CD]). Linear equations were obtained from the mobility measurements and they are shown together with the experimental conditional equilibrium constants K´ and the intrinsic selectivity values in Table 4. Good fitting of the experimental data was obtained which confirms the 1:1 complex assumption. It was found that all benzodiazepines possess very weak binding constants to HSβCD. Since K's values are very small, it was necessary to use, experimentally, the highest CD concentration (5.0 %) to obtain the maximum enantiomer resolution for all cases. On the other hand, theoretically, the optimal CD concentration can be calculated according to the relationship proposed by Wren et al. Eq. 4 [39-40] where the CD optimum is equal to the reciprocal of the square root product of the K1 and K2.
Table 4 Liner equations, apparent equilibrium constants and intrinsic selectivity for benzodiazepines.
| Compound Name | Peak | Slope | Intercept | r 2 | K’(M -1 ) | α (K 2 /K 1 ) |
|---|---|---|---|---|---|---|
| Temazepam | 1 2 |
220.2 168.7 |
6117.0 4943.1 |
0.9922 0.9938 |
27.78 29.35 |
1.06 |
| Lorazepam | 1 2 |
117.0 103.4 |
4606.9 4249.5 |
0.9929 0.9925 |
39.39 41.09 |
1.04 |
| Oxazepam | 1 2 |
137.1 51.0. |
5393.3 4610.0 |
0.9878 0.9882 |
39.34 90.40 |
2.30 |
| Lormetazepam | 1 2 |
190.6 177.0 |
6910.9 6791.0 |
0.9981 0.9936 |
37.66 38.38 |
1.02 |
K’ = apparent equilibrium constant
α = selectivity
Using Eq.4 and the obtained conditional binding constants (K’) from Table 4, the CD optimal concentrations calculated were 28.55, 40.23, 59.64 and 38.02 mM for temazepam, lorazepam, oxazepam, and lormetazepam, respectively. It can be observed, that in most of the cases (except for temazepam), the calculated optimal CD concentration is experimentally limited by the Joule heat that can be generated by the high current at CD concentration greater than 37.9 mM (approximately 7%). Therefore, for practical use, it is impossible to utilize those optimal concentrations to perform the benzodiazepines chiral separation. It is preferable to use the highest HSβCD concentration that is experimentally possible (7% instead of 5%) that was found to be most favorable in experiment 8 of the experimental design.
It was detected that, for benzodiazepines, the higher the selectivity for HSβCD the higher the resolution and both decreased in the following order; oxazepam > temazepam > lorazepam > lorazepam (Table 4, Fig. 5).
It should be mentioned that the equilibrium free ligand concentration [CDfree] was approximately the same as the total ligand concentration [CDtotal]. This approximation can be done when [CDtotal]/10 ≥ [analyte] or when the complexation equilibrium constants, K1, K2 are not too large [44], such as in this specific case (see Table 4). In addition, the mobility is influenced by the absorption of the charged chiral selector on the capillary wall as was reported before by Gratz et al [45]. Because they observed that it is a dynamical process, no corrections for absorption were incorporated to the equilibrium constants calculated in this work.
Molecular Modeling Studies
The initial geometry of the HSβCD was based on the βCD X-ray structure, imported from Cambridge Crystal Structure Database [46], with the subsequent addition and optimization of the sulfate groups on the position 6 of the sugar moiety. On the other hand, all the benzodiazepine geometries were obtained by molecular mechanics MMX [47] using the PCMODEL 1.0 software [48]. The subsequent calculations were carried out with the semiempirical method AM1 [49] included in the MOPAC 6.0 software [50].
The conformational analysis of the benzodiazepines was performed by the inversion of the C3 (chiral carbon), as well as the rotation barrier of the bond in the position C5. After minimization of the molecular energy for all structures, 3 stable conformations for oxazepam and temazepam were found, as well as 6 stable conformations for lorazepam and lormetazepam. Only the most stable conformers of the benzodiazepines were used to perform the subsequent calculations.
Two molecular models were proposed to be computed (Fig. 6). First, an inclusion complex where the benzodiazepine interacts with the cyclodextrin cavity, the second one, an external compound interaction with the smallest rim of the CD close to the sulfate groups. Each molecular model was constructed using the more abundant conformations (Table 5). A mathematical model was built using the calculated formation energies for the proposed complexes and the Boltzmann distribution low (Eq. 5).
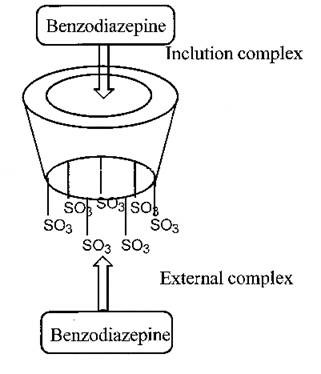
Table 5 Population distribution of the conformations obtained for each enantiomer.
| Molecule | Conformation 1 | Conformation 2 | Conformation 3 |
|---|---|---|---|
| oxazepam | 76.2550 | 19.9043 | - |
| temazepam | 85.1339 | 12.7941 | - |
| lorazepam | 36.2057 39.3498 |
9.5907 9.9167 |
- |
| lormetazepam | 42.4673 42.7656 |
5.7715 6.4393 |
- |
where T is the temperature (25 oC), R is the gases constant, and εi is the energy of the i-th complex. The results obtained, applying the mathematical model, are summarized in Table 6. The energy calculation predicted the elution order of each enantiomer correctly. The calculated stability ratios “αi” (also known as population distribution ratio) for the inclusion complexes have the same tendency as the intrinsic selectivity calculated experimentally (α = K2/K1). The results of the molecular modeling lead to the conclusion that the exclusion complexes are more stable than the inclusion complexes. However, the inclusion complex model reproduces, in a satisfactory way, the tendency of the observed experimental results. It was also observed, in the molecular modeling, that the R benzodiazepine enantiomers have higher superficial interaction with the HSβCD than the S ones. Therefore, it is probable that the first elute should be the S enantiomers.
Influence of the molecular structure
According to these molecular modeling calculations and the molecular structures of the benzodiazepines (Fig. 1), it can be suggested that the most probable interaction characteristic of the benzodiazepines, with the HSβCD, seems to be the inclusion of the aromatic group attached to the C7. The absence of Cl-substitution in R1 would suggest that the HSβCD had higher enantioselectivity for oxazepam and temazepan than with the other compounds. In the case of lorazepam and lormetazepam, the presence of the N1 methyl group could make the HSβCD less enantioselective for lormetazepam than for lorazepam. It is also probable that the hydroxyl group, attached to the chiral carbon (C3), must have a kind of interaction (i.e. hydrogen bounding) with the sulfate groups of the upper rim that can stabilize the complex.
Conclusions
Host-guest interaction with CD was found to be useful for the separation of the enantiomers of the 3-chiral-1,4-benzodiazepines. The use of highly sulfated cyclodextrins as chiral agents provided a net mobility to the formed diasteromers (drug-CD complexes) which allows us to obtain separation. The fractional factorial design of 3 levels was an efficient scheme for the selection of good experimental conditions to obtain high resolutions (between 3.09 and 33.2) with only 9 experiments. The separation of the two enantiomers of the benzodiazepines can take place because there is a difference in the binding constants (K’) between each enantiomer and the chiral selector, as well as a difference between the mobility of the free analyte and the complexed one. Knowledge of binding constants can provide a better understanding of the separation mechanism and, consequently, can help in predicting migration behavior and designing optimization strategies. Molecular modeling studies allow us to conclude that the exclusion complexes are more stable than the inclusion complexes. However, the latter ones reproduce, in a satisfactory way, the tendency of the experimental results observed. The models obtained, through means of these kinds of calculations, can provide us with a good approach on how the analyte can interact with the CD in solution. This showed that the enantiomers of benzodiazepine R have a greater surface interaction with HSβCD than S. Therefore, it is likely that the first eluted peak is the S enantiomer, which is extremely useful when the standards of the pure enantiomers are not available.

