


 nueva página del texto (beta)
 Inglés (pdf)
 Artículo en XML
 Referencias del artículo
 Enviar artículo por email
 Citado por SciELO
  Similares en
SciELO
Similares en
SciELO 
 Permalink
Introduction
The use of dietary selenium enriched supplements is quickly growing associated with the idea of selenium being an essential element to health. However, selenium poisoning was reported not long ago in the United States due to the consumption of an improperly formulated Se supplement [1,2]. Thus, it is clear that to ensure proper selenium intake and consumer confidence and avoid unwanted effects such dietary Se supplements must be guaranteed label claims. The typical criteria for Se-enriched yeast of commercial use is > 60% selenomethionine (SeMet) and < 2% inorganic selenium of the total selenium. As bioavailability and/or toxicity are dependent of chemical species, involved information on the selenium species and their individual concentrations are required to fully evaluate health risk/benefits of a given supplement. In fact, some Se-yeast material has been reported to contain more than 60 selenium species [3], being SeMet the most abundant one. As the bioavailability and/or toxicity of a given element are dependent of its chemical species, information beyond selenium species concentrations is required to adequately evaluate today health risk/benefits of the supplements. That is, in order to ensure proper selenium intake and consumer confidence, selenium dietary supplements must be safe and have the accurate label claims. In this sense, quality control and safety of dietary supplements are a concern for the Government Agencies around the world [4].
Although essential, ensuring the safety of a dietary supplement is not a simple task, in special the determination of chemical species. The most conventional analytical methods for the determination of selenospecies in their supplements involve the enzymatic digestion of the sample, prior to the selenospecies separation by HPLC and the ICP-MS final detection. Thus, the quality control of these products is based on such separation measurement systems and sampling methods that should be robust and validated [5].
In this context, metrology as a measurement science plays a key role to guarantee the reliability of the results concerning the chemical composition of products and foods [6,7].
According to International Vocabulary of Metrology (VIM-2012) [8], calibration is a first step i.e. establishes a relation between the quantity values with measurement uncertainties provided by measurement standards and corresponding indications with associated measurement uncertainties and, in a second step, uses this information to establish a relation for obtaining a measurement result from an indication.
Most methods in analytical chemistry use the linear function as the calibration technique and the least-square method (LSM) is often used to estimate the slope and the linear coefficient [9-13].
However, some assumptions are essential for applying the LSM: (i) errors on the x-axis are negligible if compared with the errors on the y-axis; (ii) the residues from calibration curve are normally distributed; (iii) errors on the y-axis have constant variance over the calibration range (homoscedasticity), and (iv) the errors associated with the different observations are independent.
In addition, assessing whether the mathematical function used for calibration using linear regression is adequate is an important parameter in evaluating the performance of the analytical method, and should enter as a daily task in analytical operations [13-15].
Alternatively, single point calibration is an easy way to ensure the traceability in speciation analysis [15,16], on the other hand, presents some drawbacks: the standard used to quantify must to have similar matrix to the sample, a complete knowledge about the quantification procedure [16], and generally the uncertainty from one point calibration is higher than the multi calibration.
In the world of experimentation and measurement, finding an adequate measurement of the analyte (analyte mass fraction in the sample) and expressing correctly the measurement result is essential task to ensure reliability. The assessment of the quality of the result is provided by the uncertainty of measurement [17]. In practice, the uncertainty of the result comes from several sources, including incomplete definition of the measurand, sampling, matrix effects and interferences, environmental conditions, equipment uncertainties, reference values, approximations and assumptions incorporated in the method and procedure of measurement and random variation [18]. Therefore, in order to provide a more realistic estimation of the measurement, ideally all sources of errors that may influence the measurement result should be considered [19].
Therefore, the objective of this work was to investigate the fast "Single point calibration" method for the quantification of selenomethionine by HPLC-ICP-MS as practical alternative for such daily task, in particular a multipoint calibration curve was investigated, in the range of 0.5-3.5 mg kg-1, and the measurement uncertainty was estimated.
This study is integral part of a work involving the production of a certified reference material of selenium and selenomethione in yeast (Saccharomyces cerevisiae) produced by Inmetro-Brazil
Experimental
Reagents and Materials
Certified reference material (CRM-Selm-1, NRCC) was used to evaluate the method accuracy (calibration curve) and to quantify SeMet by single-standard calibration. Standard of Se-DL-methionine (from Sigma-Aldrich, Dorset-UK) was used to build the calibration curve.
Methanol (Chromasolv for HPLC ≥ 99.9 %, SigmaAldrich, São Paulo-Brazil), acetonitrile (ACN, HPLC/spectro > 99.9 %, Tedia, OH-USA), tetrabutylammonium hydroxide (TBAOH, ≥ 97 %, Sigma-Aldrich, São PauloBrazil) and ammonium phosphate (NH4H2PO4, ≥ 99.5 %, Sigma-Aldrich, Steinhein-Germany) were used as mobile phase reagents.
Protease type XIV from Streptomyces griseus (Sigma, Japan) and lipase type VII from Candida rugosa (Sigma, Japan) were used for selenium extraction procedures.
Nitric acid 65 % (Merck, Darmstadt-Germany) was further purified by sub-boiling distillation in a quartz cell, model Duo-PUR (Milestone, U.S.A.). Type I water with resistivity of 18 MΩ cm from a MilliQ System (Millipore Co., Bedford, MA, U.S.A.) was used to prepare solutions.
The yeast sample was supplied by a national manufacturer. The strain of Saccharomyces cerevisiae was enriched in selenium to a target mass fraction of 2000 mg kg-1.
PVDF syringe filters, pore size of 0.45 µm, were used for filtration of samples (Nova Analítica, Brazil).
Instrumentation
A HPLC system from PerkinElmer, model Flexar (Shelton, USA), was coupled to the Elan DRC II by a EV750- 100-S2 switch valve (Cetac, USA). The HPLC was equipped with a quaternary pump, degasser, autosampler and column oven. An Ion-pair chromatography was performed on a C18 Luna column (150 mm x 2 mm x 3 µm). (Phenomenex, USA). The optimization of ICP-MS was carried out by daily performance check keeping the doubly charged (Ba++) and oxide (CeO+) levels less than 3 % and with higher sensitivity, evaluating the intensities obtained for Mg, In and U.
An analytical balance from Sartorius, model ME 235S (Germany) was used to weigh samples and standards. Other equipment necessary for this work was a pHmeter, MP 230 (Metller Toledo, Switzerland), an AP 56 vortex (Phoenix, Brazil), a shaker thermostat NT 712 (Nova Ética, São Paulo, Brazil), a Z300K centrifuge (Hermle, Germany), an air oven (Nova Ética, São Paulo, Brazil), an ultrasonic bath, model Ultra cleaner 1400A (Unique, Brazil), a Minipuls III peristaltic pump (Gilson, France) and a high pressure asher (HPA-S) (Anton Paar, Austria).
Procedures
Moisture content determination
The moisture content of the CRM SELM-1 and yeast sample was determined by removal of water by heating until constant weight at 105 oC [20].
Extraction procedures of selenium compounds
Extraction of selenomethionine from yeast sample was carried out using enzymatic extraction with Protease type XIV and Lipase, as detailed previously [20]. In brief, approximately 0.2500 g of the yeast sample was weighty in analytical balance in polypropylene flasks and protease solution at 4 mg g-1 was added until total volume of 5 mL. Then, the samples were mechanically shaken for approximately 30 s in a vortex and incubated in shaker thermostat at 200 rpm, during 16 h at 37 °C. After extraction, the samples were centrifuged for 30 min at approximately 2.5 g and the supernatant liquid was filtered through a 0.45 μm filter. The resulting solution was stored at -20 °C and diluted appropriately when analyzed by HPLC-ICP-MS.
Operational conditions of HPLC-ICP-MS
The speciation analysis was carried out by a typical the coupling HPLC-ICP-MS. The separation was achieved in less than 5 min using 0.05 mmol L-1 of TBAOH, 0.5 mmol L-1 of NH4 H2PO4 and 1 % of ACN as mobile phase (≈ pH 6.3) at 0.25 mL min-1. This mobile phase was compatible with the ICP-MS operating conditions.
A solution of 0.5 µg kg-1 103Rh in 2 % HNO3 containing was introduced through a “T” piece, increasing the total flow rate into the nebulizer to 1.25 mL min-1. This Rh solution was used as internal standard and also to minimize the undesirable effects of the mobile phase organic modifier (ACN), including carbon deposits in the injector, cones and other parts of the equipment besides being used as internal standard. The quantification was realized by peak area measurement of the chromatographic intensity ratios of the 82Se/103Rh signals. The specific optimized operating conditions for HPLC-ICP-MS and acquisition parameters are given in Table 1 for the HPLC-ICP-MS system.
Table 1 Operational conditions HPLC-ICP-MS
| HPLC | |
|---|---|
| Column: C18 Luna; Phenomenex | 150 mm x 2 mm x 3µm |
| Pre-column Security Guard, Phenomenex | 4 mm x 2 mm |
| Mobile phase | TBAOH (0.05 mmol L-1); NH4H2PO4 (0.5 mmol L-1); ACN (1 %) |
| Elution mode | Isocratic |
| Flow rate | 0.20 mL min-1 |
| Injection volume | 10 µL |
| Column temperature | 35 ºC |
| Interface | |
| Flow rate (make-up) | 1.25 mL min-1 |
| Internal standard | Rh 0.5 (g kg-1 |
| Nebulizer | Meinhard |
| Spray chamber | Cyclonic |
| ICP-MS | |
| RF power | 1350 W |
| Nebulizer gas flow rate | 0.96 L min-1 |
| Plasma gas flow rate | 15 L min-1 |
| Auxiliary gas flow rate | 1 L min-1 |
| Scan mode | Peak-hopping |
| Sweeps | 1 |
| Readings | 3183 |
| Replicates | 1 |
| Dwell time (ms) | 250 |
| Detector operation | Dual |
| Monitored isotopes | 82Se, 103Rh |
| Signal acquisition | Peak área |
Chromera® speciation software (version 4.0), Perkin Elmer, was used for monitoring both instruments (HPLC and ICP-MS) and the integration of the chromatographic signal.
The method optimization and validation has already been described in a previous work, including extraction procedures, selenium species separation by HPLC-ICP-MS, validation of HPLC-ICP-MS coupling and measurement uncertainty [20]. The analytical parameters of relevance to method validation are presented in the Table 2.
Results and Discussion
Statistical parameters used to evaluate the adequacy of the calibration curve
The multi-standard calibration is the usual scheme for conventional analytical calibration. It is based on the measurement of a calibration standards set, including the blank over the analytical method working range and preparing replicates of each one in an independent way.
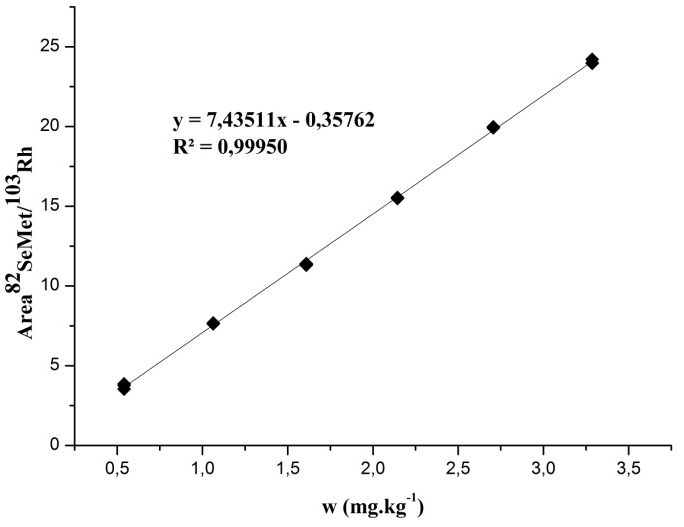
In this work, the multipoint calibration curve was constructed from diluting the aqueous standard of SeMet solution in type 1 water. The mass fraction range studied was from 0.5 mg kg-1 to 3.5 mg kg-1 of SeMet using 82 isotope (82Se).
Fig. 1 shows the graph of the calibration curve, as well as the coefficient of determination (R2) and the mathematical model obtained, where n = 3 for each mass fraction level.
Coefficient of determination
Traditionally, the validation of the straight-line model corroborates that the model is suitable for our purpose. This is usually carried out by checking the coefficient of determination R2. The coefficient of determination (Eq.1 below) is a tool to determine, the linearity of the calibration line and the degree of adjustment of the experimental points to it.
This parameter (R2) provides an estimate of the quality of the calibration curve obtained: the closer to 1, the less the dispersion of the experimental points. As can be seen, the coefficient of determination obtained to quantify SeMet by HPLC-ICP-MS was R2 = 0.99950. However, the evaluation of this single parameter only is not sufficient to ensure that the calibration curve is able to predict with confidence the mass fraction of the sample [12,21,22].
In fact, the additional use of residue graph as tool for visualizing nonlinearity and homoscedasticity and a test to identify the presence of outliers are recommended [13].
Plot residuals
The plot of residuals can be used as tool for visualizing nonlinearity. In these graphs, the residues must have constant variance and be randomly distributed throughout the calibration range. If the residuals increase or decrease proportionally with the increase in x-axis, then the data are heteroscedastic and the use of the weighted regression is indicated. If the data present positive residues followed by negative residues, for example, then the calibration function may not be linear and the adequacy for another mathematical model should be investigated [23]. According to Fig. 2 the residuals of the calibration curve used to determine SeMet, are scattered approximately randomly around zero (

The adequacy of the calibration curve for the determination of SeMet by HPLC-ICP-MS was performed checking the outliers, normality, homoscedasticity, residue independence, lack of fit and regression significance. The significance level used in all these tests was 0.05. (More details can be found at the Supplementary Information Document).
Outliers Standardizing Analytical Methods
The plot of the data should be inspected for possible outliers. In general, an outlier is a result which is significantly different from the rest of the data set. In the case of calibration, an outlier would appear as a point which is well removed from the other calibrations points. The presence of outliers was evaluated by the Grubbs’ test for a single value for each mass fraction level of the calibration curve. The results obtained are shown in Table 3.
Table 3 Grubbs’ test for an outlier value for each mass fraction (w) of the calibration curve in the determination of SeMet by HPLC-ICP-MS
| Replicates | w-1 | w-2 | w-3 | w-4 | w-5 | w-6 |
|---|---|---|---|---|---|---|
| 1 | 3.54 | 7.63 | 11.32 | 15.49 | 19.92 | 23.96 |
| 2 | 3.76 | 7.65 | 11.35 | 15.50 | 19.93 | 23.98 |
| 3 | 3.86 | 7.67 | 11.40 | 15.55 | 19.97 | 24.21 |
| G calc_1(min) | 1.102 | 0.967 | 0.928 | 0.597 | 0.729 | 0.636 |
| G calc_1(max) | 0.850 | 1.030 | 1.059 | 1.154 | 1.140 | 1.153 |
Gcrit (n=3) = 1.155
As can be seen in Table 3, all values obtained for Gcalc are smaller than the Gcrit value indicating that there is no outlier value in the experimental data of the curve and, therefore, no data need to be removed.
Normality of residues
The evaluation of the normality of the residues of the calibration curve is another important test to be performed. When the normality of the residues is not confirmed, regression non parametric is recommended [23].
The normality of the residues was evaluated by the Shapiro-Wilk’s test [24] and the values obtained are shown in Table 4.
Table 4 Shapiro-Wilk test of the residues of the calibration curve obtained in the determination of SeMet by HPLC-ICP-MS
| Normality of residues | |
|---|---|
| Wcalc | 0.920 |
| Wstat | 0.897 |
The value of Wcalc>Wstat, therefore, it can be considered that the residues of the calibration curve come from a normal population.
Homoscedasticity
When using some statistical techniques, such as linear least squares for estimating the unknown parameters in a linear regression model, a number of assumptions are typically made. Assumption of homoscedasticity means that the standard deviations of the error terms are constant and do not depend on the x-value. Therefore, the homoscedasticity of the calibration curve obtained in the determination of SeMet was evaluated by the Cochran's test and the results obtained are found in Table 5.
Table 5 Cochran’s test of the variances of the calibration curve obtained in the determination of SeMet by HPLC-ICP-MS
| Homoscedasticity test | |
|---|---|
| Maximum variance | 2.66E-02 |
| Sum of variances | 4.92E-02 |
| C calc | 0.5411 |
| C crit (n=3; p=6) | 0.6161 |
According to Table 5, Ccal<Ccrit, therefore, it is considered that the variances of the calibration curve are homoscedastic.
Independence of residues
In order to visually evaluate the independence of residues, the graph ei x ei-1 was constructed and the observed results are shown in Fig. 3.
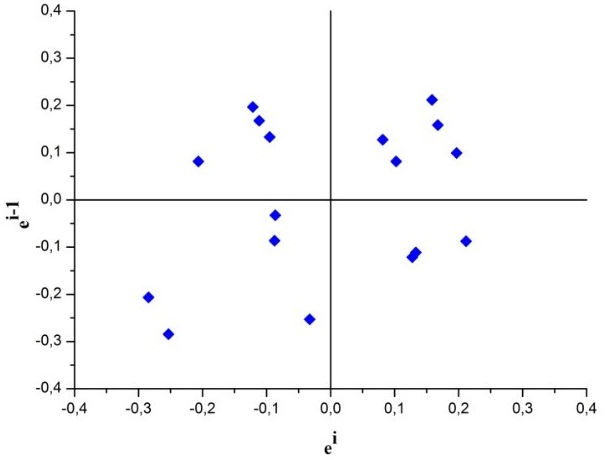
Fig. 3 Residues ei x ei-1 for the visual evaluation of the independence of the residues of the calibration curve for determination of SeMet by HPLC-ICP-MS
According to Fig. 3, the residues presented random behaviour, an indication that the residues are independent.
To evaluate the independence of the residues the Durbin-Watson test [25] was used. The results observed are shown in Table 6.
Table 6 Durbin-Watson test of the calibration curve obtained in the determination of SeMet by HPLC-ICP-MS
| d calc | 1.44 |
| dL (n = 40; k = 1; 2.5 %) | 1.03 |
| dU (n = 40; k = 1; 2.5 %) | 1.26 |
According to results in Table 6, dcalc > dU (1.44 > 1.26) at the same time as (4 - dcalc)> dU (4 - 1.44 = 2.56 > 1.23), no statistical evidence of positive and negative correlation is observed. In others words, residues can be considered independent [25-27].
Lack of fit and significance of regression
Lack of fit and linear regression significance were estimated using the ANOVA test. The obtained results are shown in Table 7.
Table 7 ANOVA test to evaluate the lack of fit and significance of the regression of the linear model of the calibration curve used in the determination of SeMet by HPLC-ICP-MS
| Source of Variation | Sum of Squares (SS) | Degrees of freedom (v) | Mean square (MQ) |
|---|---|---|---|
| Regression (R) | 8.73E+02 | 1 | 8.73E+02 |
| Residual error (E) | 4.38E-01 | 16 | 2.74E-02 |
| Lack of fit (LF) | 3.39E-01 | 4 | 8.49E-02 |
| Pure error (PE) | 9.83E-02 | 12 | 8.19E-03 |
| Total | 8.73E+02 | 17 | 5.14E+01 |
| Lack of adjust significance | Regression Significancy | ||
| MSLF/MSPE | 10.355 | MSR/MSE | 31900 |
| Fcrit-1 | 3.259 | Fcrit-2 | 4.494 |
As can be seen MSR/MSE > Ftab-2 indicating that the regression has statistical significance, on the other hand, MSLF/MSPE > Fcrit-1 indicating that lack of adjust has significance. The test for evaluate the lack of fit is very sensitive to the replicate number and the residues behavior. Considering that all tests used in this work for investigating the curve linearity were satisfactory, we applied the Eq.2 and Eq.3 from González et. al. 2006 as an additional test [28].
where:
SSPE = sum of squares pure error
N = number of calibration standards
n = replicated times
The “r” derivate from Eq.3 is 0.99962 and the value estimated from the calibration curve is 0.99975, indicating absence of lack of fit.
Based on the results of the statistical tests used to evaluate the adequacy of the conventional calibration curve (Table 7), the linear model (estimated by the least squares method) could be used to assess the mass fraction of selenomethionine in the yeast sample in the investigated range (0.5-3.5mg kg-1).
Zero intercept (calibration curve)
In the faster single point calibration, only one standard point is used as reference (instead of several standard calibrations) for fitting a different calibration line.
Thus, the experimental data set of the calibration curve (x, y) to determine SeMet mass fraction were evaluated and the “zero intercept null hypothesis” and the confidence interval for the bias are summarized in Table 8.
Table 8 Experimental data set of the calibration curve (x, y)
|
Mass fraction level y = 7.43511x - 0.35762; R² = 0.99950 |
X (mg kg -1 ) |
y (signal intensity) |
|---|---|---|
| 1 | 0.54100 | 3.72304 |
| 2 | 1.06307 | 7.65025 |
| 3 | 1.60875 | 11.3556 |
| 4 | 2.14389 | 15.51367 |
| 5 | 2.70593 | 19.94057 |
| 6 | 3.28629 | 24.05188 |
Degrees of freedom=n (6-2=4); α=0.05; tα/2=2.7764; intercept bo = 2.365; standard error So = 0.886.
The null hypothesis is accepted if the actual value of the test statistics is between the critical values:
where:
t 0 = t test value
b 0 = intercept
S 0 = standard error of b 0
The critical t-value (α = 0.05 probability) for the zero intercept null hypothesis
In brief, the “null hypothesis of zero intercept” cannot be rejected here as the value of the statistic test [2.365/0.886=2.669] is between the critical values: ±2.7764.
Summary results of the statistical tests
Table 9 summarizes the results of the adequacy of the calibration curve obtained on the range used (0.5-3.5 mg kg-1).
Table 9 Summary results of the statistical tests used to evaluate the adequacy of the calibration curve for the determination of SeMet by HPLC-ICP-MS
| Test | Calculated Value |
Critical Value | Outcome |
|---|---|---|---|
| Outliers (1 value) | 0.636 - 1.154 | 1.155 | No outlier |
| Normality of residues | 0.920 | 0.897 | Normal Residuals |
| Homocedasticity | 0.5411 | 0.6161 | Homocedastic |
| Independece of residues | 1.44 | dL = 1.03 dU = 1.26 |
Independents |
| Lack of adjust | r=0.99975 from equation 1 |
r=0.99962 from equation 3 |
Not significant |
| Regression Significance | 31900 | 4.494 | Significant |
| zero intercept | 2.669 | tcrit = - 2. 7764 tcrit = + 2. 7764 |
Intercept equivalent to zero |
According to obtained data resulting of statistical tests, the single point calibration can be applied to routine analysis in this mass fraction range used (0.5-3.5mg kg-1).
Single point calibration (one standard calibration)
As said in the Introduction, an adequate calibration could be performed from only one calibrant when the following conditions are fulfilled: (i) the calibration function must be linear in the interval of analyte amount ranged from the standard value to zero, (ii) the blank signal must be null in the range studied (iii) the mass fraction of the sample must be within this range (iv) the calibration must be carried out at least in duplicate.
The quantification by single point calibration is carried out using the sensitivity constant (k A ) which is determined using a single standard, measured at least in duplicate. The k A expresses the relationship between the instrumental signal (Ӯstandard) and the quantity of the measurand (xstandard) in the standard solution (Eq. 4).
From the value found for k A , the value of the measurand (xsample) in the sample is determined, Ӯ sample is the mean of the instrumental signal of the measurand in the sample (Eq.5).
Of course, when applying k A to other values of the measurand, it is necessary to assume a linear relation between the signal and the quantities involved.
Assuming the value of k A as single constant along the measurement range can also result in errors in the value of the measurand (it may overestimate the uncertainty of measurement, impairing the quality of the analytical result).
When using this mathematical model, it is necessary to account that any error in the determination of k A affects the value of the measurand. In this vein, this error can be minimized by the remaining standards, when calibration curve (multipoint calibration) is utilized.
In this case, once the calibration curve for determination of Se-Methionine was validated and the linear model (range 0.5-3.5 mg kg-1) was considered appropriate; single point calibration was investigated as a fast method for characterization by value transfer from a CRM to a closely related CRM candidate. In single point calibration, the instrumental response of the measurand in the standard should be close to the instrumental response of the measurand in the sample [29]. Therefore, the weighted sample mass was near of the standard CRM mass weighted (in this case, the values were 0.25419 g and 0.25677 g for sample and CRM, respectively).
The CRM Selm-1 was used to found the k A value and consequently the measurand value, Eq.4 and Eq.5. 103Rh was used as internal standard to minimize the instrumental drift (Table 10).
Table 10 Values used in single point calibration
| CRM Selm-1 | Sample | |
|---|---|---|
| Ratio cps (82Se/103Rh) instrumental replicate (n=7) |
16.93653 | 17.99394 |
| Mass (g) | 0.25419 | 0.25677 |
| Mass of Se - CRM (mg) | 0.81086 | ? |
| CRM: Selm-1 (w: mg kg-1) | 3190 | - |
The measurement factor (k A value) was obtained using the CRM amount with instrumental replicate (n=7).
To carry out the quantification of SeMet on the sample, the k A was used according the Eq.6.
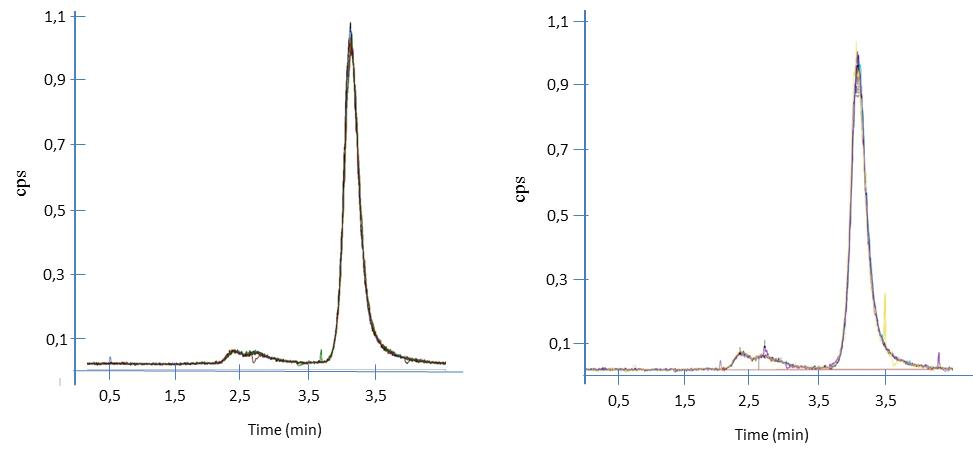
Fig. 4 presents the SeMet chromatogram for seven instrumental replicates (CRM-Selm-1 and sample, respectively) by single point calibration.
Comparison of the measurement results
A comparison of values of the fraction mass wSeMet and of the combined standard uncertainty obtained by calibration curve and single point calibration are found in Table 11.
Table 11 Mass fraction and combined standard uncertainty standard of SeMet
| External calibration Moisture corrected value |
Single point calibration Moisture corrected value |
|
|---|---|---|
| w SeMet (mg kg-1) | 3260 | 3557 |
| Uncertainty: uw(SeMet)(mg kg-1) | 36 | 299 |
* Note: The Supplementary Information Document describes the equations used on the uncertainty measurement
This method, Application Note by European Reference Materials-ERM, compares the difference between the certified and measured values with its uncertainty, i.e. the combined standard uncertainty of certified and measured value [30].
Equation 7 evaluates the agreement among the results, as described below. This equation compares de difference between the values and their uncertainty.
where:
u cal.curve = standard uncertainty of the measurement result
u single point cal = standard uncertainty of the certified value
x cal.curve = mean measured value
x single point cal = certified value
k = coverage factor
In our case,
Therefore, there was good agreement between the value of the SeMet mass fraction obtained by external calibration and value obtained single point calibration.
Conclusions
An evaluation of the adequacy of the calibration curve for SeMet determination by HPLC-ICP-MS was carried out using different statistical tests. For multipoint standardization, the linear adjustment by the least square method was in the mass fraction range of 0.5 mg kg-1 to 3.5 mg kg-1. The methodology was optimized and validated and the figures of merit were fit for purpose.
Once the linearity of the method is assessed, the convenient in routine work single point calibration can be used. Therefore, this developed method was applied to determine the mass fraction of SeMet in yeast Saccharomyces cerevisiae, ensuring reliable, traceable and comparable measurements. The single point calibration method was shown better stability, lower susceptible to drift in long chromatographic runs. In general, this quantification procedure presents the following advantages:
- it is be preferable in routine analysis
- it simplifies slow and laborious stages of preparation of diluting solutions
- it is a quick and sensitive calibration procedure that minimizes time and reagent consumption
- it can provide accurate results if the working range is narrow and the detector response varies with time.
Therefore, the “single point” method investigated here can provide a useful tool to determine SeMet in commercial supplements and foods and it could be extended to quantitative routine speciation analysis for others elements.

