


 nueva página del texto (beta)
 Inglés (pdf)
 Artículo en XML
 Referencias del artículo
 Enviar artículo por email
 Citado por SciELO
  Similares en
SciELO
Similares en
SciELO 
 Permalink
Introduction
The concept of epigenetic is used to refer covalent modifications in DNA, RNA and histones that occur without affecting their main sequence; the major epigenetic modification in DNA is methylation at carbon 5 in the pyrimidine ring of cytosine (C).
The methylation pattern or the global content of 5-methylcytosine (5mC) in DNA fluctuate naturally in the cell in response to intrinsic and extrinsic stimuli during development [1,2]; however, adverse environmental and pathological conditions are able to produce undesired alterations in both, formation of 5mC in specific sequences and the total amount of 5mC in genomic DNA [3]. In particular, global methylation defined as the percentage of methylated cytosines in DNA molecule, has been widely accepted as a biomarker of epigenetic events [4-6].
Epigenetic changes in DNA are important mechanisms in gene expression regulation; cytosine methylation mostly occurs in specific regulatory sequences altering the transcription of genes linked to these arrangements [7]. The presence of methylated cytosine (5mC) in DNA is widespread between fungi, protozoa, plants and animals, though is considered to be absent in many of species such as some invertebrates [8]. Noteworthy, methylation levels in some organisms might remain under the detection limits of the analytical methods actually available and, by improving the analytical performance, new evidence on DNA methylation in these organisms could be provided [9]. The absence of DNA methylation is usually confirmed by the lack of DNA methyl transferases (DNMT), a family of enzymes that catalyze the transfer of a methyl group from S-adenosyl methionine to the cytosine ring [8,10]; nevertheless, DNMT genes are also conserved in species with no evident DNA methylation. Furthermore, DNA methylation has been found in species without obvious DNMT genes [9,11,12].
Several methods have been proposed to determine global genome methylation; among the analytical procedures, application of chromatographic separations provides high selectivity, reproducibility and availability of different detection systems ensuring highly sensitive quantifications [13,14]. The sample processing includes several critical steps; DNA extraction, purification, hydrolysis, and separation of the obtained nucleobase-containing species. Since cytosine methylation occurs also in RNA, sample processing needs to be tightly controlled to avoid any confusion between methylation of two nucleic acids. Depending on the enzyme types used for hydrolysis, the sugar backbone can be preserved (ribose or 2’-deoxyribose) allowing for discrimination between cytosines present in RNA (5-methylcytosine, 5mC) and in DNA (5-methyl-2’-deoxycytosine, 5mdC). In such an approach, exhaustive RNA elimination is dispensable, even though chromatographic resolution of more compounds is required (nucleosides and deoxynucleosides). On the other hand, acid hydrolysis is the most economic and fast method of nucleic acids digestion, moreover, microwave assisted DNA hydrolysis drastically reduces reaction time and increases the digestion yield [15]. Acid digestion degrades nucleic acids to respective nucleobases (cytosine and methylcytosine) therefore this method requires complete elimination of RNA prior to digestion [16]
Separation of the DNA deoxynucleotides or deoxynucleosides is achieved usually by liquid chromatography coupled to a tandem mass spectrometry (LC-MS/MS); when cleavage of nucleobases is carried out, gas chromatography with mass spectrometry detection (CG-MS) seems an attractive alternative in the analysis of global methylation mainly due to the procedural simplicity, short analysis time and low cost [17-20]. In addition, employing a triple quadrupole mass spectrometer (TQMS) in multiple reaction monitoring mode (MRM) allows reduced noise level, eliminating interferences and achieve sub-femtomolar detection limits [16,21,22].
In this work, we propose a procedure for global DNA methylation assessment, based on microwave assisted DNA hydrolysis followed by derivatization of nucleobases with BSTFA:TMCS and GC-TQMS/MS analysis in MRM mode.
Experimental
Microwave assisted DNA hydrolysis. For the selection of conditions of microwave assisted DNA hydrolysis, a multivariate experimental design of Box-Behnken was employed. Three variables were tested in a three levels design; temperature 170, 180, 190 °C, time 5, 10, 15 minutes, formic acid concentration 18.3, 20.9 and 23.5 M. An aliquot (10 μg) of standard DNA from salmon testes was suspended in water and the corresponding volume of formic acid was added to reach a final volume of 1.5 mL; hydrolysis was carried out in a microwave digestion system (Discover SP-D, CEM). The reaction products were dehydrated at 110 °C and stored at - 20 °C until analysis. To evaluate the efficiency of hydrolysis, samples were resuspended in 250 μL of mobile phase C and 5 μL were injected to an Agilent 1200 HPLC-DAD system, using a Kinetex C18 column (150 x 3 mm, 2.7 (m, Phenomenex) with C18 precolumn at 40 °C, with a total flow rate of 0.35 mL/min. The three mobile phases were: A (water), B (methanol), C (ammonium phosphate-acetate buffer 30 mM and 15 mM, respectively, at pH 4.1); and the following elution gradient was applied: 0 min; 69.5% A, 0.5% B, 30 % C, 0-0.1 min; 55% A, 15% B, 30% C, 0.1-5 min; 55% A, 15% B, 30% C, 5-5.1 min; 69.5% A, 0.5% B, 30 % C, 5.1-7 min; 69.5% A, 0.5% B, 30 % C. Re-equilibrium was carried out at the initial conditions for 3 min prior to the next injection. All chromatograms were recorded at 277 nm.
Comparison of enzymatic, acid and microwave assisted DNA hydrolysis. 10 μg of salmon testes DNA were hydrolyzed using a) formic acid 23.5M at 140 °C by 90 min, b) formic acid 20.9 M at 180 °C by 10 min in a microwave digestion system, or c) 1 U of nuclease P1 (Sigma-Aldrich) and 20 U of DNAse I (Sigma-Aldrich) at 37 °C by 12 hours in digestion buffer (acetic acid 200 mM, glycine 200 mM, MgCl2 50 mM, ZnCl2 5 mM, CaCl2 2 mM, pH 5.3). Hydrolyzed products were dried and re-dissolved in 250 μL of mobile phase C. 5 μL of the resulted products were injected in a system HPLC-DAD.
Derivatization conditions. To set-up the derivatization conditions, the nucleobases samples were obtained from the microwave assisted acid hydrolysis. The effect of solvent was evaluated using dilutions of pyridine in acetonitrile and derivatization reagent (without pyridine, 1:10 and 1:20), with 50 μL BSTFA:TMCS 99:1 (Supelco) and the corresponding dilutions were brought to a final volume of 150 μL. Reaction mixtures were homogenized and incubated at 40 °C for 1 hour. Each of the obtained solutions (1 μL) was injected to a gas chromatographer Bruker 456-GC SCION TQ with the separation and detection conditions reported by Tang et al[9]; the selection criterion was as high as possible signals obtained for five derivatized nucleobases.
Detection and separation of nucleobase derivatives by GC-TQ-MS/MS. To establish the separation conditions, 1 μL of the derivatization products were injected to a gas chromatograph Bruker 456-GC SCION TQ. The injector port was set at 250 °C with split 10. Separation was achieved using a column BR-5 (15 m x 0.25 mm, with a film thickness of 0.25 (m, Bruker) and helium at flow rate of 1 mL/min. Column oven was programmed in the following conditions: 100 °C for 0.1 min, 100 °C to 140 °C at 20 °C/min, 140 °C for 3 min, 140 °C to 270 °C at 40 °C/ min, 270 °C for 1.65 min. To set the conditions for the quantification of C and 5mC in MRM mode, 100 fmol of each compound was introduced to the chromatographic system and were exposed to electron impact ionization (70 eV); the most abundant ion (precursor ion) was taken for C and 5mC, respectively, and isolated for collision induced dissociation. The collision energy was varied between 10 and 20 eV, finally 15 eV showed the highest S/N from the product ions.
Calibration procedure. A series of standard mix solutions of cytosine and 5-methylcytosine containing 0, 0.05, 0.10 and 10 μM of each was prepared. 15 μL of each solution were dehydrated and resuspended in the derivatization solution to obtain the corresponding derivate. 1 μL of the final products were introduced in the GC-TQ-MS/MS system yielding injection of 0, 5, 10, 100 and 1000 fmol of each one. This calibration procedure was used to evaluate analytical parameters for each nucleobase of interest. To simplify the determination of percentage of DNA methylation in the real-world samples, calibration was carried out covering different molar ratios of 5mC with respect to C in the calibration set [23]. Specifically, the calibration solutions contained 100 μM of thymidine triphosphate (TTP), adenosine triphosphate (ATP) and guanosine triphosphate (GTP) and cytosines (C+5mC) simulating molar percentages of 5mC with respect to C: 1, 2, 5, 10 and 20. The aliquots (15 μL) of each calibration solution were processed as described above and analyzed by GC-MS/MS procedure. Linear regression function was computed by relating the percentage of 5mC in the solution to the ratio between peak intensities obtained for 5mC and C in MRM mode.
Analyzed samples and DNA extraction. Blood samples were obtained from three different healthy subjects and collected in heparinized tubes. White blood cells were obtained by centrifugation at 2000 g, supernatant was discarded and upper white layer containing leukocytes was collected and stored at -20 °C. Samples of fungi were obtained using fresh spores that were inoculated in YPD medium (1% yeast extract, 2% peptone and 2% glucose) and grown during 24 hours at 28°C and 200 rpm. Cells were collected by centrifugation at 2000 g. Extraction of nucleic acids was achieved using the method reported by Aljanabi and Martinez [24,25].
DNA purification. DNA was separated from RNA utilizing agarose gel electrophoresis. Nucleic acid samples were loaded onto a 1% low melting point agarose (Bio-Rad) gel and run at 70 V by 60 min. Position of DNA bands was determined in reference to the electrophoretic mobility of the same sample in an identical agarose gel stained with ethidium bromide. DNA bands were cut and purified as previously described [26].
Results and Discussion
Microwave assisted DNA hydrolysis. In order to set-up the microwave assisted DNA hydrolysis conditions, first we used HCl to perform hydrolysis assisted by microwave accord to the conditions proposed by Marrubini et al[15], however we obtained better release of nuclebases utilizing formic acid under the classic acid hydrolysis. Then we evaluated the hydrolysis yields for each set of variables in a Box-Behnken design. To do so, the magnitude of analytical signals and the percentages of 5mC with respect to total C (%5mC) were assessed by evaluating the hydrolysis products analyzed by reversed phase HPLC-DAD (see experimental section). In Fig. 1, a typical chromatogram of products obtained from DNA hydrolysis is presented. As shown in table 1, no remarkable differences in C, 5mC yields and % 5mC were founded between treatments, indicating the robustness of procedure within the ranges of temperature: 180 - 190 °C, formic acid concentration: 20.9 - 23.5 M, and time: 5 - 15 minutes. For future experiments, the conditions selected were as follows: 20.9 M formic acid, 190 °C for 5 minutes. In addition, microwave assisted hydrolysis was compared with enzymatic and classic acid hydrolysis, taking this same aliquot of salmon DNA testes in each case. Separations were carried out HPLC-DAD using separation/detection conditions described in experimental section. It can be observed in Table 2 and Fig. 2 that classic acid hydrolysis provided worse release of 5mC, T and A as compared to microwave assisted digestion, whereas C/5mC ratio was in good agreement between MW-assisted acid digestion and the widely accepted enzymatic hydrolysis, confirming that microwave energy improved acid digestion.
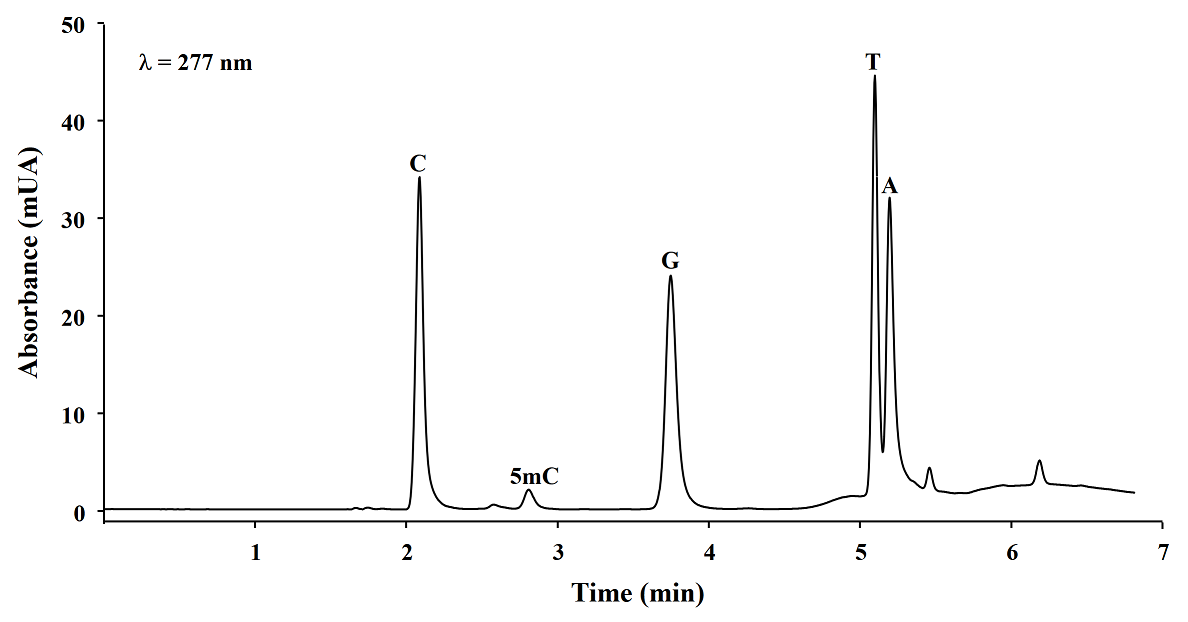
Fig. 1 Representative reversed phase HPLC-DAD chromatogram of microwave assisted DNA salmon testes hydrolysates (C, cytosine; 5mC, 5-methylcytosine; G, guanine; T, thymine; A, adenine).
Table 1 Analytical signals of C and 5mC measured as chromatographic peak height (absorbance at λ=277 nm) and evaluated percentage of 5mC; obtained using different conditions of microwave assisted hydrolysis of Salmon testes DNA.
| Temperature (°C) | Time (min) | [HCOOH] M | C | 5mC | %5mC |
|---|---|---|---|---|---|
| 170 | 5 | 20.9 | 31.49 | 1.89 | 5.67 |
| 190 | 5 | 20.9 | 32.64 | 1.96 | 5.66 |
| 170 | 15 | 20.9 | 32.83 | 1.95 | 5.61 |
| 190 | 15 | 20.9 | 32.28 | 1.93 | 5.65 |
| 170 | 10 | 18.3 | 32.84 | 1.91 | 5.50 |
| 190 | 10 | 18.3 | 32.77 | 1.97 | 5.66 |
| 170 | 10 | 23.5 | 31.42 | 1.89 | 5.67 |
| 190 | 10 | 23.5 | 32.50 | 1.95 | 5.65 |
| 180 | 5 | 18.3 | 33.54 | 1.97 | 5.55 |
| 180 | 15 | 18.3 | 33.02 | 1.99 | 5.67 |
| 180 | 5 | 23.5 | 31.39 | 1.89 | 5.69 |
| 180 | 15 | 23.5 | 34.09 | 1.98 | 5.48 |
| 180 | 10 | 20.9 | 35.00 | 1.96 | 5.30 |
Table 2 HPLC-DAD analytical signals (peak height, λ=277 nm) obtained for salmon testes DNA hydrolyzed using three methods of DNA hydrolysis.
| Hydrolysis method | C | 5mC | G | T | A | C/5mC |
|---|---|---|---|---|---|---|
| Microwave assisted | 33.54 | 1.97 | 23.81 | 38.12 | 26.43 | 16.1 |
| Classic acid | 33.24 | 1.76 | 23.12 | 27.43 | 24.72 | 18.4 |
| dCMP | 5mdCMP | dGMP | TMP | dAMP | dCMP/5mdCMP | |
| Enzymatic | 37.32 | 2.31 | 26.52 | 30.37 | 10.99 | 16.2 |
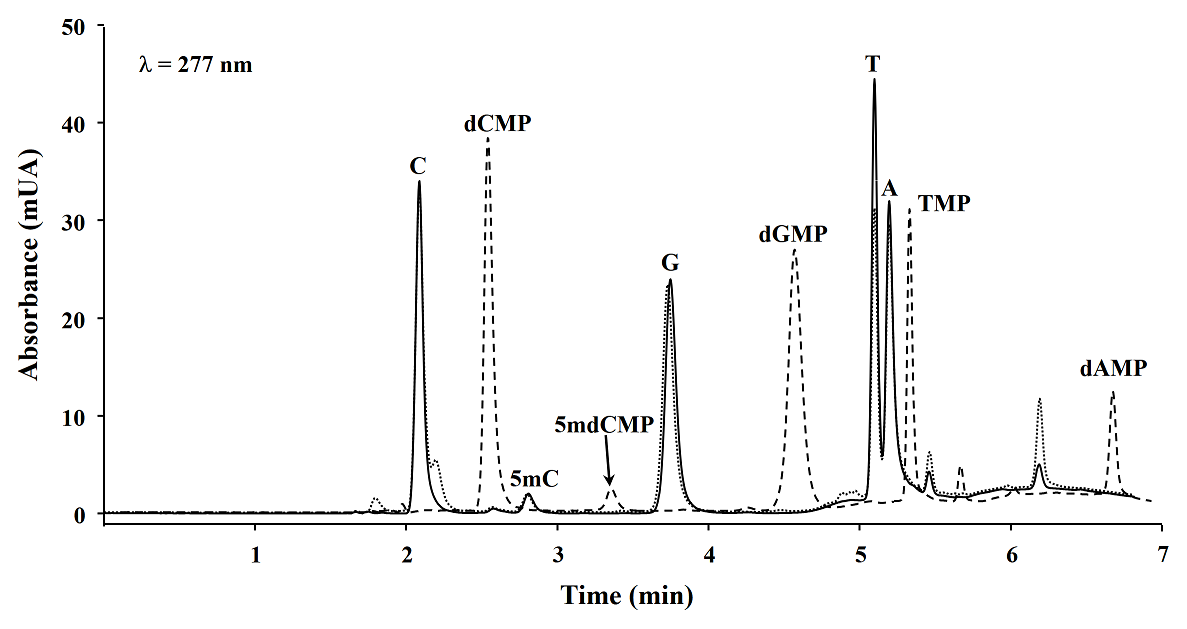
Fig. 2 HPLC chromatograms obtained from three DNA hydrolysis methods: microwave assisted acid hydrolysis (___), classic acid hydrolysis (…) and enzymatic hydrolysis (---). (dCMP, 2’-deoxycytidine 5’-monophosphate; 5mdCMP, 5-methyl-2’-deoxycytidine 5’-monophosphate; dGMP, 2’-deoxyguanosine 5’-monophosphate; TMP, thymidine 5’-monophosphate; dAMP, 2’-deoxyadenosine 5’-monophosphate).
Derivatization conditions. Derivatization conditions were slightly modified from those previously reported [9,17] in order to ensure the highest possible magnitude of analytical signal for each nucleobase.
Using GC-MS system, ions of m/z 255, 240+254, 254, 264, 362 (corresponding to thymine (T), cytosine (C), 5-methylcytosine (5-mC), adenine (A), guanine (G), respectively) were monitored. In Fig. 3 a typical GC chromatogram obtained in selected ion monitoring (SIM) mode and mass spectra are presented for derivatized nucleobases obtained from salmon testes DNA. In table 3 the analytical signals obtained for different derivatization conditions are summarized; the highest analytical signals for C and 5mC were obtained using the reaction mixture pyridine 1:10 in acetonitrile and derivatization reagent BSTFA:TMCS 99:1 (15, 85 and 50 μL, respectively) and this composition was selected for further studies. Pyridine concentration is enough for to get the derivatization products, compatible with GC-MS system and agree with the conditions reported by Rosella et al[17] using MBSTFA as derivative reagent.
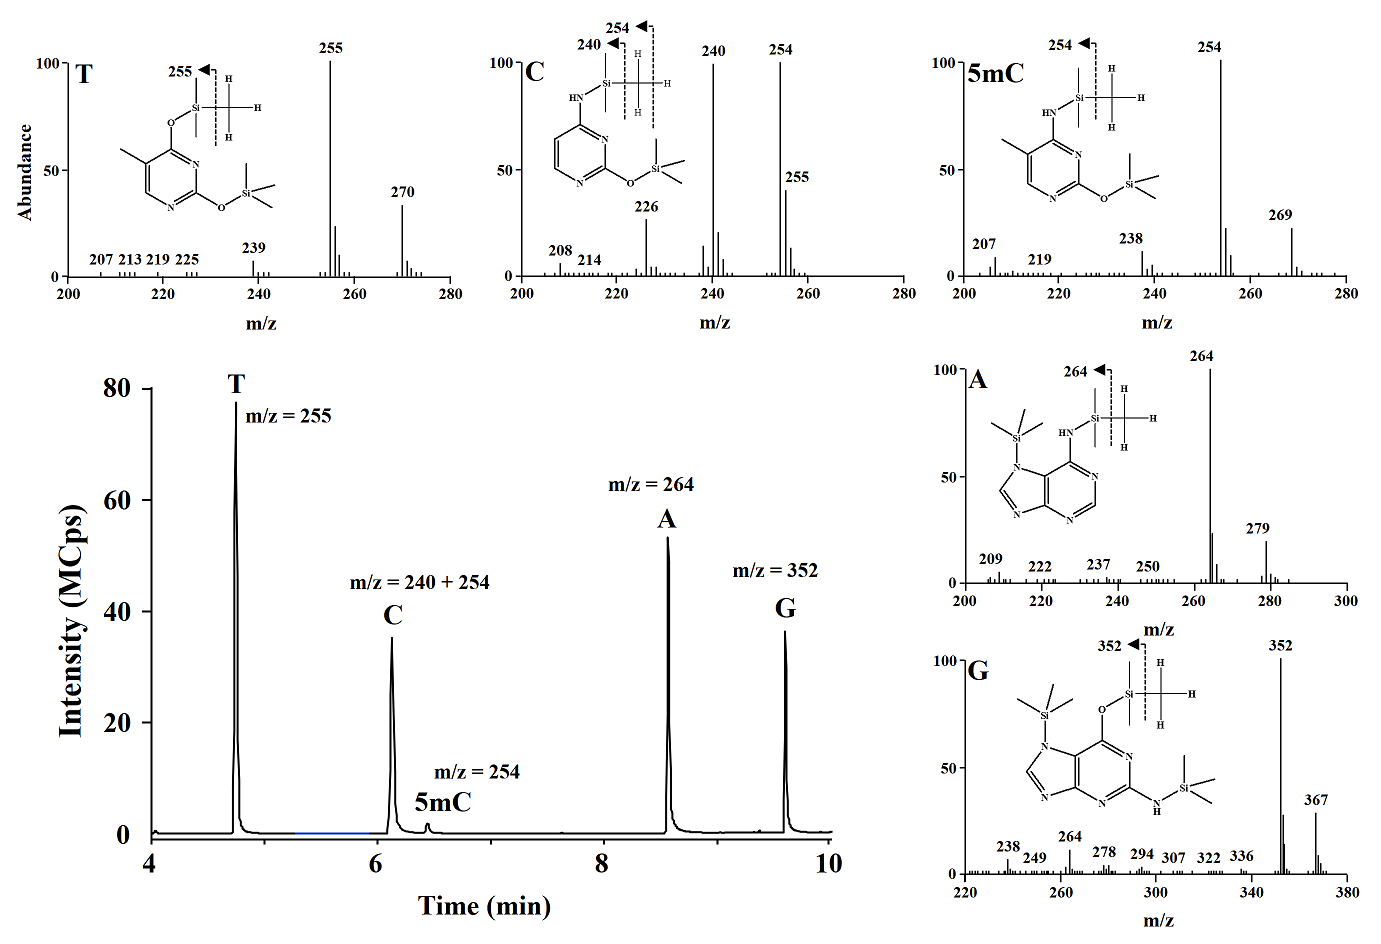
Fig. 3 Typical GC-MS chromatogram obtained in SIM mode and EI-MS spectra of derivatives nucleobases from salmon testes DNA digest.
Table 3 Analytical signals obtained for two nucleobases of interest by GC-MS in SIM mode, upon varyng conditions applied for their derivatization with BSTFA:TMCS (mean values with respective standard deviations are presented based on three replicates).
| Analyte | Monitored ion (m/z) |
Analytical signal (peak area) obtained in each reaction medium | ||
|---|---|---|---|---|
| MeCN+BSTFA | Pyridine (MeCN+BSTFA)1:10 |
Pyridine (MeCN+BSTFA)1:20 |
||
| C | 240+254 | (55.1 ± 0.9) x106 | 75.2 ± 1.1x10⁶ | 73.0 ± 1.1x10⁶ |
| 5mC | 254 | 3.16± 0.05 x10⁶ | 4.26 ± 0.07 x10⁶ | 3.78 ± 0.06 x10⁶ |
CG-MS/MS method. Separation conditions were adapted from the previous study [9]; however we achieved separation of the analytes in 10 minutes by modifying temperature gradient in column oven. The detection conditions in multiple reaction monitoring mode were experimentally selected; as shown in Fig. 3, the most abundant signals (precursor ions) in the mass spectrum obtained after electron impact ionization (EI) for C were m/z 254 and 240, whereas for 5mC it was m/z 254. Fragmentation of precursor ions was achieved using collision energy of 15 eV. In Fig. 4 are presented the products with the highest analytical signal; m/z 238 and 170 (corresponding to precursors m/z 254 and 240 respectively) for C, and m/z 238 and 184 for 5mC, these products were used to evaluate the signal-to-noise ratio (S/N) as a function of the collision energy gradient (10-20 eV); the highest S/N corresponded to the collision energy of 15eV and this energy was used in further work.
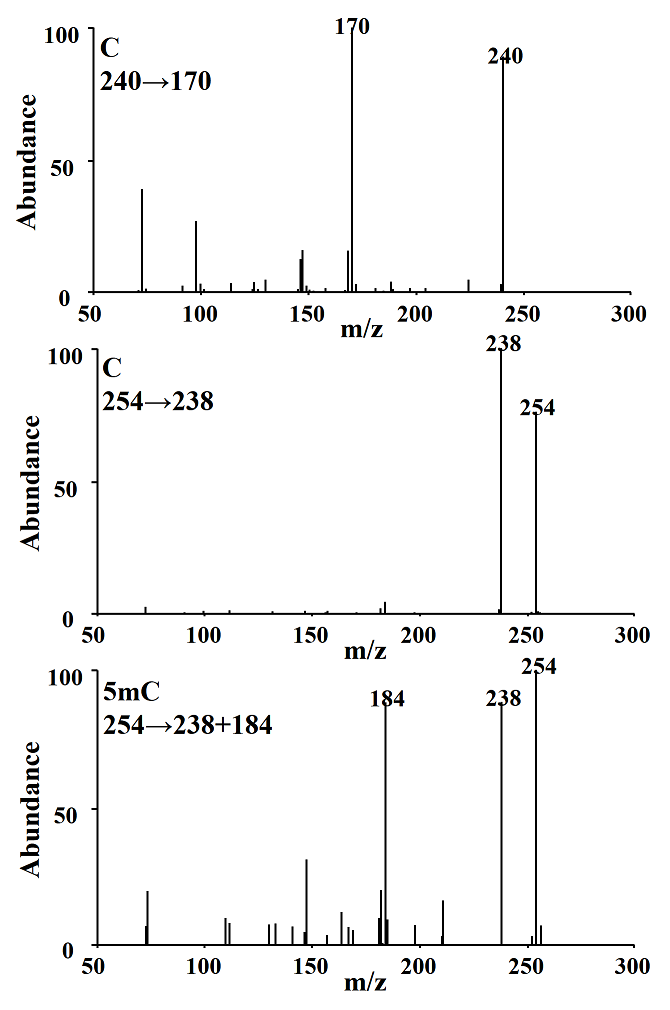
Fig. 4 Product ions obtained from C parent ions 240, 254 m/z and 5mC parent ion 254 m/z using 15 eV collision energy.
Posteriorly using the procedure described above, 5, 10, 100 and 1000 fmol of C and 5mC were analyzed by GC-TQ-MS/MS (Fig. 5), the calibration curve was obtained, and the analytical parameters were evaluated, high reproducibility retention times and low limits of detection (LOD) were obtained for both C and 5mC (0.46 and 0.41 fmol, respectively) as shown in table 4. These LODs are 15 fold more sensitivity than the GC-MS previous report [9] and similar to the obtained with LC-TQ-MS/MS methods [27], and means that this method is able to detect below 0.004 % of methylated cytosines in 50 ng of DNA.
Table 4 Analytical parameters evaluated for C and 5mC in the proposed GC-TQ-MS/MS procedure.
| Parameter | Cytosine (C) | 5-methylcytosine (5mC) |
|---|---|---|
| Retention time (min) | 4.60 ± 0.01 | 5.10 ± 0.01 |
| Sensitivity ( peak area/10 fmol) | 4625.4 | 4991.9 |
| Linearity (R2) | ˃0.999 | ˃0.999 |
| LOD, fmol injected | 0.46 | 0.41 |
| CV, % (5 fmol) | 2.89 | 2.80 |
| CV, % (10 fmol) | 2.83 | 2.71 |
| CV, % (100 fmol) | 1.51 | 1.49 |
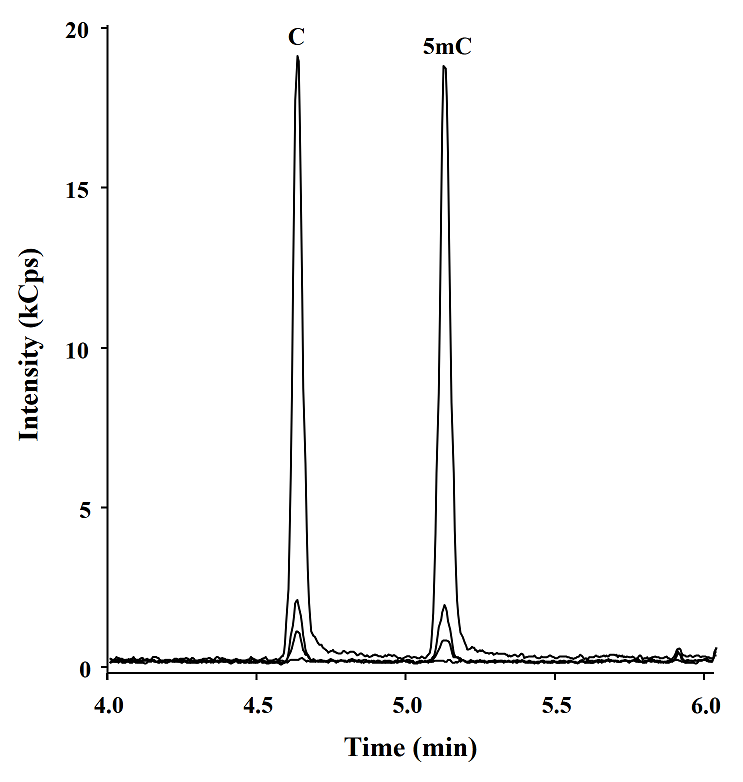
Fig. 5 GC-TQ-MS/MS chromatograms obtained in MRM mode corresponding to 0, 5, 10 y 100 fmol of derivatives C and 5mC.
Determination of global DNA methylation in biological samples. In the first approach, nucleotide mixes simulating 1, 2, 5, 10 and 20 % of 5mC with respect to all DNA cytosines, were subjected to hydrolysis and CG-MS/MS procedure. A calibration curve was constructed relating the analytical signals ratios 5mC/C with the methylation percentage simulated in each calibration mix. The obtained linear regression function was then used to assess percentage of total DNA methylation in the analysis of biological samples.
To avoid RNA- derived 5mC, total RNA was eliminated from the sample extracts by gel electrophoresis. Purified DNA was submitted to MW-assisted acid hydrolysis and analyzed by the proposed CG-MS/MS procedure.
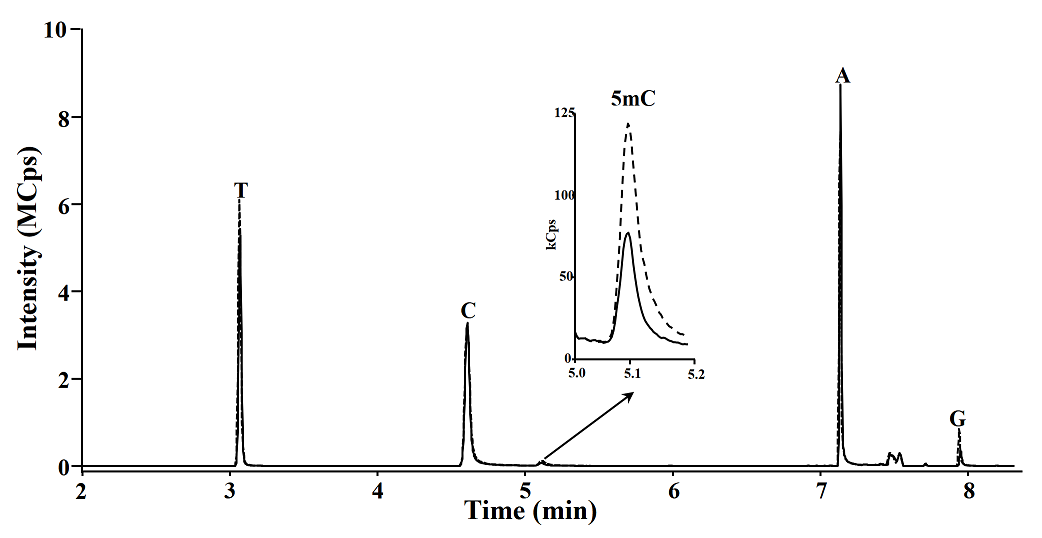
In Fig. 6, typical GC-MS/MS chromatograms of DNA samples in MRM mode are presented for human white blood cells and salmon. Total DNA methylation results are shown in table 5, these data are consistent with some previous reports were obtained for human white blood cells and salmon testes [23] whereas in microorganism extracts, 5mC was not detected. As already mentioned in the Introduction, controversial DNA methylation results has been reported for several fungal species, including those listed in table 5 [9,28]. Application of CG-MS procedure proposed by Tang et al pointed to the presence of 5-methylcytosine in some yeast species of Pichia (0.014-0.041 %), Candida (0.018-0.026%), and Schizosaccharomyces (0.018-0.364 %) as well as in strains of Saccharomyces cerevisiae (0.085-0.128 %) and Yarrowia lipolytica (0.364 %) [9]. In more recent study employing LC-MS/MS method, 5-methyl-2’-deoxycytosine was not detected in any of similar microorganism, [28]. Furthermore, bioinformatics analysis revealed that DNA methyltransferases are absents in Candida albicans, Saccharomyces cerevisiae and Yarrowia lipolytica[11].
Table 5 Global methylation of DNA evaluated on different biological samples utilizing the GC-TQ-MS/MS procedure.
| Sample (DNA) | % 5mC |
|---|---|
| Salmon testes | 7.09 ±0.04 |
| White blood cells | 3.83 ± 0.05 |
| Candida albicans | Not detected |
| Pichia pastoris | Not detected |
| Saccharomyces cerevisiae | Not detected |
| Yarrowia lipolytica | Not detected |
| Sporothrix schenckii | Not detected |
Conclusions
In summary, in this work we developed a robust microwave assisted DNA acid hydrolysis which enabled for reducing the reaction time of the classic acid hydrolysis, the derivatization conditions of nucleobases were adjusted to posteriorly be introduced to a CG-MS/MS system. Our chromatographic method is faster that previous methods using gas chromatography, the high sensitivity of the analytical methodology presented here allows to determine under 0.004 per cent of 5mC in 50 ng of DNA, in addition, the possibility of RNA interference was eliminated with a previous DNA purification. The proposed procedure is capable of detecting as low global DNA methylation as 0.004 % of 5mC, nevertheless we did not detect cytosine methylation in samples from Candida albicans, Pichia pastoris, Saccharomyces cerevisiae, Yarrowia lipolytica or Sporotrix schenckii, suggesting absence of methylation on these species (table 5). The procedure developed in this work represents an excellent alternative to LC-MS/MS analysis.

