


 nueva página del texto (beta)
 Inglés (pdf)
 Artículo en XML
 Referencias del artículo
 Enviar artículo por email
 Citado por SciELO
  Similares en
SciELO
Similares en
SciELO 
 Permalink
Introduction
Cyanobacterial blooms in eutrophic lakes and other freshwater bodies present a significant public health hazard across the world [1]. The frequency of cyanobacterial blooms in lakes and reservoirs in the Pacific Northwest (PNW) has increased during the last decades and blooms impact the use of recreational waters. Several major drinking water reservoirs have reported blooms during the recent years. Factors that drive bloom formation are the availability of excess nutrients, higher water temperatures, and hydrologic and weather-influenced changes that result in less-mixed and slower-flowing water bodies [2-9]. However, the distribution of toxic cyanobacterial populations and the factors that influence the production of cyanobacterial toxins are less understood. Laboratory toxin assays are increasingly being used as components of routine monitoring programs [6,7,10,11], allowing evidence-based public health and management decisions to be made. In this report, we describe a streamlined method based on high resolution and high accuracy tandem mass spectrometry to confirm the presence of cyanobacterial toxins and assess the toxin levels associated with cyanobacterial blooms.
Microcystins (MCs) and anatoxin-a (AN) are the most prevalently observed cyanobacterial toxins in freshwaters in the Pacific Northwest, the potential producers including the cyanobacterial genera Microcystis, Anabaena, Planktothrix/Oscillatoria, and Aphanizomenon[2,5,11-15]. MCs (Fig. 1a) are non-ribosomally synthesized cyclic heptapeptides [12,13,16] that are structurally diverse, with more than 80 congeners currently described. The general structure of MCs consists of D-alanine (D-Ala) (1), a variable L-amino acid, X (2), D-methylaspartic acid (D-MeAsp) (3), a variable L-amino acid, Z (4), (2S,3S,8S,9S)-3-amino-9-methoxy-2,6,8-trimethyl-10-phenyldeca-4,6-dienoic acid (Adda) (5), D-glutamic acid (D-Glu) (6), and N-methyldehydroalanine (Mdha) (7). The unusual amino acid, Adda in position (5), is present in all so far discovered MCs [11-14,17-20], and is considered as a key structural feature of the MC family of cyanobacterial toxins. The variations of the L-amino acids located in the positions (2) and (4) give the name to MCs, such that LR contains leucine (L) and arginine (R) in positions (2) and (4), respectively. MCs with variable amino acids in positions (1), (3), (6), and (7) have been less frequently observed [17,18,21-23]. The MCs are potent hepatotoxins that cause disruption of liver cell structures proceeding to severe liver damage [2,13,14,24-29]. Sturgeon et al. showed MC-induced liver failure by intrahepatic hemorrhage and necrosis in the rat which received LR by intraperitoneal administration [24].
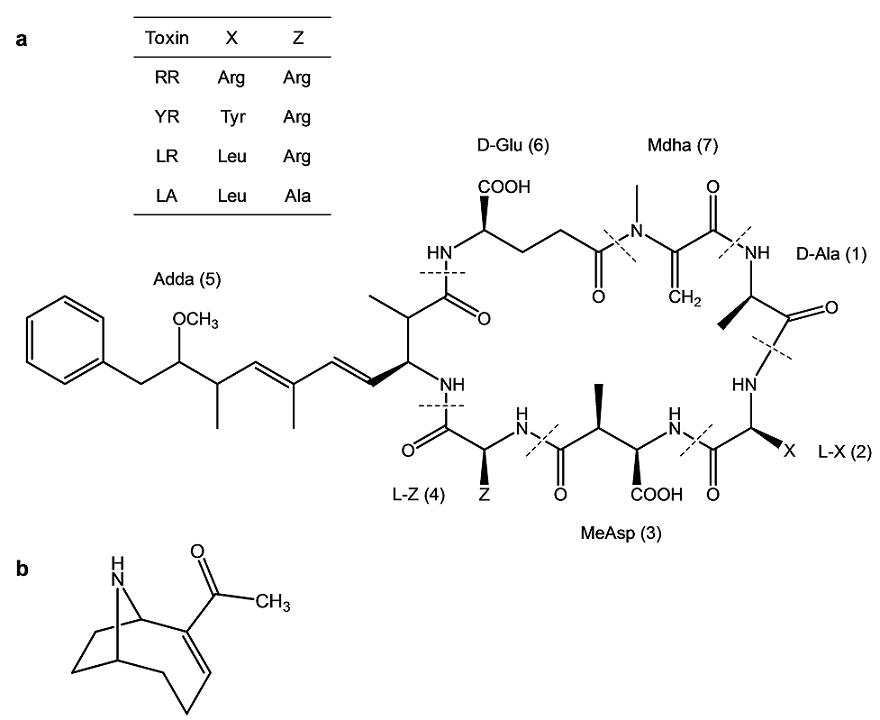
Fig. 1 The general structure of cyanobacterial toxins studied in this work: (a) microcystins (MCs), indicating constituent amino acids of the studied MC variants (table inset); and (b) anatoxin-a (AN).
AN (Fig. 1b) is a neurotoxic alkaloid that is produced by various cyanobacteria, notably Anabaena spp. and Planktothrix/Oscillatoria[2,11,12,30-33]. AN is a potent agonist of nicotinic receptors blocking depolarization and re-initialization of the neurons that causes overstimulation of the muscles, which results in death by respiratory arrest within several minutes[2,30,34]. AN ingestion has been linked to dog deaths in California [31].
A wide range of analytical techniques has been used to monitor cyanobacterial toxins in environmental matrices [35]. Such methods include bioassays [12,36,37], chromatographic methods [1,10,17,18,30,37-40], and immunoassays [10,17,18,31,36,41,42]. In particular, the combination of liquid chromatography and a quadrupole-based mass spectrometer operated in the selected reaction monitoring mode (SRM) is widely used to monitor levels of toxins in complex matrices [10,17,43-49]. Alternatively to the quadrupole-based techniques, two 7hybrid high resolution mass spectrometry systems have been used for qualitative detection and identification of cyanobacterial toxins in environmental samples: (a) Fourier transform (FT)-based mass spectrometers such as the linear ion trap (LTQ)-orbitraps [50,51] and LTQ-FT instruments [18,52], and (b) orthogonal acceleration hybrid quadrupole time-of-flight (oa Q-TOF) mass spectrometers [46,53]. The advantages of high resolution instruments in environmental toxin monitoring are considered as superior accuracy and reliability[54].
In this study, we evaluated a hybrid orthogonal-acceleration quadrupole time-of-flight (oa-QTOF) instrument, namely a TripleTOF 5600 platform, for low level quantification and accurate identification of cyanobacterial toxins in freshwater samples. This Q-TOF platform is a high accurate mass high resolution system that enables information-dependent acquisitions (IDA) and excellent quantification capabilities that have been traditionally associated with SRM analysis on triple quadrupole instruments [55]. The high accurate mass IDA-based MS/MS analyses allowed high selectivity in the measurement of four major MC congeners (namely, MCRR (RR), MCYR (YR), MCLR (LR), and MCLA (LA) and AN in a single analytical run. The combination of UHPLC with high resolution Q-TOF MS/MS enabled rapid chromatographic separation, facilitating throughput, while simultaneously allowing the acquisition of high resolution accurate mass data for precursor ions and fragment ions, thus increasing the confidence in the detection and quantification of cyanobacterial toxins in freshwater samples without preconcentration by solid-phase extraction as previously reported [55,56]. The method was also applied to the detection of cyanotoxins in single colonies isolated from samples obtained from freshwater bodies with blooms.
Experimental
Materials and chemicals
The following certified standard compounds were purchased: microcystin-RR (RR), microcystin-YR (YR), (+) anatoxin-a (AN), and phenylalanine (Phe) from Sigma-Aldrich (Allentown, PA); microcystin-LR (LR) from Abraxis (Warminster, PA); and microcystin-LA (LA) from Enzo Life Science (Farmingdale, NY). HPLC-grade water and acetonitrile were supplied by J.T. Baker (Deventer, Holland). Other chemicals and solvents were HPLC-grade from J. T. Baker (Deventer, Holland).
Each stock solution of the toxins was diluted to 100 µg/L with 50% methanol in water containing 0.1% formic acid, and then combined to prepare a standard mixture solution containing the five analytes (RR, YR, LR, LA, and AN). For method development, the standard mixture solution contained also Phe at the equivalent concentration. The working standard mixture solutions were prepared by spiking a blank freshwater with the standard mixture stock solution to concentrations ranging from 0.5 ng/L to 5 µg/L. All standard solutions were stored in the dark at -20ºC. The working standard mixture solutions were prepared prior to experiments.
High resolution high sensitivity UHPLC-Q-TOF MS/MS analysis
The UHPLC separation was carried out using a Shimadzu (Columbia, MD) Nexera LC system with LC-30AD pumps and an Agilent (Santa Clara, CA) Zorbax RRHD C18 column (2.1 x 150 mm, I.D. 1.8 µm) at 40ºC. The solvent system consisted of 0.2% (v/v) aqueous formic acid (A) and acetonitrile (B). The gradient elution of B was performed as follows: a linear gradient of 2 - 12% for 1 min, another linear gradient of 12 - 90% for 2.75 min, and then an isocratic hold at 90% for 0.25 min. Re-equilibrium was carried out at the initial conditions for 2 min prior to the next injection. Flow rate was 500 µL/min and the injection volume was 10 µL.
An AB SCIEX (Foster City, CA) TripleTOF 5600TM mass spectrometer performed the information-dependent acquisition (IDA) in both high sensitivity and high resolution modes. The resolving power was up to 40,000 FWHM (full width at half maximum). The mass spectrometer was equipped with a calibrant delivery system (AB Sciex, Foster City, CA). Mass calibration was automatically performed after every tenth LC-run and the mass accuracy was obtained within 2 ppm unless noted otherwise. Full scan and IDA product ion spectra in high resolution mode were acquired in a mass range of m/z 100-1100 at unit resolution of the quadrupole (Q). The DuoSpray ion source (AB Sciex, Foster City, CA) was operated in the positive electrospray ionization mode and the following settings were used: ion source gas 1, 50 psi; ion source gas 2, 40 psi; curtain gas, 25 psi; gas temperature, 550ºC; and ion spray voltage, 5500 V. The declustering potential (DP) was 30 V.
In the high sensitivity IDA mode, the ion signals of the most abundant and specific product ions were detected with high resolution (>25,000) over the limited m/z range. In this mode, precursor ion selection is performed at unit resolution, and ion accumulation occurred at 10 msec. The selected fragment ion signals were integrated for quantification using MultiQuantTM (AB Sciex, Foster City, CA). The combinations of precursor ions and product ions of each analyte were as follows: RR, 519.789 → 135.081; YR, 1045.534 → 135.081; LR, 995.555 → 135.081; LA, 910.491 → 135.081; and AN, 166.122 → 131.085. Because AN and Phe have the same nominal mass (m/z 166), we also monitored the ion signals for 166.086 → 120.079 to remove misidentification of Phe as AN [10,31,43]. The positive electrospray ion source parameters were as described above. The values for DP and collision energy (CE) for high sensitivity IDA product ion experiment were as follows: DP, 110 V for MCs; and 60 V for AN and Phe; CE, 40 eV for RR; 110 eV for YR; 90 eV for LR; 60 eV for LA; and 80 eV for AN and Phe.
The intra- and inter-day reproducibilities of the method were evaluated by determining accuracies and precisions using two different concentrations of the compounds (0.5 and 5 µg/L) either over a day or three consecutive days, respectively. The precisions were expressed as a percent coefficient of variance (%, CV) of the measured concentration of standards. The accuracies were obtained by the percentage of nominal concentrations of standards compared to observed concentrations. The standard curves were obtained by plotting the peak area (y) of the analytes to the nominal concentration (x) of the analytes in blank freshwater and the linearity of the UHPLC-Q-TOF tandem mass spectrometric product ion monitoring response of these compounds showed >0.998. Blank freshwater matrix suppression was assessed by the recovery percentages from the spiked freshwater samples at two different concentrations (0.5 and 5 µg/L)
Freshwater sample analysis
All freshwater samples were shipped on ice from collecting sites to arrive in the laboratory for processing within 24 hr. On arrival, samples were mixed thoroughly and 500 µL aliquots of a sample were transferred to 1.5 mL microcentrifuge tubes. The samples were frozen by immersion in liquid nitrogen and then thawed in a water bath in the dark. Cells were lysed by freeze-thaw cycles repeated two more times and then the samples were centrifuged at 23K x g for 5 min [10]. Supernatants were removed for UHPLC-MS/MS analysis.
Isolation of Microcystis colonies
The freshwater samples were collected from Willow Creek Reservoir, located near Heppner in northeastern Oregon. Microcystis colonies were isolated from this water sample and washed with sterile water three times in succession. Each colony was examined to detect the presence of contaminants using a microscope (Zeiss Axiophot, Thornwood, NY) at multiple magnifications (100X to 400X). The colonies were suspended in 50 µL sterile water and subjected to three freeze-thaw cycles as described above, followed by centrifugation at 23K x g for 5 min. Supernatants were removed for UHPLC-MS/MS analysis. In parallel, washed single colonies were transferred into 1X BG-11 cyanobacterial culture medium and incubated with 16-hour fluorescent illumination at 25ºC. Successful cultures were obtained from 13 of the single colony isolates (WC59 #1-13). The sample preparation prior to UHPLC-MS/MS analysis of these cultures was the same as described above for lake samples.
Results and Discussion
High resolution Q-TOF tandem mass spectrometric analysis of cyanobacterial toxins
The goal of this study was to design a fast and robust method for accurate quantification of four MCs and AN in freshwater samples by taking advantage of UHPLC-Q-TOF MS. For this purpose, we used a hybrid Q-TOF instrument, i.e., TripleTOF 5600, which is capable of performing high resolution accurate mass measurements of both precursor and product ions. This instrument offers a high sensitivity mode that features sensitivities and dynamic range typically associated with MS/MS-based SRM methods. Most published methods include solid phase extraction (SPE) procedures for the quantification of cyanobacterial toxins in environmental matrices (17, 30, 45, 46, 53). Some intrinsic drawbacks to SPE methods are lengthy processing times, possible degradation during sample enrichment procedure, and extra costs for SPE consumables and internal standards. Our method was designed with no laborious enrichment procedures prior to UHPLC-MS/MS analysis, facilitating time and cost-efficient measurement of MC and AN.
In Fig. 2, UHPLC-QTOF full-scan mass spectra of MC standards are depicted. The mass spectra were acquired using a declustering potential of 30 V to minimize in-source fragmentation. All protonated molecules of MCs were measured with a mass accuracy of <2 ppm and isotopically resolved (Fig. 2a - d) (b, c). The most prominent protonated molecule for YR, LR, and LA was [M+H]+, and RR yielded a prominent [M+2H]2+. AN and Phe have the same nominal mass of [M+H]+ (m/z 166) but were clearly distinguishable by a mass difference of 0.0363 Da at mass accuracies of ≤ 2.6 ppm (Fig. 2e and f).
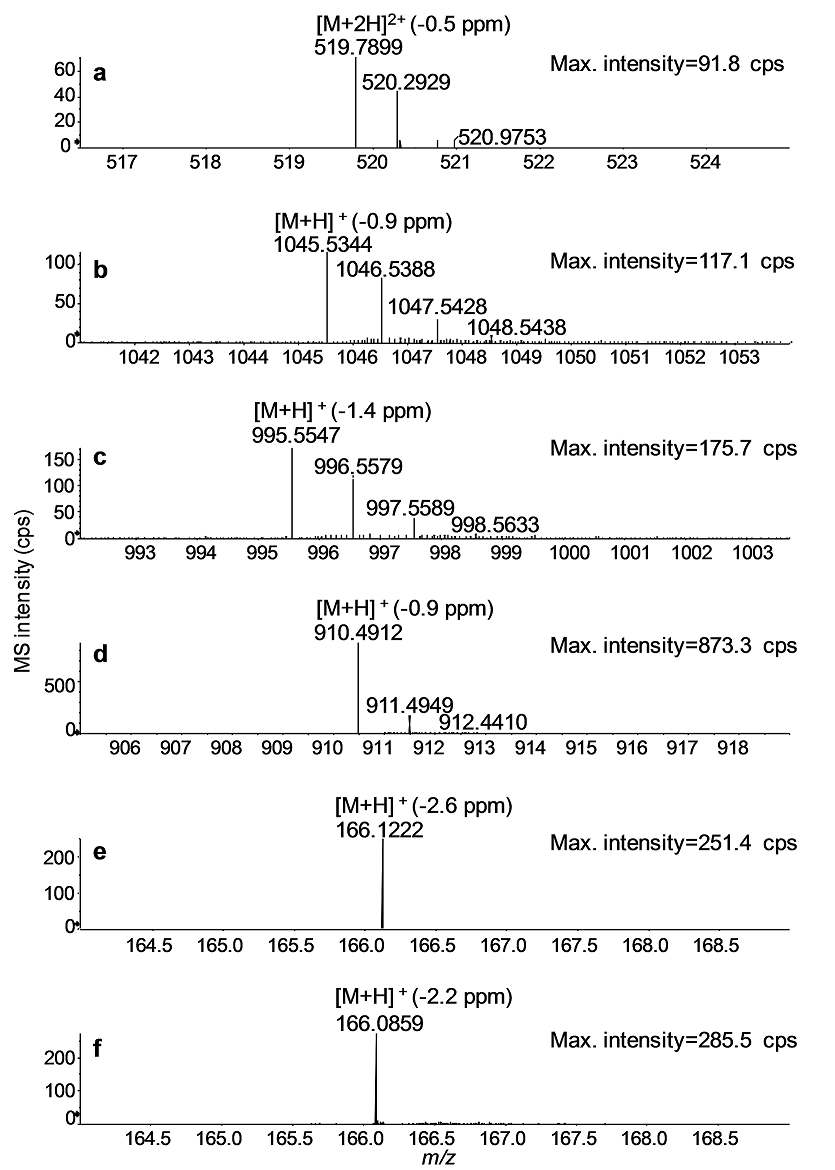
Fig. 2 UHPLC-Q-TOF full-scan mass spectra of the MC congeners: RR (a), YR (b), LR (c), and LA (d); and AN (e) and Phe (f). Mass accuracies for the monoisotopic peak of either [M+H]+ or [M+2H]2+ are given in parentheses.
Fig. 3 shows high resolution product ion spectra and fragmentations of the four MCs. The UHPLC-MS/MS analyses were conducted using a CE = 30 eV for RR and LA and 75 eV for YR and LR at DP = 30 V that were fixed for all analytes. Data acquisition was performed in the high resolution IDA mode and the accurate m/z values of the [M+H]+ of YR, LR, and LA and the [M+2H]2+ for RR were used for extracting the precursor ions and subsequently extracting the product ion spectra of each MC congener. Most of the product ions were identified from elemental compositions that were matched to their observed m/z values within a mass accuracy of <2 ppm. Resolution of the fragment ions was maintained at >25,000 using an accumulation time of 10 ms.
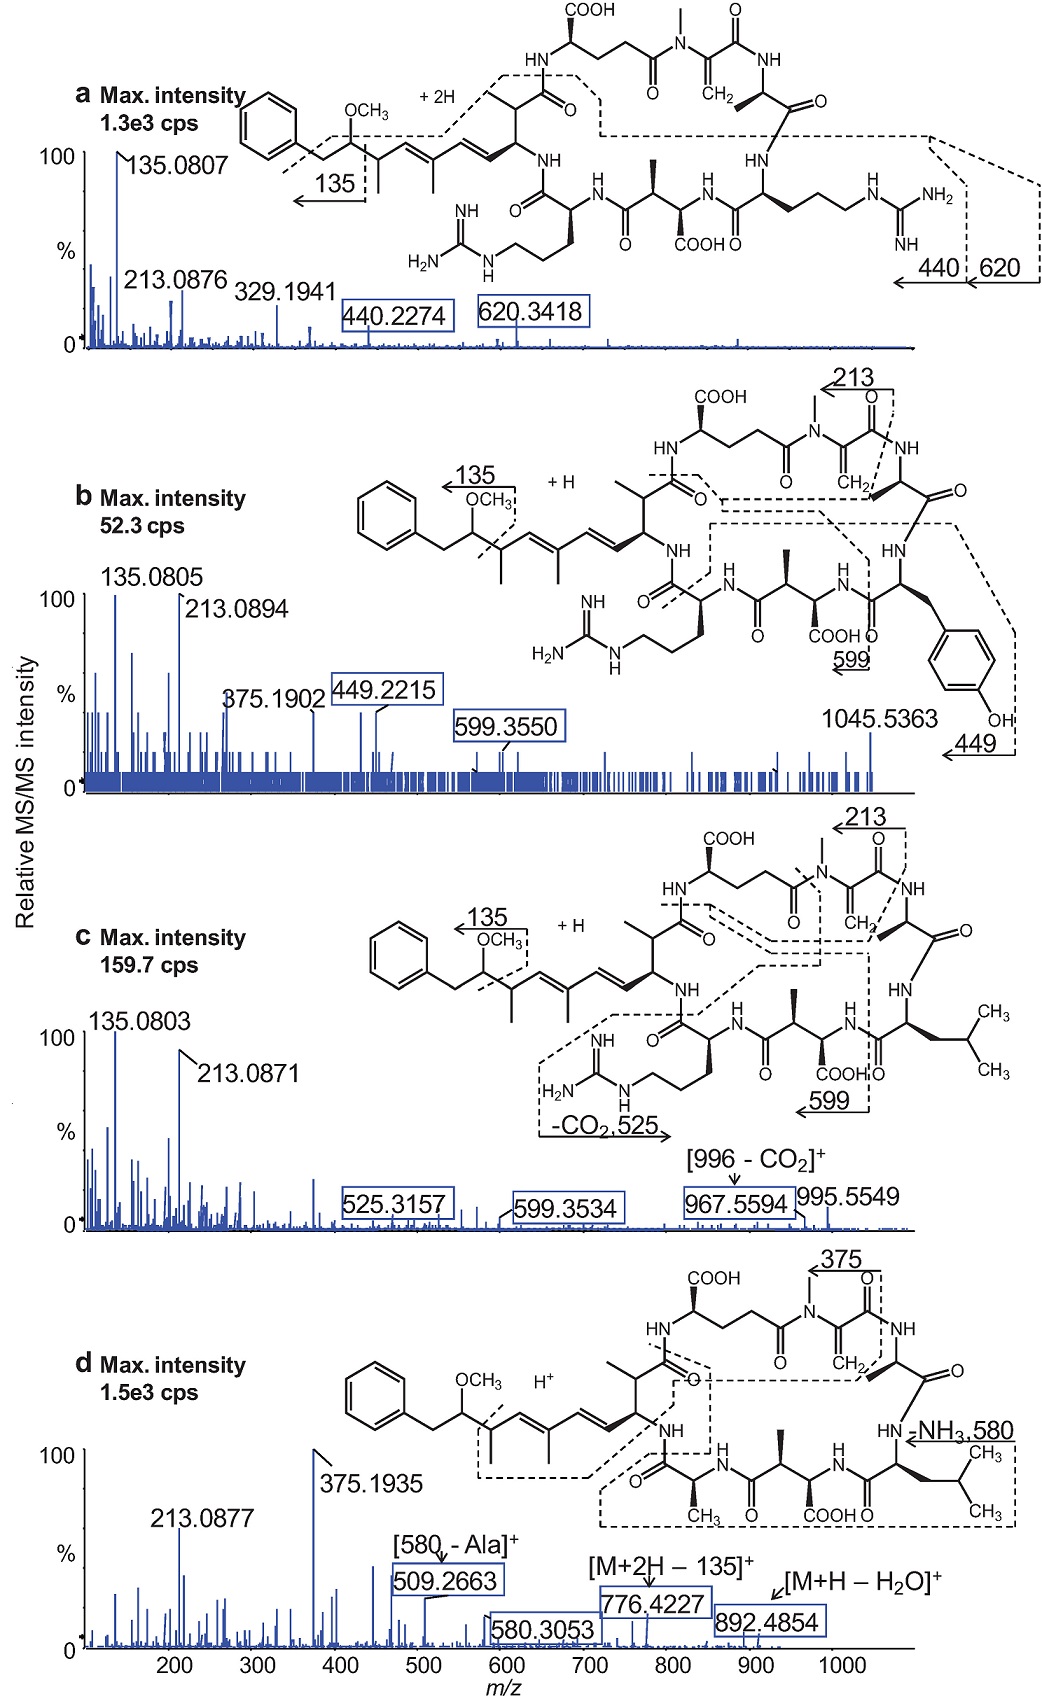
Fig. 3 UHPLC- Q-TOF product ion spectra of the protonated molecules of the MC congeners: RR (a), YR (b), LR (c), and LA (d). The boxed fragment ions contain the amino acids X and/or Z of each MC used for accurate MC identification.
The product ion spectra of all four MCs displayed fragment ions at m/z 135 (dominant), m/z 163, m/z 213, and m/z 375 derived from the constant regions of the cyclic structure of the studied MC variants. In addition, the product ion spectra exhibited characteristic fragment ions containing the amino acids, R, Y, L, and A that are situated in the positions marked X and Z (Fig. 1) of the general structure of the MCs. These fragment ions allowed unambiguous differentiation between the MC congeners.
AN and Phe, a common amino acid abundantly present in environmental matrices, have the same nominal molecular mass (165 Da) and possess similar chromatographic profiles (under the conditions used). The high resolution accurate mass measurement with tandem mass spectrometric (MS/MS) techniques enabled unambiguous determination of AN in complex matrices. The product ion spectra of AN and Phe were acquired with DP = 30 V and CE = 20 eV and shown in Fig. 4. The product ion spectrum of AN contained the fragment ions m/z 149 and m/z 131, and their accurate masses corresponded to loss of ammonia (-17 Da), and subsequent loss of water (-18 Da) from the protonated molecule ([M+H]+, m/z 166.1222), respectively. The low abundant fragment ion, m/z 107, was tentatively assigned as a tripylium ion species generated by further fragmentation of the ion with m/z 131 (Fig. 4a). The product ion spectrum of Phe in Fig. 4b was dominated by the fragment ion at m/z 120. Based on the presence of the minor fragment ion at m/z 103), the fragment ion was produced by either subsequent loss of carbon monoxide (-28 Da) from [M+H - H2O]+ or loss of HCOOH from the protonated molecule ([M+H]+, m/z 166.0858).

Development and Validation of a quantitative UHPLC-Q-TOF MS/MS method
For low-level quantitative analysis, the TripleTOF 5600 instrument was operated in the high sensitivity IDA mode to enhance the signals of the selected fragment ions, m/z 135 (for RR, YR, LR, and LA), m/z 131 (for AN), and m/z 120 (for Phe) (Fig. 5). The optimized UHPLC method enabled the complete separation of all analytes on a single 6-min run. As shown in Fig. 5, the total ion chromatogram (TIC) (Fig. 5b) obtained using a two-segmented gradient program indicates good separation of AN and Phe and improved peak shapes for the MCs compared to a linear gradient without segmentation (Fig. 5a. The computer-reconstructed product ion spectra and extracted ion chromatograms (EICs) of the analytes (b1 - b6) in Fig. 5 were based on the transition of the specific fragment ion and the respective precursor ion of each analyte, shown in small panels in the lower part of Fig. 5.
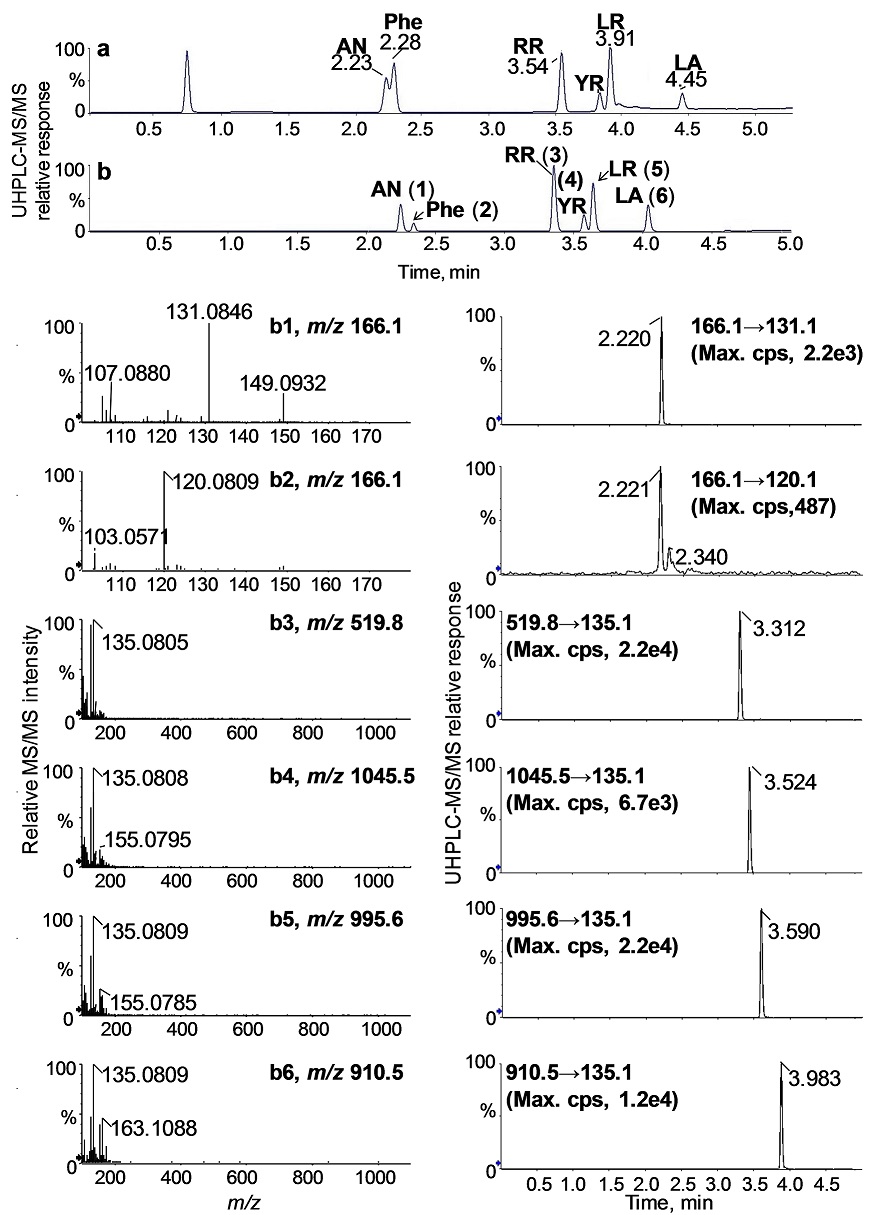
Fig. 5 UHPLC-MS/MS total ion chromatograms (TICs) of a standard mixture containing the studied toxins and Phe obtained using a single linear gradient (a) and a two-segmented linear gradient of 2-90% acetonitrile (b). The product ion traces and the corresponding extracted ion chromatograms were computer-reconstructed from b for quantification: AN (b1), Phe (b2), RR (b3), YR (b4), LR (b5), and LA (b6).
The quantitative study of the UHPLC-MS/MS method was evaluated by triplicate injection of water spiked with the standard mixture solutions either over a day (intraday) or for two consecutive days (interday) with respect to precision, accuracy, sensitivity and recovery. The analytical data are summarized in Table 1. Based on the obtained precisions and accuracies, good reproducibility of UHPLC-MS/MS analyses was achieved for the measurements of the toxins at concentrations of 0.5 and 5 µg/L. The precision of inter-day measurements of LA and YR at the concentration of 0.5 µg/L had higher values than observed for the other compounds, likely due to the lower grade purity of their standard compounds (>95%). The limits of detection and quantification (LODs, LOQs) were evaluated based on signal-to-noise ratio; the criterions of three and ten standard deviations were adopted for LOD and LOQ, respectively. LODs and LOQs of these toxins were between 0.5 ng/L and 50 ng/L, comparable to LODs previously reported for LC-MRM-based methods [57,58]. The standard curves were linear (r > 0.998) over the concentration range of 0.5 ng/L to 5 µg/L for toxins spiked to blank freshwater. Recovery percentage of the spiked freshwater samples was in the range of 91-110% for 0.5 µg/L and 95-103% for 5 µg/L, similar as reported by Li et al.[59]. These results indicate that the developed method provides a suitable dynamic range with sufficient sensitivity to determine the toxins well below the current advisory levels established by the World Health Organization (WHO), which is 1 µg/L for LR, the cyanotoxin of greatest concern in drinking water [2].
Table 1 Intra- and interday reproducibilities and analytical limits of UHPLC-MS/MS measurement on the toxins spiked to blank freshwater.
| Analyte | Nominal concentration, µg/L |
Observed concentration, µg/L |
Intraday 1 | Interday 1 | LOQ
4
, ng/L |
LOD
4
, ng/L |
||
|---|---|---|---|---|---|---|---|---|
| Accuracy 2 | %, CV 3 |
Accuracy | %, CV |
|||||
| AN | 0.50 | 0.51 | 100.73 | 0.62 | 102.34 | 1.79 | 50 | 15 |
| RR | 0.50 | 0.50 | 99.86 | 1.34 | 100.02 | 1.12 | 2.0 | 0.6 |
| YR | 0.50 | 0.54 | 110.22 | 0.48 | 108.02 | 4.56 | 25 | 7.5 |
| LR | 0.50 | 0.50 | 100.94 | 0.69 | 100.98 | 1.27 | 3.5 | 1.1 |
| LA | 0.50 | 0.48 | 91.81 | 1.79 | 96.96 | 4.77 | 5.0 | 1.5 |
| AN | 5.0 | 5.0 | 100.47 | 0.61 | 100.61 | 0.51 | 50 | 15 |
| RR | 5.0 | 5.0 | 99.26 | 0.72 | 100.02 | 0.77 | 2.0 | 0.6 |
| YR | 5.0 | 4.8 | 97.81 | 1.19 | 95.87 | 2.42 | 25 | 7.5 |
| LR | 5.0 | 5.0 | 100.59 | 0.64 | 100.66 | 0.12 | 3.5 | 1.1 |
| LA | 5.0 | 5.1 | 102.61 | 1.19 | 101.67 | 0.11 | 5.0 | 1.5 |
1 Intraday and interday analysis was carried out by triplicate injections of blank freshwater spiked with toxin standard mixtures at each concentration over a day (N=3) and for two consecutive days (N=6), respectively.
2 Accuracy was obtained by the percentage of nominal concentrations to observed concentrations.
3 Precision was expressed as the percent coefficient of variances (%, CV).
4 Three and ten standard deviations were adopted for LOD and LOQ, respectively
Freshwater sample analysis
The toxins were measured in the freshwater samples that were collected at lakes and reservoirs in Oregon (OR), California (CA) and Washington (WA) in the period of June through December 2011. All locations have been repeatedly reported to support seasonal blooms of cyanobacteria. The concentrations of the toxin species determined for the various samples are summarized in Table 2. LR was detected in Golden Gardens Pond (OR), which had a Microcystis bloom through summer 2011, at concentrations between 0.12 and 37.03 µg/L; none of the other congeners were detected in these samples. Low levels of RR, LR and YR were detected in samples taken from Willow Creek Reservoir (OR) and from Tenmile Lake (OR) during the times these lakes were posted for blooms dominated by Aphanizomenon flos-aquae[60]. Anabaena, Microcystis, Oscillatoria/Planktothrix and Woronichinia were also present. The low levels of MC are consistent with observations that Aphanizomenon flos-aquae in Oregon is likely to be non-toxic; this cyanobacterium is harvested from Upper Klamath Lake in southern Oregon as a nutritional supplement.
Table 2 The cyanobacterial toxin concentrations in freshwaters in WA, OR, and northern CA during the period of June through December, 2011.
| Freshwater sample | Toxins (Mean ± S. D.) µg/L, N=3 | |||
|---|---|---|---|---|
| No. | Collecting site (with GPS coordinates) |
Date | Sample name |
|
| 1 | Golden Gardens Pond (OR) (44.0932,-123.1798) |
06-28-2011 | GG10 | LR (0.12 ± 0.01) |
| 2 | 08-14-2011 | GG14 | LR (0.49 ± 0.01) | |
| 3 | 08-10-2011 | GG11 | LR (0.94 ± 0.14) | |
| 4 | 08-10-2011 | GG131 | LR (37.0 ± 1.05) | |
| 5 | 08-28-2011 | GG14 | LR (0.41 ± 0.06) | |
| 6 | Tenmile Lake (OR) (43.5706,-124.1708) |
09-13-2011 | CL1672 | LR 0.77, RR 0.31 |
| 7 | Willow Creek Reservoir (OR) (45.3453,-119.5420) |
9-20-2011 NW corner |
WC59 | RR (0.17 ± 0.02), YR (0.09 ± 0.05), LR (0.02 ± 0.01) |
| 8 | 9-20-2011 Boat ramp |
WC58 | RR (0.27 ± 0.04), LR (0.45 ± 0.04) | |
| 9 | 10-18-2011 | WC60 | RR (0.44 ± 0.59), LR (1.04 ± 0.19) | |
| 10 | Clear Lake (WA) (46.9306, - 122.2744) |
12-21-2011 | WA3 | AN (1391 ± 55.5) |
| 11 | Anderson Lake (WA) (48.0169,-122.8026) |
06-13-2011 | WA2 | AN (0.17 ± 0.01) |
| 12 | Copco Reservoir (CA) (41.9829,-122.3241) |
12-27-2011 | CR132 | AN (0.95±0.37) |
| 13 | 12-27-2011 | CR133 | AN (1.64±0.97) | |
| 14 | Iron Gate Reservoir (CA) (41.9605,-122.4337) |
12-27-2011 | IR75 | AN (0.85±0.07) |
| 15 | 12-27-2011 | IR76 | AN (0.38±0.06) | |
1 Plankton net (concentrated) sample
2 This sample was analyzed by a single injection.
AN was detected at an unusually high level (1391 µg/L) in a 21 December 2011 sample from Clear Lake, south of Puyallup, WA. A sample taken from Clear Lake on the same day was analyzed by King County Environmental Laboratory (Seattle) to contain 1170 µg/L AN [61]. Such high levels of AN in winter are unusual in the PNW. AN was detected at trace levels (0.17 µg/L) in a 13 June 2011 sample from Anderson Lake, south of Port Townsend, WA. King County Environmental Laboratory analysis of a sample taken the same day detected 7.37 µg/L AN and no MC; Aphanizomenon was dominant, with Anabaena sub-dominant [61]. Samples from Anderson Lake have several times contained >100 µg/L AN [61], indicating the presence of a potent producer of this toxin. When this producer is present at low levels and in a patchy distribution, different samples taken on the same day may well contain different levels of toxin.
AN was also detected at low levels (<1.6 µg/L) in samples from two reservoirs on the Klamath River in northern California, Copco and Iron Gate Reservoirs. These winter samples (27 December, 2011) were taken after the collapse of the Microcystis bloom that typically persists through the summer and fall, producing high MC levels. These reservoirs are routinely monitored for MC [6], but we are not aware of previous reports of AN in this system.
In addition, we analyzed Microcystis cultures established from colonies isolated from the Willow Creek Reservoir (20 September 2011 sample). Microcystins have previously been detected in single colonies [62-64]. The toxins in whole cell lysates were analyzed using UHPLC-MS/MS. Based on the quantitative data in Table 3, RR, LR and YR variants of microcystin were present in most samples, in ratios 1:0.36-0.54:0.06-0.15. Similar combinations of RR, LR and YR were detected in LB 2385, a Microcystis aeruginosa culture established from a 1954 collection from Ontario, Canada. RR, LR and YR were also the congeners detected in the lake sample from which the cultures of Table 3 were established (see Table 2, No. 8-9), although the relative congener abundances were different, perhaps reflective of different growth conditions or the presence of MC producers not represented in the cultures. Neither LA nor AN was observed from the extracts of cyanobacterial cell cultures.
Table 3 The toxin concentrations (µg/L, mean ± S. D. N=3) in the culture lysates of cyanobacterial cultures originating from the 9-20-2011 freshwater sample WC59 from Willow Creek Reservoir. MCLA was not detected in any samples.
| Culture sample | Toxins (Mean ± S. D.) µg/L, N=3 | |||||
|---|---|---|---|---|---|---|
| No. | ID | RR | LR | YR | Ratio RR:LR:YR | |
| 1 | WC59-1 | 2.94 ± 1.56 | 1.57 ± 0.69 | 0.24 ± 0.09 | 1: 0.53: 0.08 | |
| 2 | WC59-2 | 1.61 ± 0.89 | 0.58 ± 0.15 | < LOD | 1: 0.36: - | |
| 3 | WC59-3 | 7.14 ± 0.04 | 2.56 ± 0.19 | 0.46 ± 0.11 | 1: 0.36: 0.06 | |
| 4 | WC59-4 | 26.1 ± 1.56 | 9.85 ± 0.13 | 2.50 ± 0.37 | 1: 0.38: 0.10 | |
| 5 | WC59-5 | <0. 0011 | <0.0011 | < 0.0151 | <LOD | |
| 6 | WC59-6 | 1.01 ± 0.21 | 0.64 ± 0.05 | <0.0031 | 1: 0.64: - | |
| 7 | WC59-7 | 16.2 ± 4.39 | 8.75 ± 1.04 | 2.51 ± 1.76 | 1: 0.54: 0.15 | |
| 8 | WC59-8 | 9.65 ± 0.57 | 4.62 ± 0.24 | 0.87 ± 0.12 | 1: 0.48: 0.09 | |
| 9 | WC59-9 | < LOD | 0.42 ± 0.03 | < 0.021 | < LOD | |
| 10 | WC59-10 | 0.56 ± 0.21 | < 0.0031 | < 0.031 | < LOD | |
| 11 | WC59-11 | 46.9 ± 11.3 | 22.0 ± 5.06 | 4.77 ± 1.13 | 1: 0.47: 0.10 | |
| 12 | WC59-12 | 20.2 ± 0.51 | 10.6 ± 0.66 | 2.45 ± 0.58 | 1: 0.53: 0.12 | |
| 13 | UTEX LB 23852 |
6.43 ± 2.22 | 2.49 ± 1.14 | 0.30 ± 0.16 | 1: 0.39: 0.05 | |
1 Detections below the LOQ were confirmed by characteristic product ions as discussed in the text.
2 UTEX LB 2385 is a culture of Microcystis aeruginosa (Little Rideau Lake, Ontario, Canada, 1954; http://web.biosci.utexas.edu/utex/default.aspx).
Single Microcystis colony analysis by UHPLC Q-TOF-MS/MS
As part of an effort to determine which cyanobacterial genera are responsible for production of the toxin species at the sampled sites, individual colonies were isolated from these freshwater samples for further examination. Results for colonies isolated from the Willow Creek Reservoir sample collected on 20 September, 2011 are presented. Following cell lysis, the single colony extracts were split for genetic analysis by polymerase chain reaction (PCR) [65] and UHPLC-MS/MS analysis. Detection and identification of the toxins in these colony extracts was carried out by acquiring product ion full scan spectra. The toxins detected in each colony are summarized in Table 4.
Table 4 The toxins determined in single colonies of Microcistis spp. that were isolated from the 9-20-11 freshwater sample WC59 from Willow Creek Reservoir, OR.
| Colony No. |
Toxins | ||||
|---|---|---|---|---|---|
| Species (Mean ± S. D., N=3), µg/L |
Retention time (min) |
Positive ESI LC-MS/MS product ions (m/z) | |||
| 1 | RR (0.12 ± 0.05) LR (0.11 ± 0.06) YR (<0.01) AN (<0.01, putative) Unknown |
3.3 3.5 3.4 2.1 2.9 |
135, 440, 519 ([M+2H]2+), 620 135, 213,375, 571, 599, 995 ([M+H]+) 213, 269, 375, 587, 1045([M+H]+) 149 (weak), 166 ([M+H]+) 136, 157, 561, 837, 910 |
||
| 2 | RR (0.24 ± 0.04) LR (0.31 ± 0.04) LA (<0.001, putative) Unknown |
3.3 3.5 3.9 2.9 |
135, 440, 519 ([M+2H]2+), 620, 887 135, 213, 553, 967, 995 ([M+H]+) 910 ([M+H]+) 136, 157, 910 |
||
| 3 | RR (1.52 ± 0.52) LR (1.12 ± 0.15) LA (1.85 ± 0.95) YR (<0.01, putative) Unknown Unknown |
3.3 3.5 4.0 3.5 3.3 3.8 |
135, 213, 440, 519 ([M+2H]2+), 620, 887 135, 213, 375, 599, 967, 995 ([M+H]+) 213, 375, 446, 580, 776, 910 ([M+H]+) 1045 ([M+H]+) 201, 710, 910 215, 242, 361, 521, 669, 878, 977, 995 |
||
Each of the isolated colonies was identified as Microcystis spp. by PCR analysis and DNA sequencing of cpcBA and ITS-rDNA gene loci, and the mcyE gene needed for microcystin biosynthesis was also present (data not shown). An example of the toxin detection is presented for Colony No. 3 (Fig. 6; cf. Table 4). The UHPLC-MS/MS chromatogram of No. 3 revealed six intense peaks at 2.3 min (1); 3.3 min (2); 3.3 min (3); 3.6 min (4); 3.8 min (5); and 4.0 min (6) (Fig. 6b). These peaks were identified using a combination of known retention times (Fig. 6a) and product ion spectra of the standard compounds. The mass spectral data confirmed the presence of RR, LR, and LA in Colony No. 3 based on the accurate masses of the characteristic fragment ions: RR (3.3 min (b3): m/z 135, m/z 213, m/z 440, m/z 519 [M+2H]2+ , and m/z 620); LR (3.6 min (b5): m/z 135, m/z 213, m/z 375 m/z 599, m/z 967, and m/z 995 [M+H]+), and LA (4.0 min (b6): m/z 213. m/z 375, m/z 446, m/z 580, m/z 776, m/z 892, and m/z 910 [M+H]+). The peak (b1, 2.3 min) was assigned as Phe, but the peaks (b2, 3.3 min) and (b5, 3.8 min) were not assigned. The protonated molecule, m/z 1045 at 3.5 min was tentatively assigned as YR but due to the low abundance of this species conclusive data could not be obtained (data not shown). These results were consistent with the presence of MC congeners determined in both freshwater samples (see Table 2, No. 8-9) as well as with the toxin species identified in the lysates obtained from the cultures grown from samples from Willow Creek Reservoir (see Table 3).
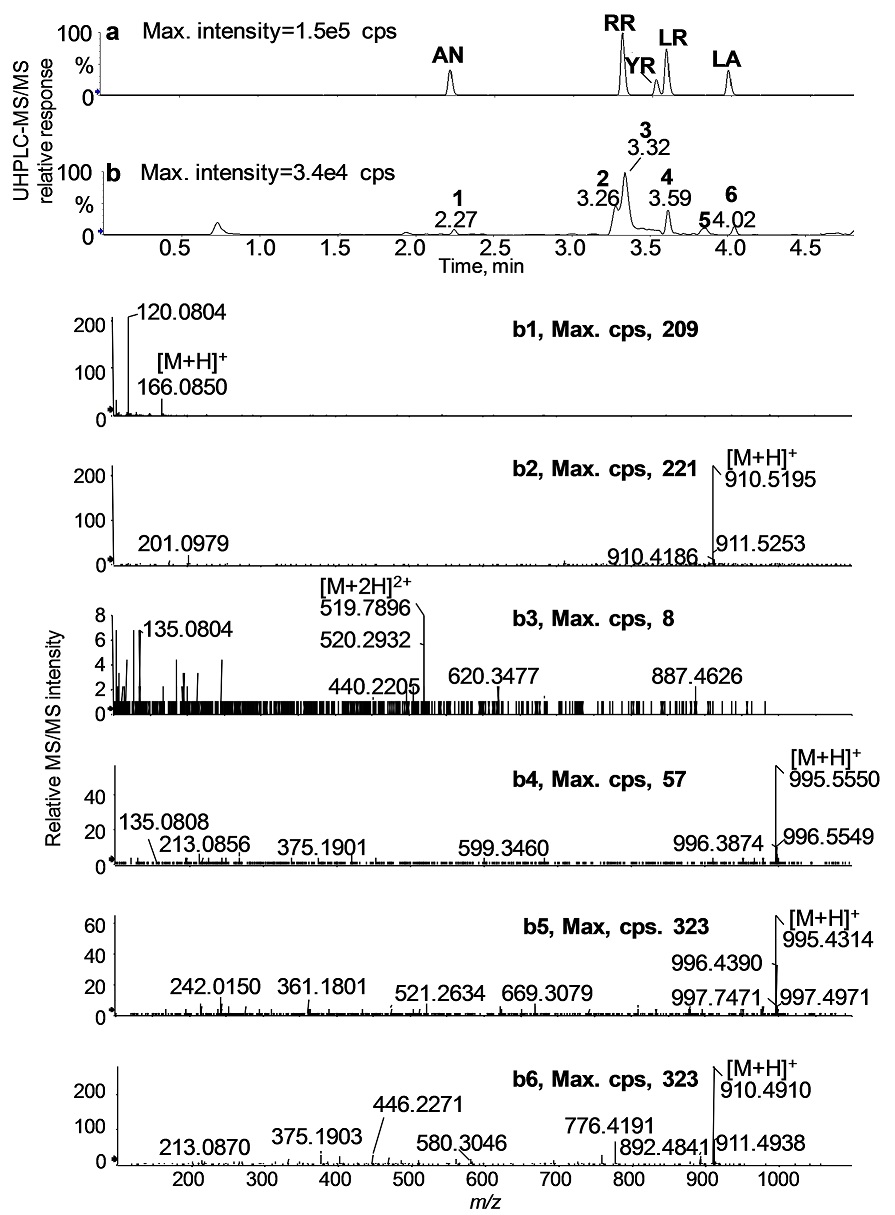
Fig. 6 UHPLC-MS/MS TICs of the toxin standard mixture solution (a) and a single colony extract, No.3 (b). High resolution MS/MS spectra of the six intense peaks (numbered from 1 to 6) in b. By comparison of UHPLC-MS/MS product ion data of the standard mixtures and the colony extract, these peaks were assigned to; Phe (b1), not assigned (b2), RR (b3), LR (b4), not assigned (b5), and LA (b6).
Conclusion
In this study, we describe an integrated method for the accurate quantification with high specificity of five cyanotoxins in PNW freshwater samples using the high resolution accurate mass and high sensitivity capabilities of a relatively new hybrid Q-TOF MS instrument. The method combines fast UHPLC and quantitative tandem mass spectrometry based on information-dependent MS/MS acquisition mode and signal enhancement of specific product ions (in high sensitivity mode). The new method offers low LODs for all four MC congeners (RR, YR, LR, and LA) and AN in environmental matrices without pre-concentration. The validated method had suitable dynamic range and LOD values (<5 ng/L) that enabled the determination of microcystin congeners (RR, YR, LR, and LA) and anatoxin-a >200-fold below the guideline levels established by the WHO for MC-RR and AN in drinking waters [2,30,53]. In addition, the method allowed the quantification of AN with a LOD of 3.5 ng/L, which enables monitoring of this toxin with higher sensitivity than has been reported for other LC-MS-based methods [38].

