Introduction
2,4-D (2,4-dichlorophernoxyacetic acid) is a herbicide and plant growth regulator. [1] It widely used for the control of broad-leaf weeds in agriculture, and for control of woody plants along roadsides, railways, in lawns, playgrounds, golf courses, etc, it is also used as aquatic herbicide. Its commercial formulations include esters, acids, and several salts, which vary in their chemical properties and environmental behaviour. [2,3] However, many scientific studies linked the toxicity of this pesticide to cancer and other health risks such as cell damage, hormonal interference, and reproductive problems.[4,5] So designing of controlled release formulations permits to control the pesticide concentration in the water, soil and plant; In fact, these systems allow releasing it for longer with an appropriate speed and consequently reducing volatilisation, lixiviation and removal of pesticides. [6-8] Otherwise, they minimize the ago-environmental and health hazards.
Microencapsulation and especially the process based on emulsion-solvent evaporation is one of the functional and widely used technique to produce pesticide delivery systems. [9-13] A large category of biodegradable and biocompatible polymeric materials is used and tested for the preparation of pesticide’s carriers such as polyesters, [14,15] polysaccharides which include alginate, starch, cyclodextrin, cellulose and derivatives, [16-18] chitosan and others, [19-23] synthesized, modified and combined materials. [24-26] The recent developed formulations for the 2,4-D controlled release include delivery systems based on organo-zeolite and organo-bentonite complexes, [27] photoresponsive micellar system based on poly(ethylene glycol) [26] and nanosized rice husk.
The present research aims to develop new formulations, fortunately, based on biodegradable materials which permit an initial burst release of 2,4-D followed by a controlled drug release. Indeed, these formulations permit to reach the herbicide efficacy in the initial time of application and to maintain it for longer. Therefore, cellulose derivatives i.e ethylcellulose (EC), cellulose acetate butyrate butyryle (CAB) and hydroxypropylmethylcellulose (HPMC) are selected as biodegradable non-toxic and less expensive matrices for the preparation of 2,4-D controlled release formulations. The chosen cellulose derivatives have not the same behaviour (hydrophilic/ hydrophobic) and in this study, the microparticles are prepared by the combination of these matrices, which were not used previously. This new approach also aims to build design of experiments in order to simultaneously minimize the number of experimental trials and to determine the relationship between process parameters and microparticles’ characteristics, which permit to choose and prepare the desired formulations without additional experiments. In fact, statistical experiment design methodologies are powerful and systemic tools to understand and describe the optimum relationship between the process variables and responses related to the formulation properties and consequently permit to develop an optimized formulation. [28,29]
Three simple 22 factorial designs of experiments (DOE) are used. In the first one (DOE1) and based on our previous research, [10,11] we select also EC as matrix but merged with HPMC; in this case, the studied variables are polymer concentration and stirring speed. The second factorial DOE DOE2 consists to minimize the quantity of dichloromethane (DCM) as organic solvent in the preparation of microparticles based on pure CAB as matrix; the studied variables are the 2,4-D:Polymer ratio and stirring speed. The final factorial DOE3 aims to study and discuss the effect of HPMC in CAB microspheres where the selected variables are the %HPMC in matrix and the 2,4-D:Polymer ratio.
For all the factorial designs, the explored responses are the microparticles ‘size, the drug entrapment and the herbicide release rate. The microparticles are elaborated by the emulsion-solvent evaporation technique and the effects of the variables on the microspheres’ characteristics are evaluated by modeling using Minitab software 16.
Results and discussion
Microparticles characterization
The 2,4-D loaded microspheres are obtained by microencapsulation process where some of process variables are varied according to the chosen factorial design (DOE1, DOE2 and DOE3). A minimum of experiments (4) is carried out for each matrix and factorial design. The microspheres’ characteristics (size and distribution, drug entrapment and release constant KH) related to the experimental conditions are described in table 1, 2 and 3.
Table 1: Experimental factorial design (DOE1) and results of 2,4-D/EC:HPMC microparticles’ characteristics. Matrix EC:HPMC (90:10, w: w); 2,4-D:Pol. (1:4, w:w); solvent=DCM.

Table 2: Experimental factorial design (DOE 2) and results of 2,4-D/CAB Microparticles’ characteristics. Matrix: pure CAB; %/Pol./solv.=4% (w/w%), solvent=DCM/Acetone(80/20:v/v).

Table 3: Experimental factorial design (DOE3) and results of microparticles composed from pure CAB (0% of HPMC) or CAB:HPMC mixture (50% of HPMC) as matrices. Stirring speed =600rpm, %/Pol./solv.=4.16% (w/w%), solvent=DCM/Acetone (80/20:v/v).

The obtained microparticles are characterized using different methods. The results showed that the number mean diameter d10 varied from 61 to 208 µm for the microspheres of the DOE1 and from 25 to 83 µm for microspheres obtained by the second DOE and from 41 to 100 µm for microspheres of the DOE3. Then, a large class of microparticles size is obtained by varying these parameters.
The drug entrapment also varied as a function of the process variables (stirring speed, polymer concentration, initial drug concentration) and the nature of polymer matrix. It ranged between 13.8 and 69.1%; for the microparticles composed from mixture of EC: HPMC, the drug content reached 21%, however for CAB: HPMC micropartilces, the best drug entrapment is obtained and attained (69%). In general, we remarked that the drug content increased using CAB as matrix and improved when HPMC incorporated matrix is used. The drug content also increased when the initial drug:polymer ratio is increased.
The results showed that the encapsulation efficiency (EE) varied from 33 to 77% (table 1, 2 and 3) and the effects of the selected variables on the microparticles’ size and drug entrapment are obviously analysed in data investigation part.
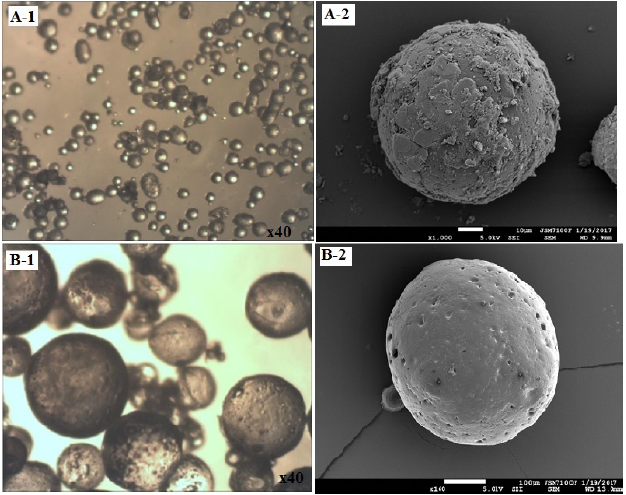
The microspheres’ surface, shape and morphology are examined by scanning electron microscopy (SEM) and optical microscopy. The Fig. 1 showed the results concerning the lots of microparticles 2,4-D/EC:HPMC (DOE1) and 2,4-D/CAB (DOE2). The microparticles appeared with rough and porous surface for both the CAB and the mixture of EC/HPMC as matrices. The microphotographs showed the presence of crystal powder of 2,4-D probably at the surface of microparticles 2,4-D/CAB (Fig. 1, A-2) where the initial ratio of 2,4-D:Polymer is higher. The same remark was noted in our previous paper [11] when 50.66% of 2,4-D was used in the preparation of pure EC and CAB microspheres.
The SEM and the optical microscopy results revealed also that using the same percentage of PVA (0.25%), both when acetone is combined with either to DCM or HPMC merged to EC, the microparticles appeared with a spherical morphology as using pure EC or pure CAB with only DCM as solvent. [11].
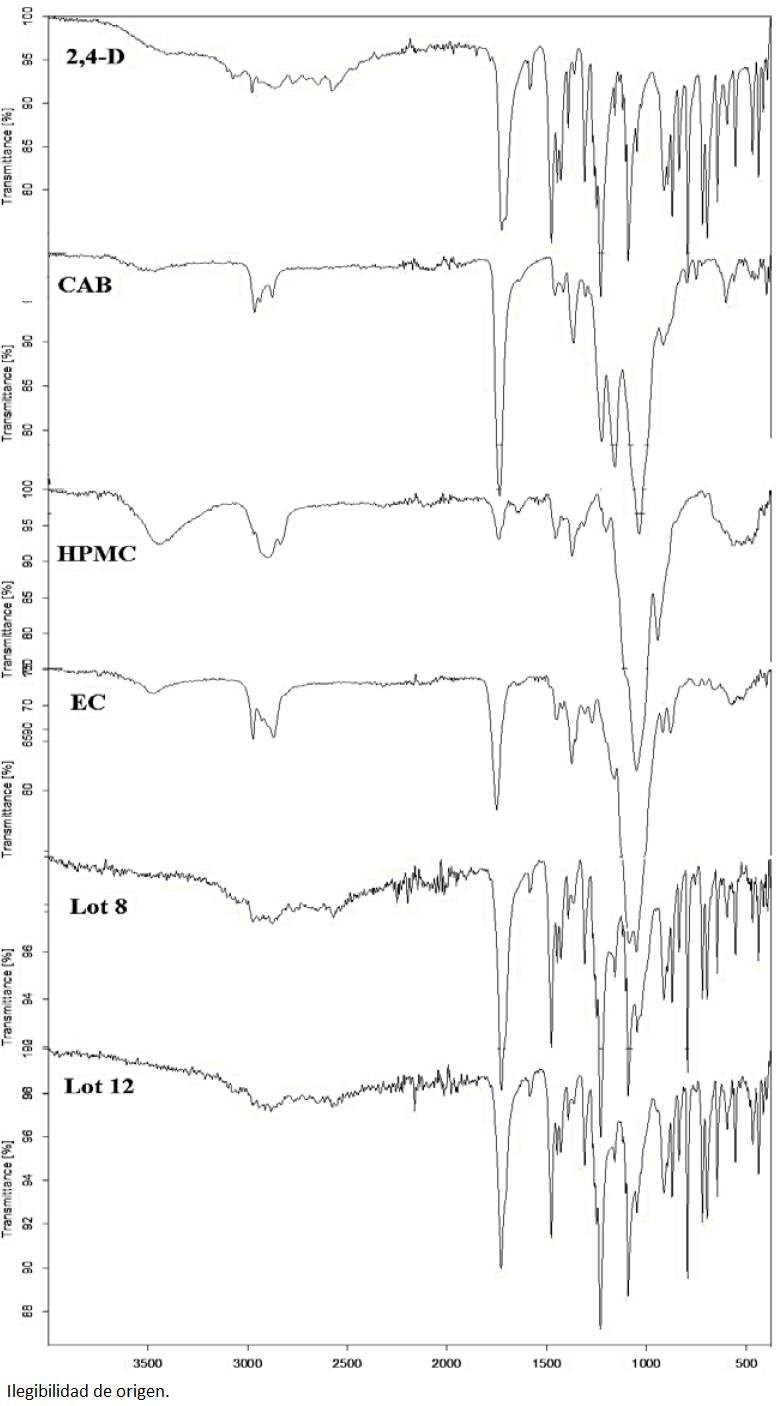
The FTIR analysis confirmed the effective presence of 2,4-D in microspheres. For example, in the Fig. 2, the FTIR spectra of microspheres of lot 16, pure 2,4-D and pure CAB are compared. In fact, the microspheres pattern showed the characteristic bands of 2,4-D; at 1725cm-1 corresponding to carboxylic group (C=O), at 1476 cm-1 corresponding to C=C aromatic ring, at 836 cm-1 for aromatic C-H band and an intense peak at 793 cm-1 corresponding most probably to C-Cl band. Hence, the FT-IR analysis demonstrated the presence of PRX in microparticles with no chemical reaction between the drug and the polymers since no new bands appeared.
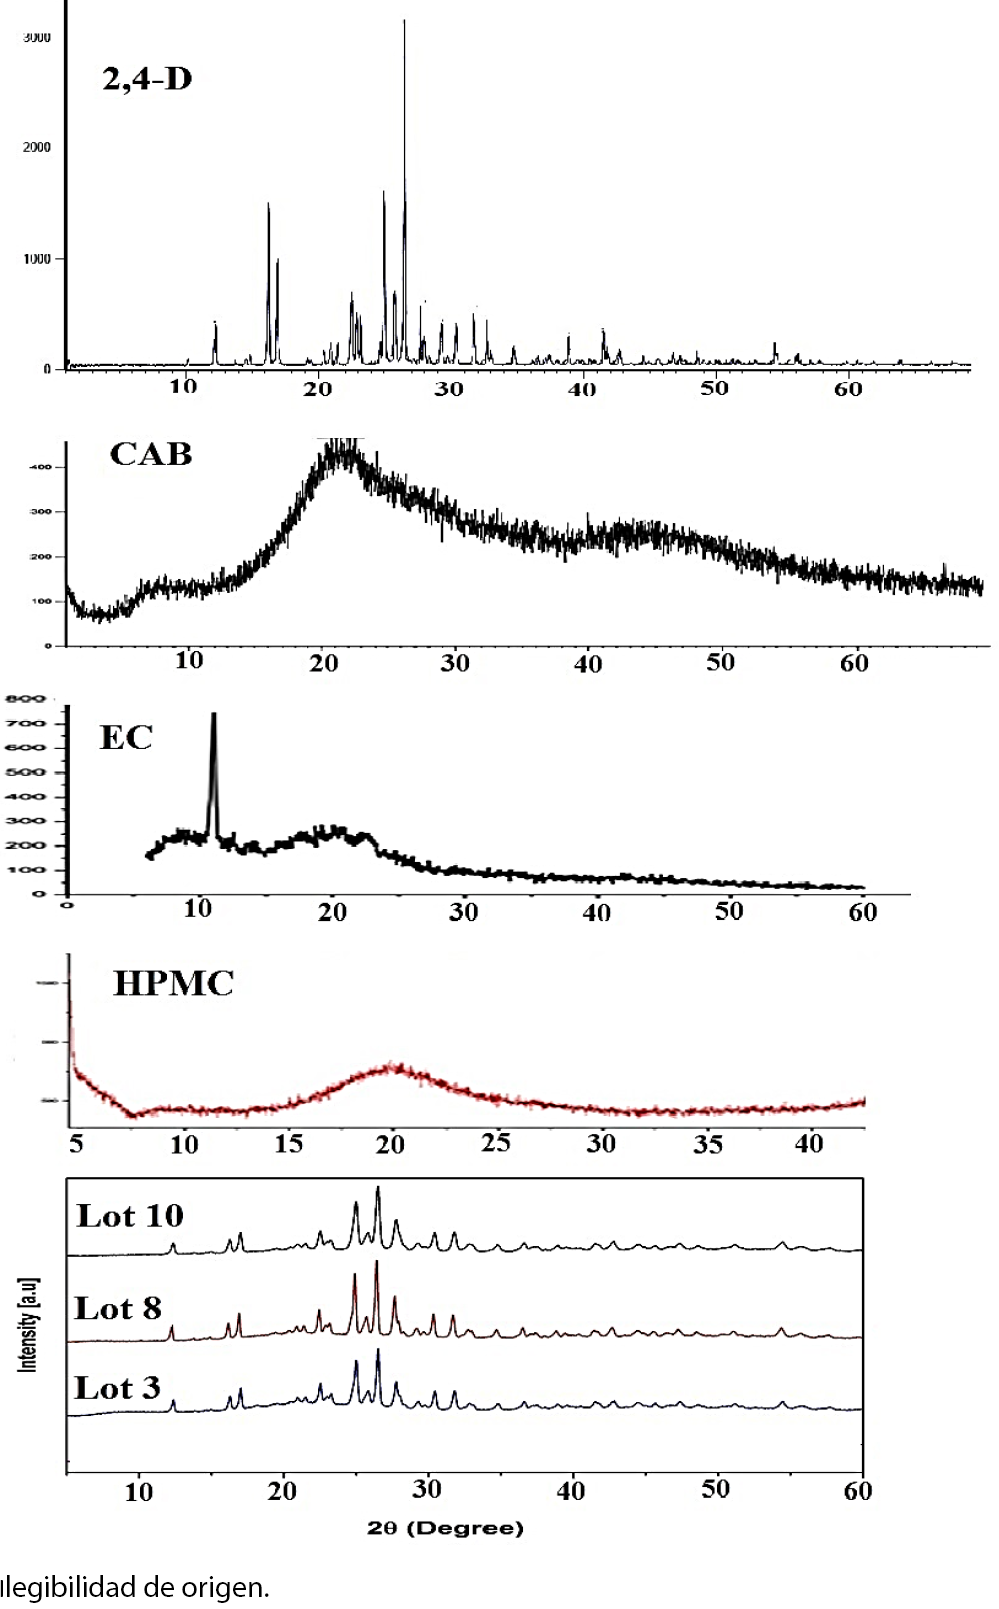
The X-ray diffraction (XRD) profiles of the 2,4-D (Fig. 3) exhibit some clearly peaks with a high intensity at 2(: 12°, 16°, 17°, 22.5°, 25°, 26.5°, 30.5° indicating the crystalline form of 2,4-D. The CAB, HPMC and EC X-ray diffractograms showed the amorphous state of the polymer matrix. Nevertheless, in the X-ray diffraction pattern of microspheres appeared some characteristic peaks appropriated to 2,4-D but with a low intensity. The results indicated the diminution of the crystalline form of the herbicide in these formulations.
Drug release study
In order to test the controlled release formulations, the 2,4-D release kinetics are established in water and examples of release profiles are given in Fig. 4-a. The Higuchi’s [30] model has been tested (Fig. 4-b) and good linear fits are obtained confirming that the drug release is, generally, governed by diffusion process. The obtained release constant (KH) and the coefficient of determination are reported in tables 1-3. Also, the exponent n of the Korsmeyer-Peppas’ model [32] can be used to elucidate and characterize the drug release mechanisms as a Fick’s diffusion when n = 0.5, as a non-Fickian model when n > 0.5 and as a quasi-Fickian model wken n < 0.5.
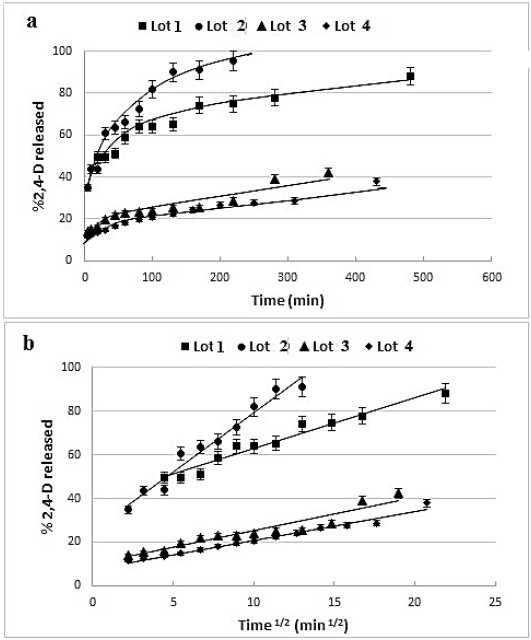
Fig. 4 2,4-D release kinetics from 2,4-D/EC:HPMC microparticles’: a- release profiles, b- Higuchi’s mathematical model presentation.
The entire results of the two models and the percentage of 2,4-D released are given in table 4. We noted that for the majority of formulations, the initial drug release (drug released after 5 minutes of contact time) exceeded 10% and attained more than 30% in some formulations.
Table 4: 2,4-D release results in distilled water
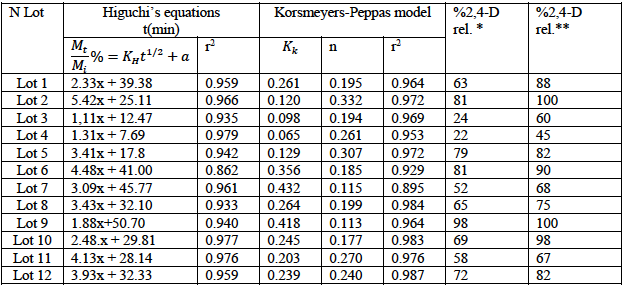
* %2,4-D released after 2 hours
**%2,4-D released after 24 hours
In fact, the drug release is dependent on the cited variables; the Higuchi’s model [30] results showed that the coefficient of regression exceeded 0.9 for practically all formulations and the Higuchi’s release constant (KH) varied from 1.1 to 5.4 min-1/2. We noticed from table 4 that all formulations discharged the 2,4-D with a burst effect; for example, for the lot 5, the initial drug release exceeded 44%, it attained 79% after 2 hours and 82% after 24hours. The burst effect is certainly due to the presence of drug at the surface of microparticles as remarked in the SEM photographs or to the porosity of microparticles which permits a rapid and facile adsorption of water and then the drug dissolution and release. The results are promising since the burst effect permits to attain rapidly the drug efficacy, which is followed with a slow and a controlled release. Consequently, the drug efficacy can be maintained for a longer time.
Based on the values of the exponent “n” of Korsmeyer-Peppas model which varied from 0.11 to 0.33 (table 4), the diffusion mechanism of the 2,4-D from these systems can be characterized by a quasi-Fickian model.
The effect of the selected parameters are analyzed and discussed in the following section using the Minitab software. Nevertheless, if we compare the nature of matrix (EC/HPMC, CAB and CAB/HPMC), we noticed that the microparticles composed from the mixture of CAB and HPMC discharged rapidly the 2,4-D. The results can be explained by both the CAB and the HPMC properties; HPMC is considered as hydrophilic matrix favoring the absorption of water and then the drug dissolution and diffusion. As well, the CAB matrix provided rapid and controlled release; this can be related also to the presence of hydrophilic “acetate” groups, which facilitate the water penetration and drug dissolution.
Data investigation
Using factorial designs, statistical evaluation of the effects of the selected parameters was performed. Data collected for the responses in each run are analyzed using the Minitab 16.1 software -DOE- factorial design. The selected independent variables are the stirring speed (X1) and polymer concentration (X2) for DOE1, the stirring speed (X1) and 2,4-D:polymer ratio(X2) for DOE2 and finally the percentage of HPMC (X1) and 2,4-D:polymer ratio (X2) for DOE3. However, for all the built DOE, the responses Yi of the polynomial (eq. 1) corresponded to the number mean diameter (d10), the drug content (T%) and the Higuchi’s drug release constant (KH). They are measured for each trial and then interactive statistical first-order complete model, eq. (1) is generated to identify statistically significant terms.
Where a0 is the arithmetic mean response of 4 runs (22) and ai is the estimated coefficient for the factor Xi.
The main effects of X1 and X2 represent the average result of changing one factor at a time from its low to high value. However, the interaction X1X2 shows how the response (Yi) value changes when two factors are simultaneously changed.
Then, these equations represent the main quantitative effect of factors X1 and X2 and interactive effect of the two factors upon the response Y (drug content; T%, size; d10 and drug release constant; KH). The sign of the coefficient (ai) shows how the factor influences the response. Positive sign means that the response is increased as the factor moves from low level -1 to high level +1 (synergistic effect) and if the sign is negative, the response is decreased (adversary effect). The results of the fitted equations relating the chosen responses to the variables are reported in the following equations:
DOE1:
DOE2:
DOE3:
Moreover, by means of graphical plots, the main effect of each variable can be observed clearly and compared easily (Fig. 5, 6 and 7). So, we can compare simultaneously the effect of the two factors which facilitate the comprehension of the ai coefficient of factor and its sign.
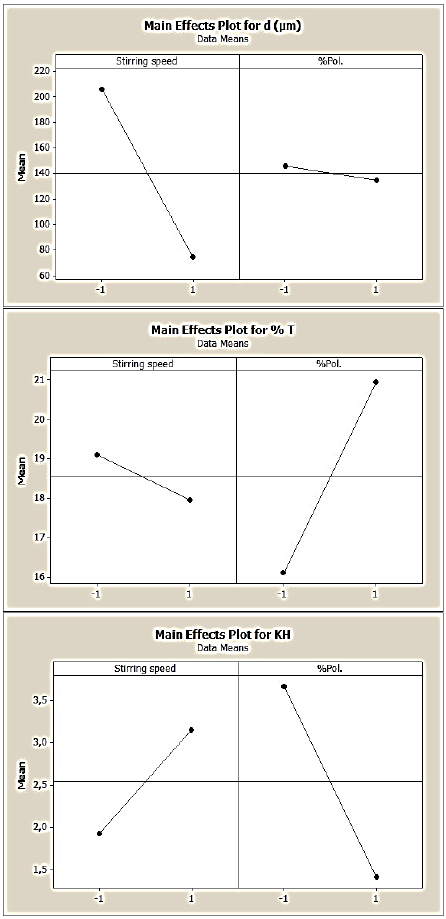
Fig. 5 Main effects of stirring speed and polymer concentration on the 2,4-D/EC:HPMC microparticles’ characteristics (d10, %T and KH), (DOE1).
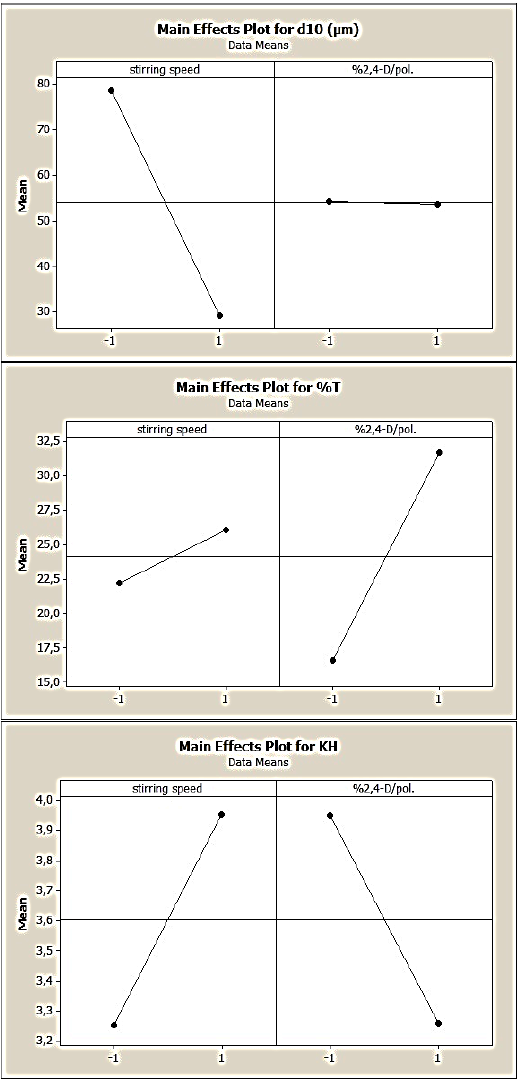
Fig. 6 Main effects of stirring speed and drug:polymer ratio on the 2,4-D/CAB microparticles’ characteristics (d10, %T and KH), (DOE2)
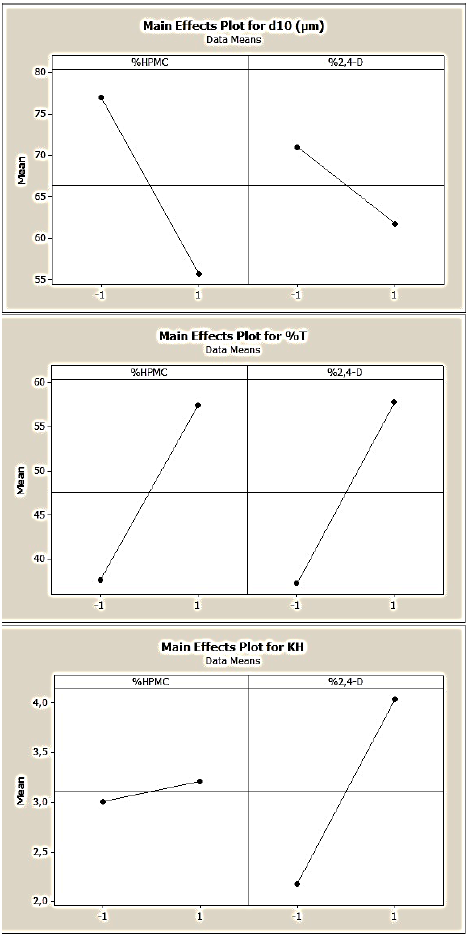
Fig. 7 Main effects of %HPMC and drug:polymer ratio on the 2,4-D/CAB:HPMC microparticles’ characteristics (d10, %T and KH), (DOE3).
Thus, regarding the 2,4-D/EC:HPMC microspheres results (DOE1: equation 2,3 and 4) and the illustrations given in Fig. 5 showed that only the polymer concentration (X2) had a positive and a strong effect on the drug entrapment; while the stirring speed (X1) had a low and negative effect on T%. In this case, a low interactive effect (a12) between the two variables is noted.
The effects of variables on the microparticles’ size revealed that the stirring speed exhibited a high but adversary effect on d10; in fact, the number mean diameter (d10) decreased when the stirring speed increased. The results are in agreement with theory, according to the initial break up theory, increasing the stirring speed of emulsification induces small droplets and in contrary viscous organic phase leads to big droplets. [32,33] The results showed that polymer concentration (EC:HPMC) had a negative and small effect on the microparticles’ size; however, in our previous research the polymer concentration (pure EC) affected strongly and positively both the drug entrapment and the microparticles’s size, [10,11] then we can concluded that the presence of HPMC reduces the organic phase viscosity.
The effects of these variables upon the drug release are significant. Indeed, we remarked that when the stirring speed of emulsion increased, the drug release constant increased, and in the opposite, the increase in polymer concentration led to the decrease of the drug dissolution.
DOE2 consisted to produce microparticles composed from pure CAB and obtained at a fixed concentration with stirring speed (X1) and drug:polymer ratio (X2)) as variables The mathematical modelling permitted to elucidate the main and interactive effects of the selected variables on microparticles’s characteristics (equations 5, 6, 7 and Fig. 6).
In this case, the results showed a strong negative effect of stirring speed on the microparticles’ size and a very low negative effect of drug:polymer ratio. A positive interactive effect is noted.
Nevertheless, these parameters exhibited positive effects on the drug entrapment; the drug:polymer ratio displayed the highest effect on the drug entrapment which reached 32% when the initial concentration of 2,4-D is increased.
Also, we noted that the increase of stirring speed, which leads to small microparticles, presented a positive effect; in fact with small microparticles, the surface contact with the release medium is higher and consequently the drug release is enhanced.
When the drug: polymer ratio increased, we remarked that the herbicide release slow downed but slightly, this can be related to the high drug concentration in microparticles which takes times to solubilize and diffuse out of the microparticles.
About the third DOE, the microparticles are composed from CAB as basic matrix incorporated with HPMC, the variables are the %HPMC (X1) and drug: polymer ratio (X2). The Fig. 7 and corresponding polynomial equations (8, 9 and 10) showed the effects of these parameters on the microparticles’ characteristics.
We noticed a negative effect of both the %HPMC and drug:polymer ratio (%2,4-D) on the d10, then the increase of these factors induced the decrease of microparticles’ size. In this case, the interactive effect between these variables is positive and high. However, these variables exhibited a strong and positive effect on the drug entrapment, so it can be improved if we increased the %HPMC or the drug:polymer ratio. When the two variables are at the high level, the drug entrapment reached 69%.
Upon the drug release, only the X1 (%HPMC) displayed a positive ant high effect. Then the drug release can be augmented using incorporated HPMC matrix. The effect of the drug: polymer ratio is slightly positive which is on contrary of the DOE2 remarks. In this case the effect of this variable seems to be influenced by the presence of HPMC which lead to very porous microparticles.
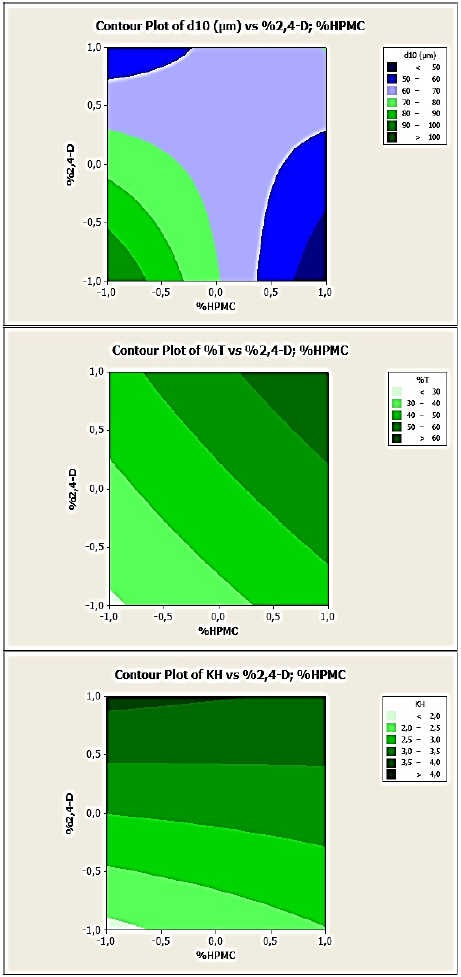
As well, in the contour plots in Fig. 8, 9 and 10 corresponding respectively to DOE1, DOE2 and DOE3, each response can be predicted at known process parameters between a low level (-1) and a high level (+1). For example, from Fig. 8 (EC:HPMC microparticles, DOE1) where the variables are the stirring speed and polymer concentration, to obtain microspheres with a mean diameter ranged from 160 to 180 µm, the stirring speed can be selected at the level -0.5 (corresponding to 350 rpm) and %polymer at the level -1 (corresponding to 2.34). In these conditions, the drug entrapment must be ranged from 16 to 17% and the release constant from 2.5 to 3.5.
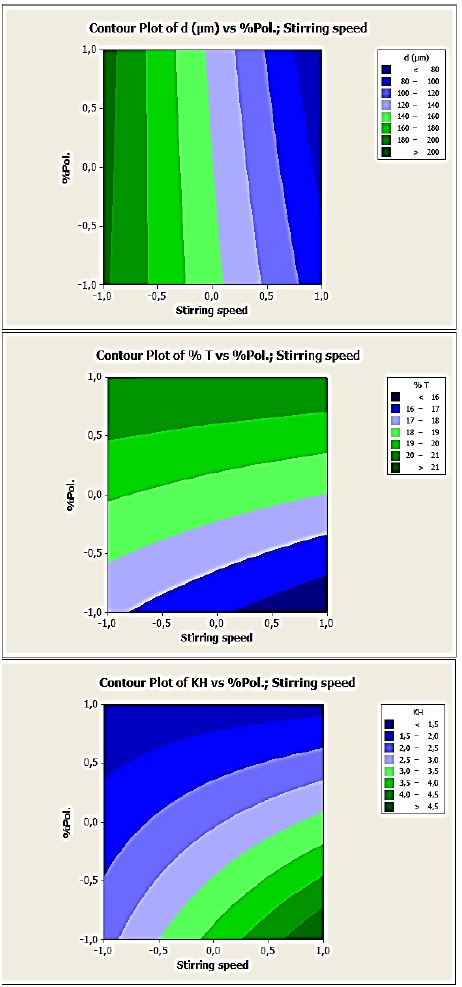
Fig. 8 Contour plots of d10, %T and KH versus stirring speed and polymer concentration variables for 2,4-D/EC:HPMC microparticles’, (DOE1).
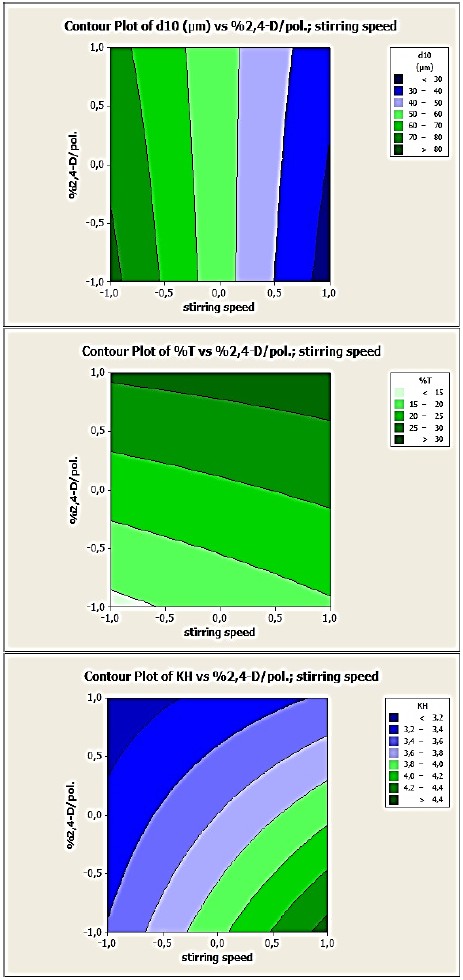
Fig. 9 Contour plots of d10, %T and KH versus stirring speed and drug:polymer ratio variables for 2,4-D/CAB microparticles’, (DOE2).
Conclusion
The present investigation is an optimization of the 2,4-D cellulose derivatives controlled release formulations using design of experiments (DOE). Based on biodegradable cellulose derivatives polymeric matrices, the microspheres are obtained by emulsification- solvent evaporation technique. Some variables namely stirring speed of emulsion and polymer concentration, drug:polymer ratio have been varied and their main and interactive effects on the microparticles’ characteristics are quantitatively estimated by modelling using Minitab 16.1 software. The results demonstrated that these factors influenced strongly the microparticles’ size and the drug entrapment and consequently they obviously affect the drug release. 69% of drug entrapment is reached and the mean diameter of microparticles d10 ranged from 25 to 208 µm. For all formulations, the drug release provided a burst effect varying from 7 to 50% followed by a slow and controlled drug release, this initial amount can ensure the herbicide efficiency and its preservation for a longer duration. By means of factorial data analysis, in general, synergistic effect of stirring speed is noted on the drug release and in contrary, an antagonist effect of polymer concentration is seen on the drug delivery for EC:HPMC microparticles. The increase of drug:polymer ratio increased the drug entrapment but decreased the drug release for CAB microspheres. The use of HPMC as co-matrix allowed to the increase of both the drug entrapment and the drug release. So, the theoretical modelling equations permitted to predict the microparticles’ or the formulation properties and especially the 2,4-D release with a minimum number of experiments. Consequently, using this methodology, promising 2,4-D carriers which can enhance the herbicide efficacy and at once reduce its hazardous effect are obtained. As well, this methodology permitted to reduce the 2,4-D used for experimental trials.
Experimental
Materials
2,4-D and Ethylcellulose (EC) (22 mPa s, 48% ethoxylate) were purchased from SIGMA-ALDRICH. Hydroxypropylmethylcellulose (HPMC) (H7509. viscosity 2,600-5,600 cP, 2 % in H2O) was from Sigma (life science). Cellulose acetate butyrate butyryle (CAB) (35-39%, Mw=70,000) was from ACROS Organics. Hydrolyzed polyvinylalcohol (PVA) 87-89 % (MW = 13000-23000) was purchased from Aldrich Fine Chemicals (USA).
Microparticles preparation
Microparticles are prepared by an O/W emulsion-solvent evaporation process according to 22 factorial design for each matrix; the number of experiments required for these studies is dependent on the number of independent variables selected (polymer concentration, drug concentration and stirring speed). The microspheres are prepared as reported in our previous papers. [10,11] The organic phase composed from the 2,4-D and polymer matrix i.e. EC:HPMC, pure CAB or CAB:HPMC dissolved in dichloromethane (DCM) or a mixture of DCM and acetone respectively is emulsified with an aqueous phase of polyvinylalcohol PVA (0.25%, w:w) under mechanical stirring for 6 hours to ensure the complete solvent evaporation. Then, the microspheres are filtered, washed twice with distilled water, and vacuum-dried in a desiccator in the presence of CaCl2. The experimental conditions (2,4-D: pol. ratio, %Pol./solv.: mass %, %HPMC, stirring speed, solvent) are specified for each type of formulations in tables 1,2 and 3.
UV spectroscopy analysis
The drug entrapment and drug release are determined using a UV-Vis spectrophotometer (Shimadzu UV-2401 PC, Shimadzu, Japan). The 2,4-D aqueous or alcoholic solutions are analysed at λmax =283 nm where ε is equal to 8.222 g L-1cm-1 in water and 8.314 g L-1cm-1 in ethanol.
Microparcticles’ characterization
Microspheres are characterized in term of size, (d10: number mean diameter, d32: surface mean diameter, d43: weight mean diameter and dispersion δ) measured by optical microscopy (Optikam B1, Optika, Italy) by applying the following equation and using the Excel worksheet. More than 500 microspheres are placed on a glass slide and the particle size was measured using appropriate lenses.
The drug content or entrapment (T%) is determined by extraction in triplicate in ethanol, 5 mg of dried microparticles is soaked in 20 mL of absolute ethanol under stirring in a corked bottle for 4h. The resulting solution is analysed by UV spectroscopy and the drug content and the encapsulation efficiency (EE%) are calculated from the following equations.
The FTIR spectroscopy (ATR ALPHA FT-IR spectrometer) and XRD (Bruker D8 DISCOVER diffractometer) analysis are used to verify the effective drug entrapment and its crystalline form. The surface morphology is examined by scanning electron microscopy (SEM- JSM 7100F-Joel).
Drug release study
The release kinetics of the 2,4-D from microspheres are established at 25°C in distilled water, in an appropriate dissolution reactor as described in previous work. [10] 200 mg of microparticles are soaked in the reactor containing 900 mL of water. At the desired time, 3 mL of the solution are withdrawn, analysed by UV spectroscopy (Shimadzu UV-2401 PC, Shimadzu, Japan) without dilution, and returned back to the Erlenmeyer flask.
The release data are analysed according to the Higuchi’s equation [30] and Korsmeyer-Peppas’ equation: [31]
where M t /Mi is the fractional drug release; KH and KK are the Higuchi’s and the Korsmeyer’s release constants, respectively; a and n are a constant and an exponent characterizing the drug release mechanism, respectively.


 nueva página del texto (beta)

