


 nueva página del texto (beta)
 Inglés (pdf)
 Artículo en XML
 Referencias del artículo
 Enviar artículo por email
 Citado por SciELO
  Similares en
SciELO
Similares en
SciELO 
 Permalink
Introduction
In recent years, antibiotics in the aquatic medium have largely increased [1]. The growth of aquaculture industry has supported by some applications which damaging to human health [2]. Antibiotics can be seen due to poor removal ability in various water sources such as surface water, sea water and drinking water [3,4]. Its chemical stability and low biodegradability in the water medium is a priority problem related to these organic compounds in waste water [5]. Several researchers have expressed that antibiotics, for example norfloxacin, affect to environment negatively. In addition, they can cause allergy and toxicity and lead to the improving of antibiotic-resistant bacteria [1,2]. OTC negatively affects the human health. For example, tetracycline in blood plasma is transported as a calcium complex that forms a complex, that once linked to magnesium found in the cells of bacteria, is linked to the ribosome. In this case, it is known that the binding of magnesium to the ribosome complex inhibits protein synthesis by triggering bacteriostatic effect but does not kill microorganisms [6]. Also, all tetracyclines have the same spectrum and mechanism of action, adverse effects and similar tolerances by resilient organisms. Hämäläinen and co-worker [7] have expressed that there was no significant effect of oxytetracycline on plasma total or free T plasma hormones. In addition, they suggested that enterohepatic recycling and intestinal metabolism in estrogens may be important in men. The mechanism of action of antibiotics on estrogen metabolism probably resulted in reduced hydrolysis of estrogen conjugates by intestinal contents of P-glucuronidase, estrogen conjugate aglycones reabsorption and fecal loss of steroids. Therefore, to decrease the amount of such organic materials in an aquatic medium, several techniques have been developed. One of them is advance oxidation process (AOPs). Among the different AOPs, heterogeneous semiconductor materials have been used and TiO2 is the most popular catalyst for degradation of organic molecules [5]. ZnO has been used as photo-catalyst for multiple samples such as viruses, dyes, pesticides and volatile organic compounds (VOC). Photocatalytic effect of ZnO depends on their size and morphology [8]. Fang and co-worker were expressed that spherical ZnO is more active than flower-like shape of ZnO. Therefore, morphologic structure of ZnO has an important role to efficient degradation in photocatalytic reaction [9].
Clay minerals have been largely applied for removal of toxic materials from waters, and likely it is an optimal alternative material for studied in these days [10,11]. Uğurlu and Karaoğlu (2011) [12] have implied that clay assisted metal oxides have enhanced photoactive materials than bare metal oxide. Immobilization of ZnO in a clay surface can cause long time reusability. In addition, the adsorption capacity of clays also generates better catalytic efficiency as compared to bare nanoparticles producing bifunctional nature for these composites [13]. Bentonite clay has multiple advantages, for example it is inexpensive, nontoxic and widely available and is mainly composed of montmorillonite which is an aluminosilicate mineral [14]. Bentonite exhibits high adsorptive ability for organic dyes via an ionic exchange, and this property is an advantage for the photocatalytic reaction when a semiconductor is fixed onto a clay surface [15,16].
In this study ZnO and ZnO/Bent nanospherical catalysts were synthesized via chemical precipitation method and their photoactivity was investigated. Oxytetracycline (OTC) antibiotic was chosen as a model pollutant. The catalysts were characterized by SEM, and XRD advanced analytical techniques. Surface properties were evaluated with BET results. Solution pH, catalyst dosage, and initial OTC concentration were selected as operational parameters. Our focus in this paper is on the comparative study by synthesizing a clay/catalyst composite. Its degradation yield and most efficient degradation conditions were investigated. Our study presents an academic understanding of a new effective catalyst structure.
Results and Discussion
SEM and EDAX analysis
In order to explain morphology and shape of the catalysts, SEM and EDAX analysis were carried out. Fig. 1 shows SEM image of Bentonite, ZnO and ZnO/Bent particles respectively.
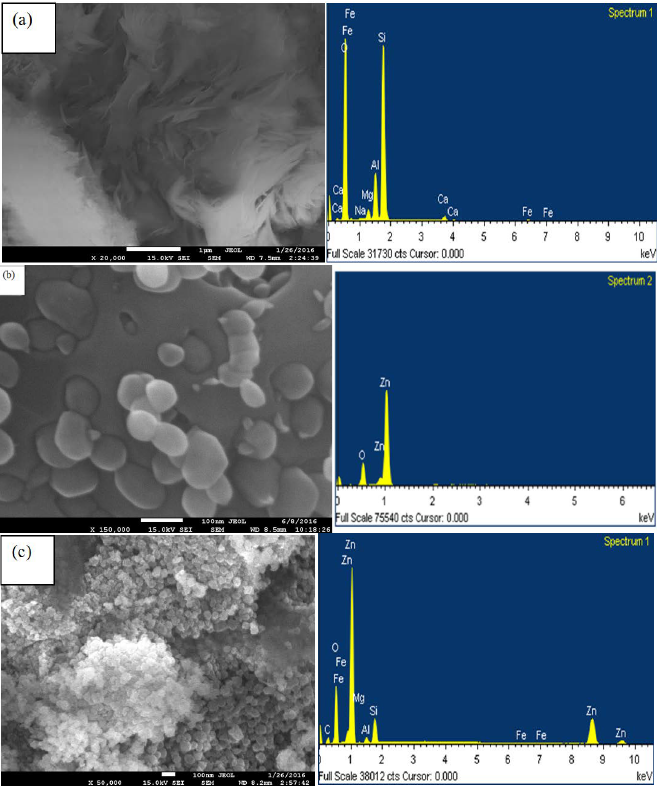
From the Fig. 1(a), raw bentonite exhibits cottony-like and amorphous structure. Its particle size is not determined from the SEM image. As-synthesized ZnO particles have irregular shapes, jagged and uneven surface structure; its particle size is 70-80 nm approximately (Fig. 1b). Nearly spherical ZnO particles can be clearly seen on the bentonite surface (Fig. 1c). The particle size of ZnO on bentonite is 40-50 nm approximately (Fig. 1c). The size of the bare ZnO particles is larger than that of ZnO nano-sphere particles on the Bentonite surface. This result indicates that the immobilization of ZnO nanoparticles on the surface of bentonite led to the formation of nanoparticles with lower particle size [17]. Khataee and coworkers have obtained similar results using TiO2 nanoparticles on the surface of montmorillonite clay [18]. In addition, Kocí and coworkers also have expressed that the bentonite clay can modify the surface properties of the catalyst (e.g acidity or basicity) and thus it prevents the largely agglomeration of the synthesized catalyst [19]. Decreasing the particle size of ZnO/Bentonite provides higher surface area and consequently, higher active sites on the catalyst. EDAX analyses of ZnO and nanosphere ZnO/Bent particles reveal the presence of target components.
XRD analysis
Fig. 2 represents the XRD pattern of raw ZnO (a), bentonite (b) and ZnO/Bent (c) catalyst respectively. The diffraction peaks around at
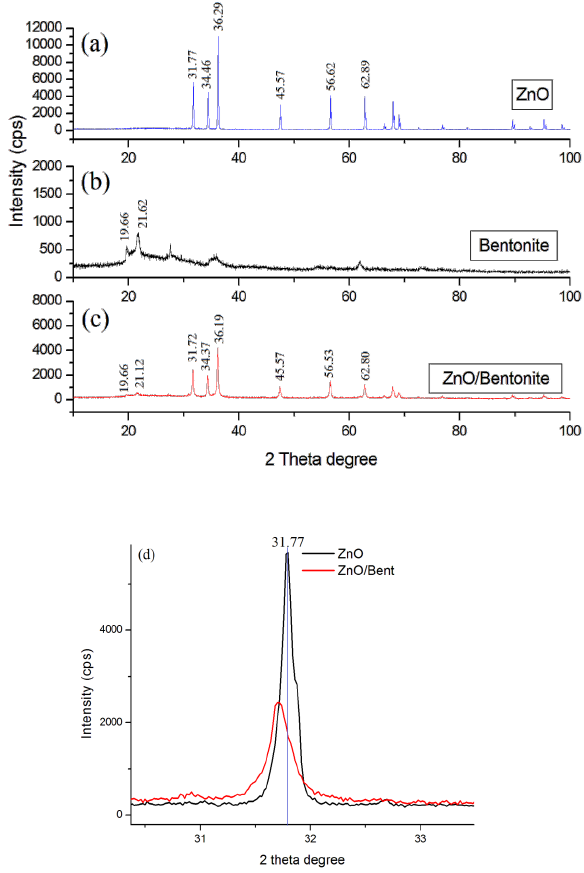
The size of particles was calculated using Eq 1. The peak intensity and full-width at half maximum (FWHM) values were determined from the XRD diffraction peaks. FWHM values which located in Debye-Scherer formula are derived from the most intense peak for the catalysts. Average crystallite size of bentonite, ZnO and ZnO/Bent was found 5.75, 80 and 45 nm respectively. This implies that the crystallite size of ZnO in the ZnO/Bent system was lower indicating a crystalline defect (slightly lower crystallinity) which reveals higher FWHM value in the ZnO/Bent structure. This shows that Bentonite clay acted both as a supporting material and as a size controlling material. This is in good agreement with the XRD results.
Fig. 3 shows adsorption-desorption isotherms and BJH pore size distribution of synthesized catalysts. As shown in this figure the shape of the isotherm is similar to type IV isotherm according to the IUPAC classification. The isotherm of ZnO showed H1 hysteresis loops in the relative range between 0.75-1.0 which is mainly due to the sorption of mesoporous by nitrogen via capillary condensation (Fig. 3b). For ZnO/Bent, the isotherm exhibited type H3 hysteresis loop confirming some degree of mesoporosity which originated from stacking defects of clay at high relative pressure between 0.5 and 1.0 value (Fig. 3d). In addition, this usually demonstrates an aggregation of spherical particles or adsorbents containing slit pores [20]. Also, pore size distribution of all catalysts suggests an increasing of adsorption ability of ZnO/Bent catalyst than that compared to ZnO. BET surface area is reported in Table 1. It is clear that BET surface area of ZnO/Bent catalyst is higher than that of ZnO. Decreasing the surface area of bentonite clay confirms that ZnO particles, which were generated by chemical precipitation method, deposited on the bentonite surface efficiently. This result could be attributed to a good dispersion of ZnO and the pore blocking due to the nanosize and homogeneous morphology of ZnO particles. the pore size distribution of Bentonite and ZnO/Bent samples shows that bentonite clay has higher pores than that of the ZnO/Bent catalyst. The most prevalent pore size was 35-40 nm; few pores were greater than 80 nm. These results are likely to be related to blocking of the macropores and some larger mesoporous by ZnO particles, resulting in the smaller mesoporous [21]. When compared with pure ZnO and ZnO/Bent catalyst, the surface area of ZnO/Bent is 25 times larger than pure ZnO. In this case ZnO/Bent displays higher adsorption consequently higher degradation efficiency.
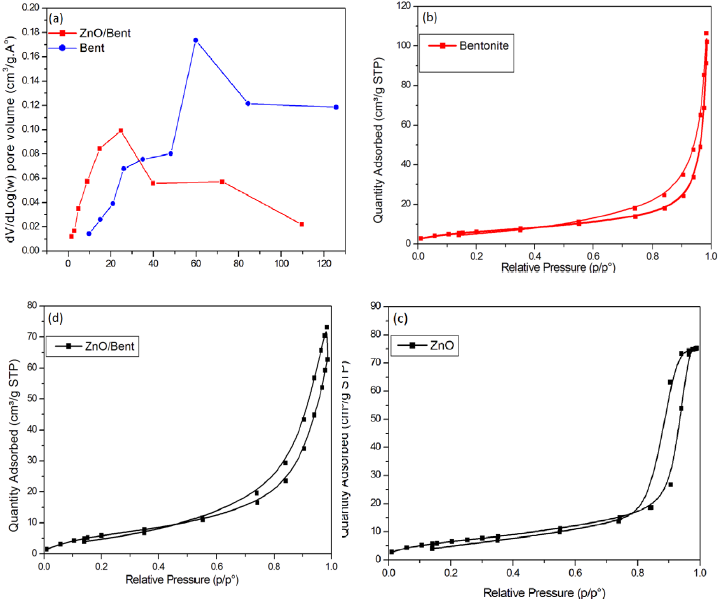
Fig. 3 Pore size distribution of bentonite and ZnO/Bent (a) Adsorption-desorption profile of Bentonite (b), ZnO (c) and ZnO/Bent (d) samples

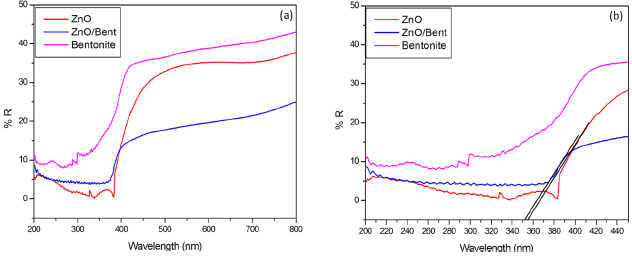
UV-DRS Analyses
Fig. 4 shows UV-DRS analysis of Bentonite, ZnO and ZnO/Bent catalyst. As can be seen from the Fig. 4, pure ZnO and ZnO/Bent samples have a strong absorbance between 300-400 nm. Raw bentonite clay exhibited little adsorption in the range of visible light. The absorption spectrum of ZnO/Bent is slightly shifted to lower wavelengths. The edge of the band gap of ZnO and ZnO/Bent is 354 and 352 nm, respectively. The band gap energy, which can be calculated from the onset of the absorption edge (
Operational Parameters and Photo-catalytic Studies
Effect of pH
The influence of pH was conducted from 3 to 11 adjusted with HCl (0.1N) and NaOH (0.1N) solutions. For this, 50 mL of OTC (10 mg L-1) and 0.1 g of ZnO/Bent catalyst were added and started the photocatalytic reaction in the UV reactor at different pH. The obtained results are shown in Fig. 6. It can be seen from the Fig. 6, that the maximum degradation rate was found at pH=3.5. The isoelectric point of OTC is about 5.4 [24] and at pH=2-3, OTC is fully protonated as [H3OTC]+ form. Fig. 5 shows isoelectric titration graph of ZnO/Bent catalyst. It can be seen that the surface charge of ZnO/Bent catalyst is in its negative form almost at every pH value. This indicates a strong electrostatic attraction between the catalyst surface and the OTC molecules at lower pH values. This attraction caused an increase in the degradation efficiency of the catalyst at pH=3.5. The existing form of [OTC] is [H3OTC]+ (1%), [H2OTC] (98%), [HOTC]- (1%) at pH=5.5, [H2OTC] (76%), [HOTC]- (24%) at pH=7, H2OTC (8%), [HOTC]- (88%), [OTC]2- (4%) 7 at pH=8.5 and HOTC- (7%), [OTC]2- (93%) at pH=11 [25]. This implies that the surface charge of OTC is negative when the pH is increased. In this case, electrostatic repulsion occurred between the catalyst surface and OTC molecules at high pH value. Thereupon, low adsorption and degradation are observed at high pH values. In addition, when ZnO dissolution is considered at highly acidic conditions, ZnO reacts with HCl and transforms to Zn2+ and H2O [26]. In contrast, at high alkaline conditions ZnO suspension is in equilibrium with [Zn(OH)3 -] and [Zn(OH)4 2-] ions [27]. Because of that, the degradation efficiency may be obtained as minimum values at high and low acidic conditions. Furthermore, the obtained degradation percentage at above pH=7 may come from photolysis; the increase in molar absorptive of [OTC] at 254 nm confirms this phenomenon [28]. Because negatively charged OTC molecules tend to make possible [OTC] photolysis, they revealed a smaller role of photo-catalysis at such higher pH levels (Table 2) [29].
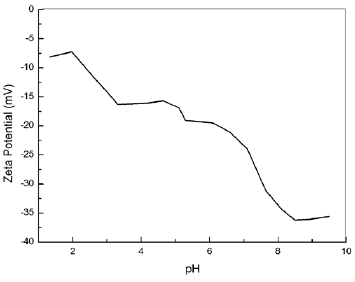

Fig. 6 Effect of pH on degradation of OTC by ZnO/Bent (experimental conditions: OTCo=10 mg L-1, catalyst dose=0.1 g, λ=251 nm)

Catalyst dosage and initial concentration
In order to determine optimum catalyst dosage, 0.1-1 g of ZnO/Bent and 50 mL of OTC (10 mg L-1) were added to UV reactor for 120 min. From the results, the degradation rate increased with the concentration of ZnO/Bent up to 0.2 g, and then decreased (Fig. 7). This can be explained if, due to light scattering, the entrance of UV light decreased at high catalyst concentration. The reduction of light intensity did not inhibit an increase of electron (
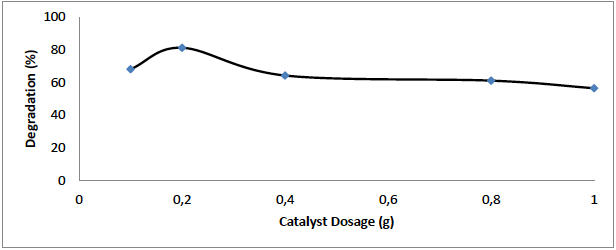
Fig. 7 Effect of catalyst dosage on degradation of OTC by ZnO/Bent (experimental conditions: (OTCo=10 mg L-1 t=120 min

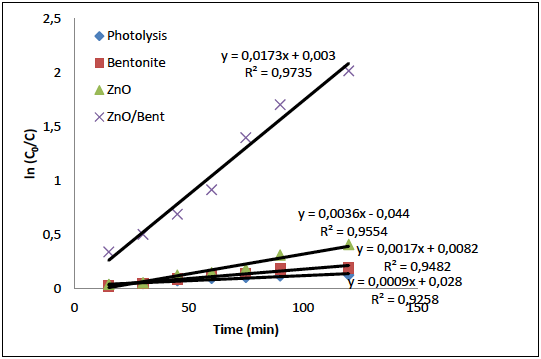
Kinetic and photocatalytic studies
The pseudo first order equation can be used to explain the kinetics of photocatalytic degradation of OTC. The first order kinetic rate k (1/min) for OTC degradation can be calculated by plotting

Effect of Scavengers
In order to explain charge transfer pathway and main reactive species, potassium iodide (KI), isopropyl alcohol (IPA) and ascorbic acid (AA) were used as hole (

Fig. 11 Effect of different scavengers on degradation of OTC in the presence of ZnO/Bent photocatalyst
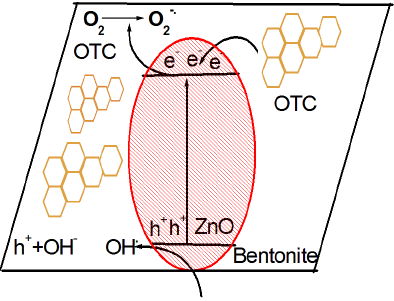
Fig. 13 shows UV-vis absorption spectra of OTC samples at different degradation times. The initial OTC solution shows two absorption peaks and the prominent peak is 251 nm. The peak at 251 nm decreases gradually and almost arrives to zero absorbance intensity within 120 min. This confirms that OTC molecules were highly degraded using ZnO/Bent catalyst. To reveal mineralization of OTC some oxidant was used during the degradation process. The catalytic reaction conditions did not change (OTCo=20 mg L-1,
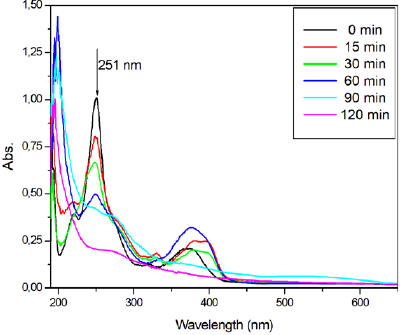
Fig. 13 UV-Vis spectra of OTC on ZnO/Bent at different times (OTCo=20 mg L-1,
HRMS (High Resolution Mass Spectroscopy) analyses
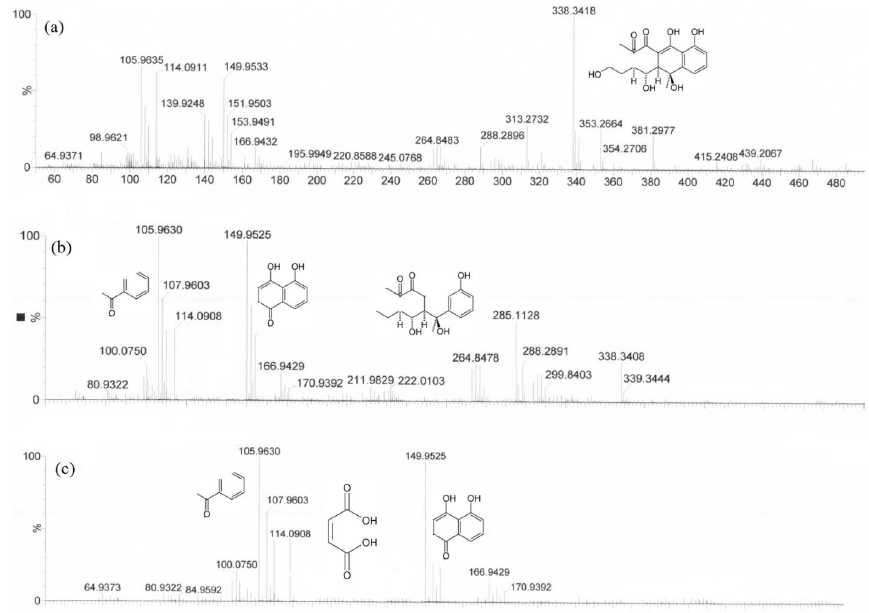
Fig. 14 shows HRMS analyses of degradation results for 30, 60, 120 min respectively. As can be seen from the Fig. 14(a), The main intermediate at m/z 338.3418 was quickly formed, reachinged the maximum amount after 30 min of irradiation and then was largely degraded after 120 min of irradiation (Fig. 14c). In addition, new degradation intermediates are seen for 60 and 120 min of degradation time (m/z 149, 105, 114). It can thus be suggested that the species of main intermediates increase time dependently and are almost converted to nontoxic intermediates within 120 min. Moreover, the following ions were monitored too: m/z 107.9603, m/z 166.9432. The final molecules that can be identified in the proposed HRMS results were maleic acid and other carbonyl compounds. These results show that ZnO/Bent catalyst is an efficient photoactive material for the decomposition of organic molecules which have high molecular mass under optimal conditions. The possible degradation intermediates are given in Fig. 14.
Experimental
Preparation of ZnO, ZnO/Bent nanosphere
ZnO particles were synthesized by chemical precipitation method. 13 g Zn(Ac)2.6H2O (Merck ≥97%) was dissolved in 100 mL of H2O (Solution A). Then 0.1 molL-1 of NaOH solution (Carlo Erba 97%) was added drop by drop to the solution A and stirred for 4 hours. After this time, it was filtered and washed with distilled water, dried at 80oC for 4 hours and calcined at 300oC for 3h.
In order to synthesize ZnO/Bent catalyst, raw bentonite (obtained from the Ordu region of Anatolia Turkey) was washed to remove contaminants and then dried in oven 80 °C for 4 hours. Approximately 15 g of 150 mesh size of Bentonite was added to Zn(Ac)2.6H2O and H2O mixture (
Characterization
The crystalline phase was examined by XRD (Rigaku Dmax 350) using copper-Kα radiation (λ = 0.154056 nm). The microstructure and shape of the particle were investigated using SEM (JEOL JSM-7600F). The elemental analyses were determined with (JEOL JSM-7600F) EDAX analyzer with SEM measurement. The Brunauer-Emmett-Teller (BET), pore volume, and pore size were measured using ASAP2010 (Micromeritics Instrument Corporation, USA) with N2 adsorption at 77.35 K. The isoelectric point of ZnO/Bent was obtained with a zetasizer (Nano S, Malvern Instruments). UV-DRS analysis was performed using Perkin Elmer Lambda 35 UV-Vis Spectrophotometer. In addition to the experiments, in order to identify OTC, decomposition intermediates were also evaluated. For that purpose, UV-visible spectroscopy and HRMS (High Resolution Mass Spectroscopy) analyses were performed for 30, 60, 120 min degradation time. HRMS analyses were carried out using a Waters SYNAPT G1 MS system with experimental conditions as; Sampling cone 30 V, extraction cone 4 V, source temp 80 °C, desolvation temperature 250°C and capillary voltage 2 kV.
The crystallite size of all catalysts was calculated using Scherrer equation
Where d is the average particle size, B is the Scherer constant (0.91), λ is the wavelength of the X-Ray (0.154 nm), β1/2 is full width at half maximum of the diffraction peak and θ is the diffraction angle. Surface physical properties of prepared catalyst including pore volume, surface area, and surface morphology have been examined and the results are summarized in Table 1.
Photocatalytic Experiments
In the photolytic experiments, a specially designed UV reactor with light a source (a series of six Philips UV lamps 20 W having a center wavelength of 254 nm positioned at 15 cm a distant over the sample surface) at ambient temperature and atmospheric pressure was used. The photocatalytic studies were performed as follows: A stock solution of OTC (10 mg L-1) was freshly prepared and 50 mL portion and 0.1 g of catalyst were transferred into the UV reactor and stirred for 60 min in dark to allow adsorption/desorption equilibrium. After degradation began, 1 mL of sample was withdrawn and filtered to determine degradation rates. The absorbance of the supernatant was determined by Dr Lange 2800 Spectrophotometer. The spectrophotometric measurements at the maximum wavelength of 251 nm were used to monitor the degradation rate of OTC. The degradation percentage of OTC was calculated at below equation:
Where Co is the initial concentration of OTC and C is the OTC concentration at the time. The UV-Vis absorption was measured by Shimadzu 1601 spectrophotometer. The molar absorption activity of OTC at 254 nm is calculated this formula
Conclusion
ZnO and ZnO supported bentonite (ZnO/Bent) photo-catalyst were synthesized using a chemical precipitation method and characterized by FTIR, SEM, and XRD. The photocatalytic degradation of OTC was investigated using these catalysts. ZnO/Bent showed higher degradation efficiency than pure ZnO. The photocatalytic data followed a first-order kinetic model. The optimal reaction conditions were 3.5, 0.2 g and 20 mg L-1 for pH, catalyst dosage and initial OTC concentration, respectively. This work demonstrates that pH is an important parameter for OTC degradation. At high pH value, photolysis may be taking place instead of the photocatalytic degradation. Possible degradation products were proposed according to HRMS analysis data. Under the optimum reaction conditions, 87% degradation was obtained within 120 min of UV light.

