


 text new page (beta)
 English (pdf)
 Article in xml format
 Article references
 Send this article by e-mail
 Cited by SciELO
  Similars in
SciELO
Similars in
SciELO 
 Permalink
1. Introduction
Clathrates are polyhedral lattice structures in which a group of molecules traps other molecules. They are also known as "host-guest" complexes, inclusion compounds and, in the natural gas industry, gas hydrates. Gas hydrates are crystalline solids that are similar to ice. The temperature at which hydrates form is above the freezing point of water. These structures are characterized by a hydrogen-bonded water cage around a hydrophobic solute. Guest molecules are generally non-polar small molecules (e.g. light hydrocarbon gases, carbon dioxide and nitrogen) or polar molecules with large hydrophobic segments [1].
In natural gas processing facilities, hydrate formation can cause several problems, such as the plugging of pipelines and fittings, which prevents the free flow of gas. The understanding of this phenomenon from a theoretical point of view may help to plan and optimize prevention measures, such as the injection of inhibitors, which can displace the gas-solid equilibrium to a higher temperature or pressure. Another important field where hydrate thermodynamics has a fundamental role is the recovery of methane from the seabed. In recent years, large amounts of gas hydrate have been discovered in the seabed and in permafrost zones. Gas hydrates, in the near future, may be an important energy source.
Depending on the size and composition of the guest molecules, gas hydrates may have three different structures, namely, structures I, II and H. Normally, light gases such as methane, ethane and nitrogen induce sI-type structures, whereas larger molecules like propane, i-butane, and n-butane form sII structures. Examples of sH hydrates are those formed by isopentane and cycloheptane. Hydrate formation is favoured at high pressures and low temperatures.
To predict hydrate formation, there are several empirical correlations and theoretical models. Wilcox et al. [2] introduced the first predictive method. They assumed that hydrates are solid solutions, treating them as an ideal liquid solution, and the equilibrium conditions were obtained from the gas-solid distribution coefficients. Then, after the determination of the crystalline structures in the 1950s, thermo-statistics models were established in order to describe the distribution of gas molecules within the hydrate cavities, such as that proposed by van der Waals and Platteeuw [3] (vdWP). On the other hand, for fluid phases, many equations of state (EoS) have been employed, from cubic EoSs [4] to more sophisticated ones like SAFT [5-7] or CPA [8, 9]. At the present time, the coupling of vdWP with EoS is the most used approach for hydrate-gas-liquid equilibrium modelling.
Recently, Medeiros and Téllez-Arredondo have presented an EoS that can deal with the association of substances, namely, the cubic two-state (CTS) EoS [10]. Its basis is the combination of the Soave-Redlich-Kwong (SRK) EoS, representing the physical part, and the two-state association model for the hydrogen bonding contribution. The CTS EoS has an equivalent polynomial form, which is easily solvable by robust numerical methods. This model successfully describes the phase equilibria of many non-ideal systems, such as alkane-alcohol [10], water-alcohol, alcohol-alcohol [11] and alkanolamine-water-acid gas mixtures [12]. In this last paper, the CTS equation combined with an electrolyte model produced very good predictions of multicomponent systems from binary data only. Its simplicity encouraged us to employ it in modelling fluid phases in hydrate equilibria, coupled to the vdWP model. Accordingly, we organized this paper as follows. First, we present briefly the CTS EoS, the vdWP model and the hydrate-fluid-phase thermodynamics. Then, we describe the correlations between the measured data for pure compounds (water, nitrogen, hydrocarbons and inhibitors), for water-inhibitor vapour-liquid equilibrium (VLE) experimental data and for single-gas hydrate equilibrium data. The third section shows the prediction of multicomponent gas hydrate equilibrium conditions, with or without inhibitors. Finally, conclusions and additional remarks are presented in the last section.
2. The model
When a system reaches thermodynamic equilibrium, the fugacity of each component in all phases is equal. For hydrate(H)-Liquid(L)-Vapour(V) equilibrium this condition is expressed by the following system of equations:
 (1)
(1)
where f is the fugacity, T the temperature, p the pressure, the vectors w, x and y are the molar composition of the phases. As mentioned in the introduction, EoSs produce expressions to calculate the fugacities of the fluid phases, whereas the vdWP model is the common model for the hydrate phase. In this work, we employed the CTS EoS-vdWP combination, which is briefly described below.
2.1 The CTS equation of state
In 2008, Medeiros and Tellez-Arredondo presented the CTS EoS [10]. In this equation, the SRK EoS describes the physical contribution to the Helmholtz energy and the modified two-state association model of Cerdeiriña et al. [13] gives the association part. The complete development of the model can be seen elsewhere [10-12]. For this EoS, the equation for the pressure is given by:
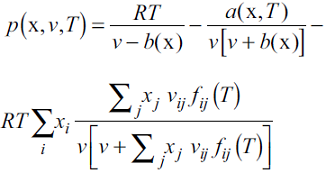 (2)
(2)
where R is the gas constant, T the temperature, v the molar volume, x is the vector of molar fractions x i , a is the mixture's dispersive parameter and b is the van der Waals mixture co-volume. In the association term, v ij is the characteristic volume of association of a pair of molecules i-j. The parameter f ij is given by:
 (3)
(3)
where E ij is the energy of association between molecules i and j. For pure compounds, the dispersive function a(T) is given by the conventional Soave function:
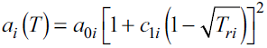 (4)
(4)
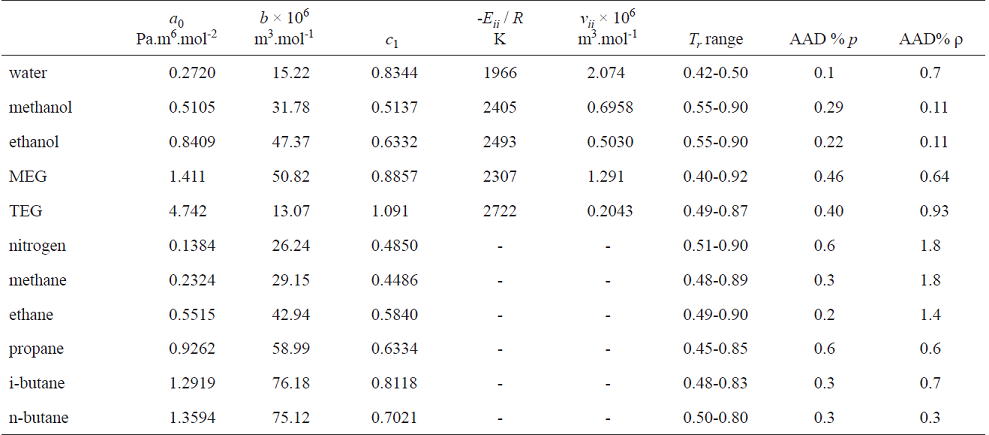
where T ri is the reduced temperature T ri = T / Tci. This EoS has five parameters for pure compounds: a 0i , b i and c 1i for the physical part and v ii and E ii for the association contribution. These parameters are regressed by fitting the equation to the measured saturation pressures and densities of saturated liquids.
For non-associating compounds, like hydrocarbons, CTS reduces to the SRK EoS. The combining and mixing rules for the physical part are the conventional van der Waals rules:
 (5)
(5)
 (6)
(6)
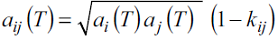
 (7)
(7)
where k ij is the binary interaction parameter, which corrects the geometric mean rule for a ij . For the cross-association parameters, the combining rules employed here were those suggested by Reynoso-Lopez et al. [11]:
 (8)
(8)
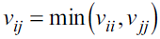
 (9)
(9)
where l ij is the binary interaction parameter for correcting the arithmetic mean rule for the cross-association energy. These binary parameters among associative substances are determined by fitting the EoS to measured VLE experimental data. From direct thermodynamics, the fugacity coefficient of species k(Φ k = f k / x k .p) from the CTS EoS is given by:
 (10)
(10)
where:
 (11)
(11)
In this work, we used Eq.10 for calculating the fugacities in the fluid phases.
2.2 The vdWP model
In the vdWP model, the thermodynamic properties of hydrates are the result of a three-dimensional generalization of the ideal adsorption. In this model, the hydrates are solid solutions. The basic hypotheses of this model are as follows: (i) the contribution of the guest molecules to the free energy is independent of the way they occupy the cavities, i.e. the caged molecules do not distort the host lattice. (ii) Each cavity can cage only one guest molecule, which cannot diffuse out of the cavity. (iii) There are no interactions between solute molecules. (iv) Quantum effects are neglected, so that classical statistics is valid.
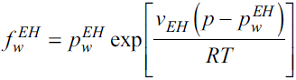
The result is an expression for calculating the water fugacity in the hydrate phase:
 (12)
(12)
The vdWP model allows the estimation of the water chemical-potential change in the process of enclathration of the guest molecules:
 (13)
(13)
where µ is the chemical potential, subscript w denotes water, superscripts H and EH refer to hydrate and empty hydrate, respectively, and n m is the number of type m cavities per water molecule. For sI hydrates n1 = 1/23 and n2 = 3/23, and for sII structures n1 = 2/17 and n2 = 1/17. q jm is the occupancy of molecules j in type m cages. The Langmuir adsorption relation gives the occupancy, assuming one guest per cavity:
 (14)
(14)
where f is the fugacity calculated by an EoS, and C mj are the Langmuir constants for the cage type m and guest molecule j. These constants can be determined by evaluating the configurational integral of guest-host and guest-guest intermolecular potentials or, empirically, by the method of Parrish and Prausnitz [14]:
 (15)
(15)
Parrish and Prausnitz adjusted A mj and B mj to fit Eq.15 to the values calculated with the Kihara intermolecular potential [14]. On the other hand, Folas et. al [9] made them adjustable in order to correlate experimental hydrate data with the CPA EoS. They followed the suggestion of Munck et al. [15], which states that adjusting these parameters allows better predictions of dissociation pressures for multicomponent hydrates. We employed the same approach.
Concerning the first hypothesis of the vdWP model, it is important to mention that there are evidences which show that guest affects host-host interactions [16]. Based on these evidences, Lee and Holder [17] devised a model which allows the calculation of the reference chemical potential depending on the guest, which is used to determine the Langmuir constants C mj via the configurational integral. Here, as previously mentioned, we decided to use Eq.15 to estimate the Langmuir constants with adjustable A mj and B mj , following Folas et al. [9] and Munck et al. [15]. Indeed, the effect of cage distortion is implicit in the regressed parameters.
The following relation estimates the fugacity of an empty hydrate:
 (16)
(16)
where
 (17)
(17)
We evaluated the empty hydrates' molar volumes with the Avlonitis correlation [18]:
 (18)
(18)
where T 0 is 273.15 K. The parameters of Eqs. and are listed in Table 1 for sI and sII structures.

In the next section, we present and discuss the regressions of the model’s parameters.
3. Parameter estimation
According to the previous section, the CTS-vdWP model has the following undetermined parameters: (i) for pure compounds, five CTS parameters (a 0 , b, c 1 , v ii , E ii ); (ii) for each pair, two CTS binary parameters (k ij and l ij ); (iii) for each hydrate guest molecule, two parameters for the Parrish-Prausnitz equation (Eq. ) (A mj and B mj ). We applied the following strategy to calculate them:
Determination of the five parameters (a 0 , b, c 1 , v ii , E ii ) for pure species (water, nitrogen, methane, ethane, propane, n-butane, i-butane, ethylene glycol and triethylene glycol) from their measured saturation pressures and liquid densities at saturation.
Estimation of binary parameters for the pairs of associating species H2O-MEG, H2O-TEG, H2O-metlianol and H2O-ethanol. The required experimental data were binary VLE data.
Regression of Parrish-Prausnitz parameters for solutes in both structures sI and sII, using gas hydrate measured data from the NIST database [19].
Regarding the water-hydrocarbon binary parameters, it is well known that predicting/correlating hydrocarbon aqueous solubility is a challenge for almost all EoSs. Economou and Tsonopoulos [20] have shown that the solubility is normally underestimated in many cases orders of magnitude with quadratic mixing rules. This happens even for more sophisticated EoSs, such as SAFT, APACT and CTS. Despite their poor solubility description, many successful coupling of EoS-vdWP for hydrate equilibrium correlation was obtained. Unconventional mixing rules are required in order to simultaneously correlate hydrate and vapor-liquid equilibrium. In the case of CTS, we are currently working on a new non-quadratic mixing rule, similar to those suggested by: (a) Prausnitz and co-workers for SRK EoS [21] and by (b) ourselves for CPA EoS [22]. In these mixing rules, water-water dispersive parameter is corrected by the presence of a hydrophobic solute. In this paper, we only focused on correlating hydrate dissociation pressures. Then, for the sake of simplicity, no binary interaction parameters were used for hydrocarbons and nitrogen, i.e. k ij for all pairs including these compounds were set to 0.
3.1 Pure compounds
The objective function for parameter regression of the pure compounds was
 (19)
(19)
where Ω is the vector of the parameters [Ω = (a0,b,c 1,vii,Eii)], p s is the saturation pressure, and r s is the liquid density at saturation conditions. Superscripts exp and CTS mean experimental and calculated with the CTS EoS. The summations run over the available measured data. Table 2 shows the parameters and deviations from experimental data. As expected, the CTS data correlated closely with the pure compounds' properties. For water, the parameters were regressed in the temperature range of hydrate formation.
3.2 Binary parameters for water-inhibitors
Thermodynamic inhibitors have the ability to shift the pressure-temperature equilibrium conditions. Common inhibitors in industry are alcohols, glycols and salts. These compounds have the capacity to interact with water and to inhibit cage formation. Methanol is the cheapest one, and the most used. Here, we evaluated how methanol, ethanol, ethylene glycol and triethylene glycol affected gas hydrate equilibria. Then, the VLE data of water-inhibitor mixtures were correlated using the CTS EoS. The binary parameters were determined by minimizing the following objective function:
 (20)
(20)
where ϕ is the bubble pressure or temperature, depending on the experimental data set. Table 3 shows the regressed parameters and the deviations produced by the EoS modelling. Figs. 1 and 2 show the phase envelopes for the glycol mixtures studied here. Alcohol-water pairs could be described with only one parameter (see reference 11), whereas for water-glycol pairs both k ij and l ij have nonzero values. The CTS EoS successfully correlated the VLE data.
Table 3 Binary interaction parameters for water-inhibitor mixtures and references for experimental data

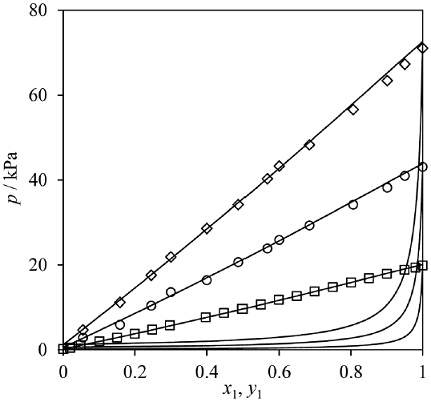
Fig. 1 Water(1)-MEG(2) phase envelope at 333.15 K (squares), 350.85 K (circles) and 363.45 K (diamonds). Symbols: experimental data from references [24-34]. Lines: CTS EoS.

3.3 Parrish-Prausnitz parameters for calculation of Langmuir constants
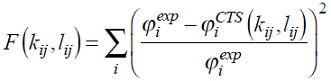
The parameters A mj and B mj in Eq. 15, required for the evaluation of the Langmuir constants, were adjusted in order to correlate the single and binary hydrate dissociation pressures. In these calculations, as previously mentioned, binary parameters for liquid water-gas and gas-gas were set to 0. The minimized objective function was:
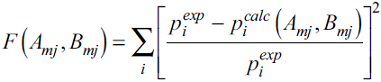 (21)
(21)
where p is the hydrate dissociation pressure. Table 4 shows the regressed constants for single and binary gas hydrates. Methane and ethane constants in the sII structures were regressed from the dissociation pressures for the mixtures methane-propane and ethane-propane. For n-butane constants in both structures sI and sII, the regressions ran over the data of the binaries methane-butane and propane-butane. Parameters for nitrogen in sI structures were determined from the methane-nitrogen equilibrium pressures.

Table 5 presents the correlation deviations. For the sake of comparison, this table also shows the deviations from the Bandyopadhyay-Klauda (BK) model [4]. For the BK model, the program kindly provided by Dr. Klauda generated the predictions. Both models produce quite similar results.
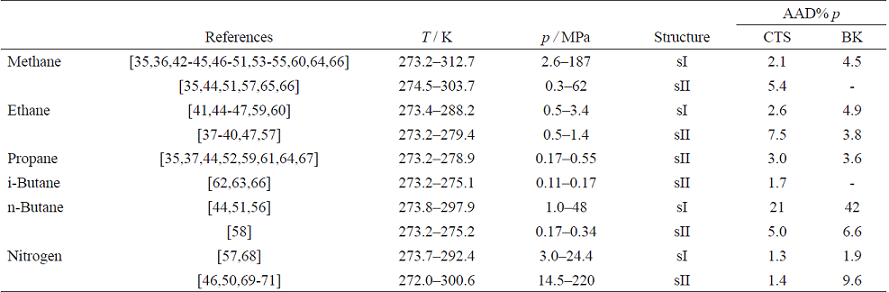
Fig. 3 shows graphically the CTS-vdWP correlation for the binary data. Very good agreement between the measured data and the correlation was achieved. The CTS-vdWP model produced average absolute deviations (AADs) from the experimental data not exceeding 8%, except for n-butane with 21%.
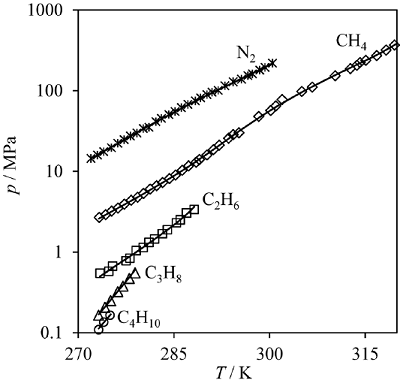
Fig. 3 H-L-V equilibrium pressure for one-component hydrates. Lines: CTS-vdWP model. Symbols: experimental data for methane sI (diamonds), ethane sI (squares), propane sI (triangles), i-butane sII (circles) and nitrogen sII (crosses). Experimental data from references [35-71].
The agreement with the measured data was good, considering the large interval of pressures covered (from 0.1 to 220 MPa).
4. Predictions: multicomponent mixtures and inhibitors
The final step in this work was to check whether the proposed model is able to predict uncorrelated dissociation pressures for multicomponent hydrates and the effect of inhibitors in shifting equilibrium conditions. The employed parameters were those determined in the previous steps and with no further regressions. In the following calculations, the binary parameters for gas-gas, gas-liquid water and gas-inhibitors were set to 0. Kontogeorgis et al. [72] employed this same approximation using the CPA EoS.
4.1 Mixed-gas hydrates
Table 6 presents the studied mixtures and the sources of experimental data for comparison. Table 7 shows the predictions' deviations, and they are compared with the BK model. These mixed-gas hydrates form both sI and sII structures.
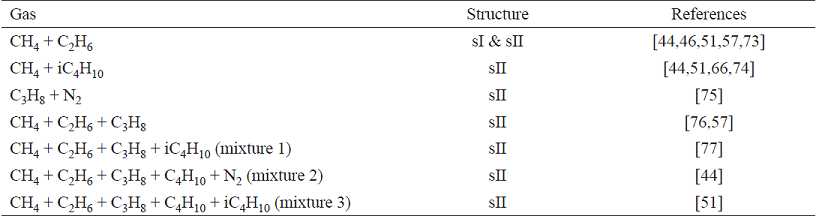
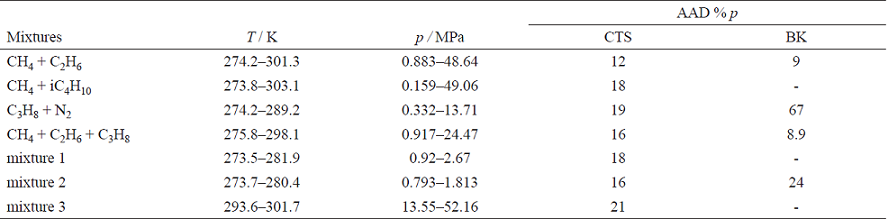
The average deviation of the predictions from the measured data was 18%, with a regular behaviour among the studied mixtures. We believe that these deviations could have been lowered if the binary parameters fixed to 0 had been adjusted, especially for water-hydrocarbon pairs. The BK model, for instance, estimates hydrocarbons solubilities via excess Gibbs energy mixing rule which better estimates the interaction between water and the non-polar compounds. Compared with other EoS-vdWP combinations, the deviations observed here are similar to those obtained with Peng-Robinson (11-28%) and PC-SAFT EoSs (15-28%), as reported by Economou and co-workers [78]. In this study, they used the quadratic rules with no binary parameters too. In the near future, we are planning to use complex mixing rules, such as those suggested by ourselves [22], in order better describe water-hydrocarbon mutual solubilities. Fig. 4 shows the reasonable agreement with the measured pressures for CH4 + i-C4H10 and for CH4 + C2H6 + C3H8 mixtures.
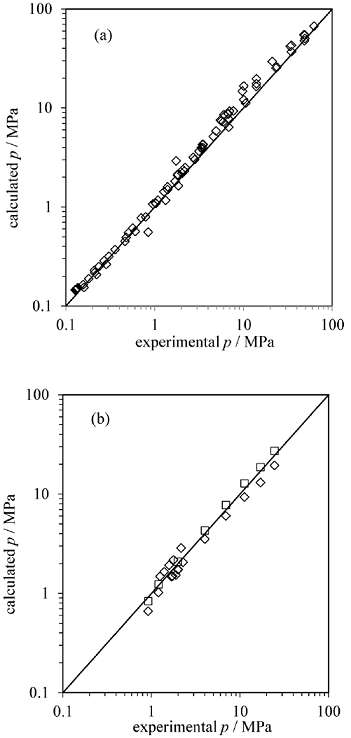
Fig. 4 CTS-vdWP predictions versus measured hydrate equilibrium pressures for (a) CH4 + i-C4H10 sII and (b) CH4 + C2H6 + C3H8 sII mixtures. Experimental data from references [44, 51, 57, 66, 74, 76].
Depending on the conditions, multiple-guest hydrates can present different structures. Table 8 shows that for the mixture methane-ethane both sI and sII structures can be formed. The most stable structure is the one with the lowest equilibrium pressure. Table 8 also shows that sI is favoured at lower concentrations of methane, as mentioned by Bandyopadhyay et al. [4].

In summary, the correlations/predictions of hydrate equilibrium pressures have a maximum deviation of 23% in a very broad range of pressures that are common in natural gas facilities.
4.2 Gas hydrates in presence of inhibitors
Similarly to the multi-gas hydrate predictions, no regressions were performed when inhibitors were present in the gas mixtures. Furthermore, the inhibitor-gas binary parameters were also set to 0. Table 9 presents the deviations of the predictions for the mixtures studied here. Yet again, the deviations from the measured equilibrium pressures are very acceptable for all inhibitors except for 2-propanol. The overall average AAD was 13%, with a maximum of 33% (2-propanol excluded). As expected, an increase of the inhibitor fraction decreases the predicted equilibrium temperature at a given pressure. Furthermore, at constant temperature, the equilibrium pressure rises. Fig. 5 illustrates this fact. Also from this figure, the model correctly predicts the transition from HLV to HLL equilibrium when 20% wt methanol is present. Both the model prediction and the measured data present a subtle change in the slope at approximately 276 K. Fig. 6 presents the accuracy of the predictions of hydrate equilibrium pressures for methane sI, ethane sI and propane sII in the presence of methanol. Although the deviations presented in Table 9 reach 24% for some cases, the overall predictions are in very good agreement with the experimental data. The model estimations show that the higher the inhibitor concentrations are, the more substantial the predictions' deviations.
Table 9 Deviations of the predictions from measured data for gas-inhibitor hydrates and references for experimental data
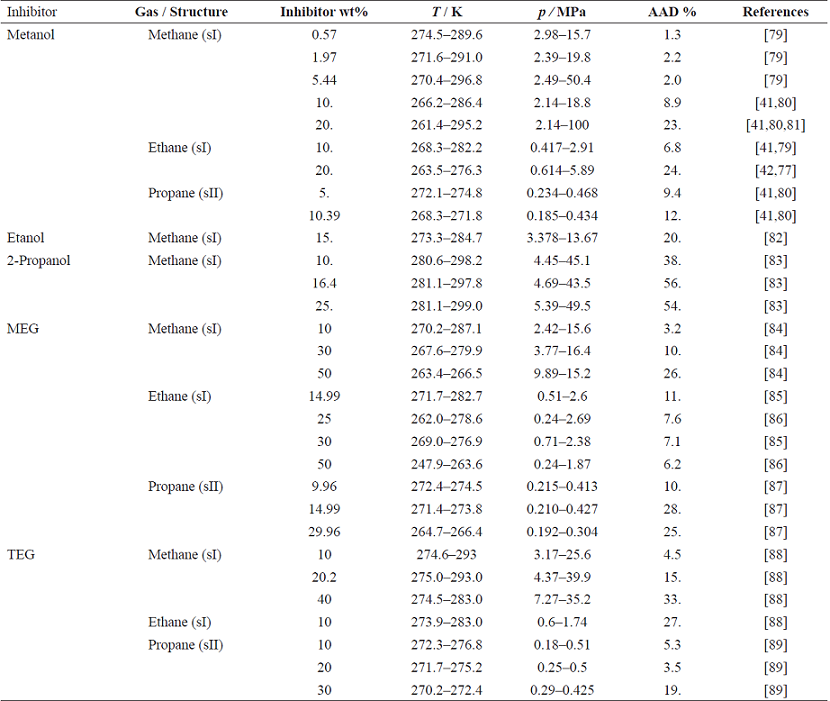
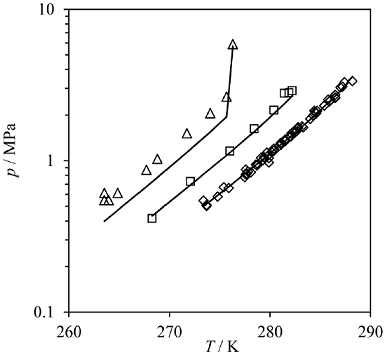
Fig. 5 Hydrate equilibrium pressures as a function of temperature and methanol concentration for methane-water-methanol mixtures. Lines: CTS-vdWP predictions. Symbols: experimental data [41, 80]. Diamonds: no methanol; squares: methanol 10% wt; triangles: methanol 20% wt.
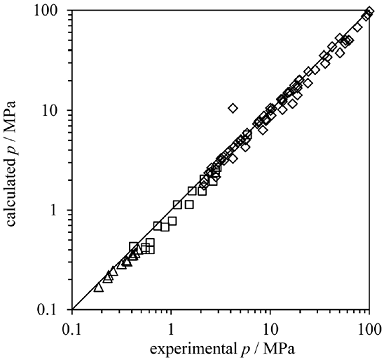
Fig. 6 Predictions versus experimental pressures for water-methanol (methanol 0.57%, 1.97%, 5.0%, 5.44%, 10.0%, 10.34%, 20.0%) mixtures with: methane sI (diamonds), ethane sI (squares), propane sII (triangles). Experimental data from references [41, 79-81].
The assumption of null binary parameters for inhibitor-gas pairs is probably the cause of the greater deviations under those conditions. For 2-propanol, it is possible that interactions with the gas are more important and the null binary parameter leads to great deviations.
5. Concluding remarks
We employed the combination of van der Waals-Platteeuw with the CTS EoS model for correlating and predicting hydrate formation conditions. The modelling of hydrate dissociation pressure required the adjustment of the following model parameters: (i) CTS constants of the pure components from experimental data within a temperature range relevant for hydrate formation; (ii) water-inhibitors (methanol, ethanol, 2-propanol, ethylene glycol and triethylene glycol) EoS binary parameters from VLE experimental data, and (iii) Parrish-Prausnitz parameters for the calculation of Langmuir constants from single-hydrate measured data. The correlations are in very good agreement with the measured data. The above mentioned parameters were then employed to predict the behaviour of multicomponent hydrates, with and without thermodynamic inhibitors. The resulting predictions are very close to the measured data, except when 2-propanol is the inhibitor. It was found that when increasing the inhibitor concentration, the inhibitor-gas interactions played a greater role; therefore, binary parameters for these interactions should be taken into account. This holds especially for inhibitors capable of interacting with gases, such as 2-propanol.
Future developments will include an electrolytic contribution to the EoS. This is particularly important for studying seafloor hydrates and their dissociation conditions. The CTS-electrolyte approach successfully correlated/predicted acid gas solubilities in alkanolamines [12], and we expect that it will also work for the study of hydrates.

