


 text new page (beta)
 English (pdf)
 Article in xml format
 Article references
 Send this article by e-mail
 Cited by SciELO
  Similars in
SciELO
Similars in
SciELO 
 Permalink
Introduction
One of the key risk factors of cardiovascular disease is hypertension. It already affects one billion people worldwide, and can cause heart attacks and strokes [1]. In the world, cardiovascular diseases are responsible for about 17 million deaths a year, almost one third of the total [2]. Among them, the complications of hypertension cause 9.4 million deaths annually [3]. That is why one of the main goals of the World Health Organization (WHO) in this context is to diminish the incidence of hypertension and the associated health risks. One of the targets of WHO is to cover at least 50% of people at moderate to high risk of developing heart attack and stroke with pharmacologically treating. This requires to guarantee the availability of basic technologies and essential generic drugs for this purpose. Some of them are thiazide diuretic, angiotensin converting enzyme inhibitor, long-acting calcium channel blockers, beta blockers, etc. Therefore, it is of great importance to develop and characterize new drugs that can be used as anti-hypertensives.
In the early 80’s Stout and coworkers [4-7] studied changrolin derivatives for that purpose. These researchers proposed that the presence of phenol and pyrrolidine rings are structural key factors for the antiarrhythmic effects. More recently, Velázquez et al. [8, 9] synthesized a series of compounds, usually referred to as LQM’s, which exhibit antihypertensive effects. Compared to changrolin derivatives, these compounds present morpholin and thiomorpholin rings instead of the pyrrolidine ring (Scheme 1 ).
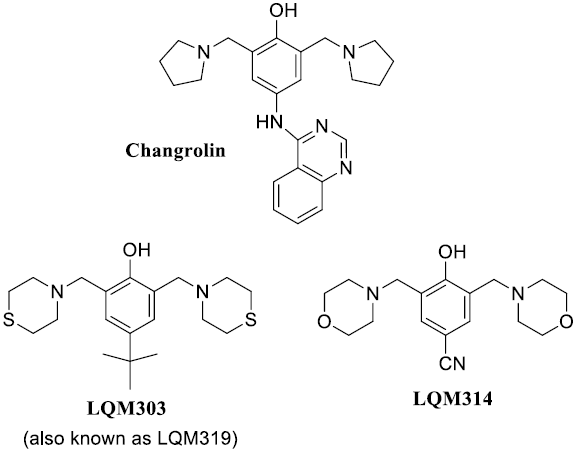
Scheme 1 Structures of changrolin, thiomorpholin (LQM303) and morpholin (LQM314) compounds studied in this work.
They show not only antihypertensive activity but also low toxicity. In the case of 4-tert-buthyl-bis-(2,6-thiomorpholin-4-ylmethyl)-1-phenol (LQM303, Scheme 1), its anti-hypertensive effects exceed commercial drugs like losartan [9,10]. Other compounds, such as the 4-hydroxy-3,5-bis(morpholin-1-ylmethyl)benzonitrile (LQM314, Scheme 1), are still in study regarding their pharmacological properties, but are considered promising drugs. However, it has not been fully characterized yet. For example its acidity constants (pKa values) and the partition coefficient (logP) between water and 1-octanol have not been reported.
The acid-base character of a drug is of great significance in pharmacology, thus physicochemical characterization of compounds having biological activity includes determining their acidity constants [11]. Physicochemical properties are of special value since they are directly related to the intermolecular forces involved in the drug-receptor interaction as well as to the transport and distribution properties of drugs. In this respect hydrophobic, polar, electronic, and steric properties are most important. Lipophilicity (synonymously called hydrophobicity) is defined by the partitioning of a compound between an aqueous and a nonaqueous phases. Nowadays, the partition coefficient (P) is defined as the ratio of substance concentrations in the organic and aqueous phases of a two-compartment system under equilibrium conditions. [12, 13, 14]. It is now common to express this coefficient as logP, as mentioned Lipinski [13].
Since most drugs are weak acids or bases, the pH of the environment frequently rules the dissolved fraction and the unionized form that can diffuse into the cells. This fraction depends on the chemical nature of the drug, its pKa and the local pH. In addition, it is very common to find drugs that show more than one pKa value, and the whole set of them should be considered for estimating the molar fractions of the different acid-base species, and consequently for fully characterizing their population under the conditions of interest. Identifying deprotonation routes for chemical compounds with several acid protons is frequently a challenging task that can be achieved using different techniques. Among them, computational theoretical studies constitute viable, and relatively inexpensive alternatives that are frequently used in this context [15, 16].
Then, one of the main goals of the present investigation is to determine the pKa’s and logP values for LQM303 and LQM314. For that purpose, the used methodology is similar to that previously used -successfully- for similar compounds [17]. In addition, the acidity constants are estimated under pseudo-physiological conditions of temperature (T) and ionic strength (I). Furthermore, since the drugs investigated in this work are poly-acids, computational chemistry has been used to identify the most viable deprotonation routes, albeit the pKa values are estimated using experimental techniques.
Results and discussion
CZE Study
A model taking into account the contribution of each species to the effective mobility LQM was constructed. It was necessary to know the molar fraction of each species, i.e., H3L2+, H2L+, HL and L-, according to the distribution diagram [18,19], where HL represents the neutral species of LQM.
Therefore, for a set of species defined by the acid-base successive equilibria
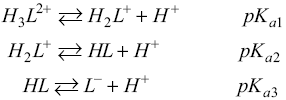
the effective electrophoretic mobility (uL’) is defined by:
 (1)
(1)
where the fHil term represent the molar fraction of the LQM species,
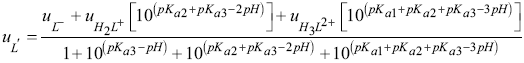 (2)
(2)
Equation 2 is used to propose a theoretical model of electrophoretic mobility as a function of pH that reproduces the experimental data.
Experimental values for the effective mobility (ueff) of LQM303 and LQM314, calculated by the equation ueff = uapp - ueof, where uapp is the apparent (measured) mobility and ueof is the electroosmotic mobility (related with the electroosmotic flow).
The experimental and calculated (by Equation 2) effective mobilities, as a function of pH, are presented in Figure 1. Theoretically, the inflection points of these curves should represent the pKa values of the substance. Figure 2a shows that, in the case of LQM303, there is experimental data only up to pH = 7.139. This is because the compound precipitates at more basic pH values. In fact, the solubility of the neutral form of this compound, in these conditions, was estimated to be approximatively 4.4 × 10⁻⁵ M.

Fig. 1 Mobility curves as a function of pH, obtained at 37°C and ionic strength 0.05 M. The markers represent the experimental results, and the solid lines, the fittings obtained with the aid of the program SQUAD. In the top of each figure, the corresponding predominance-zone diagram of the species [18,19] is represented. a) LQM303. b) LQM314.
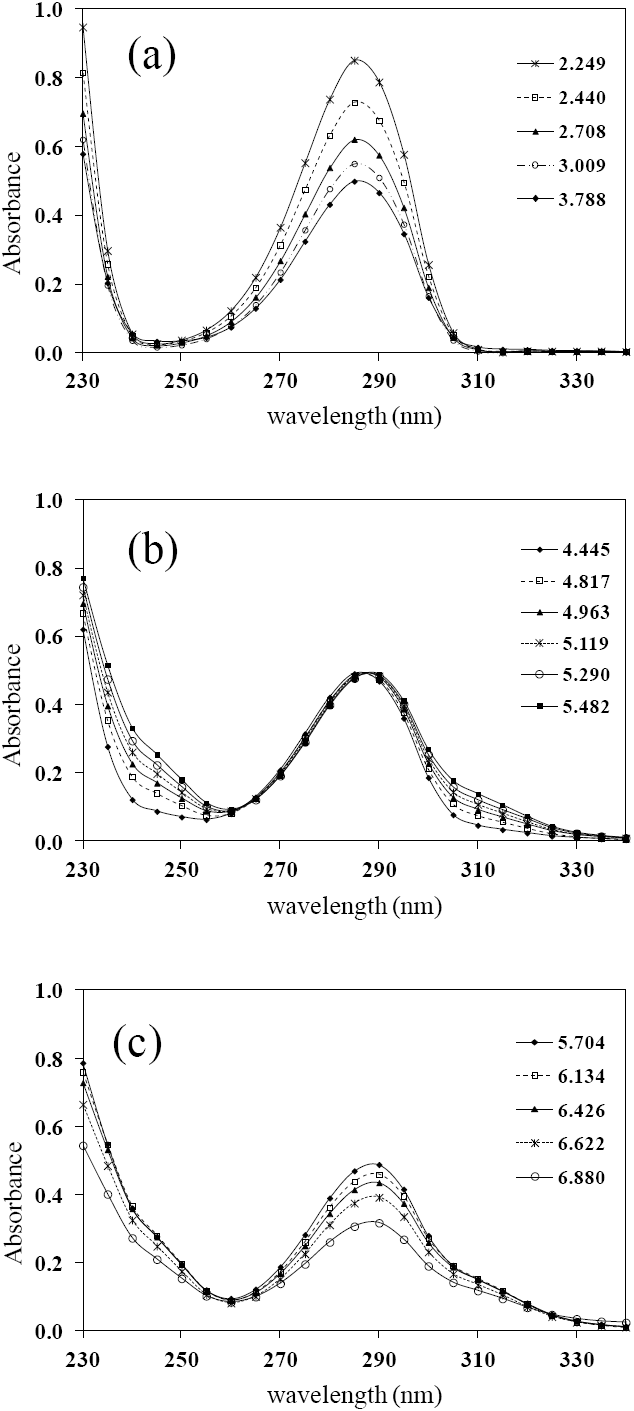
Fig. 2 UV absorption spectra for [LQM303] = 2.6 × 10⁻⁴ M. a) 2.249 ≤ pH ≤ 3.788. b) 4.445 ≤ pH ≤ 5.482. c) 5.704 ≤ pH ≤ 6.880.
The pKa values, ionic mobility of each species and the parameters of the fitting of the curves shown in Figure 1 with the program SQUAD [20,21] are shown in Table 1.
Table 1 pKa values (T=310.15 K and I=0.05M) refined with SQUAD from electrophoretic mobilities.

(a) The effective ionic mobility of all the involved species were also estimated during refining.
(b) Equivalent conductivities of ions are calculated with the equation: |z|λHjLz = F uHjLz, where F accounts for the constant of Faraday. [21,22].
(c) σreg represents the standard deviation of the regression and U the sum of the squares for the residuals of effective mobilities.
UV Spectrophotometric Study
Pseudophysiological Conditions Study (T = 310.15 K and I = 0.15M)
This determination is a model based on Beer’s law and the law of additivity that are the basis of the proposed analysis. This model takes into account the contribution given by each LQM species. Thus, the absorbance of the system at a particular wavelength (Aλ), and given optical path length (l), is:
 (3)
(3)
 (4)
(4)
Using the concentration of each species in terms of molar fractions (fi), Equation 4 takes the following form:
 (5)
(5)
Equation 5 represents the overall absorbance of LQM and describes the behavior of the model absorbance (at a wavelength) as a function of pH.
Due to the potential antihypertensive effects of the studied compounds, the UV spectrophotometric study was carried out under pseudophysiological conditions: T = 310.15 K and I = 0.15 M.
The set of UV absorption spectra corresponding to LQM303 species for different pH values are shown in Figure 2. As it can be observed, there is a maximum of absorbance at 285 nm when the pH of the solution is 2.25 that presents batochromic and hypochromic shifts when pH increases. In the same way that in CZE experiments, a precipitated is formed when solution pH is greater than 7, that prevented follow the study for that pH zone.
Additionally, the set of UV absorption spectra corresponding to LQM314 species are shown in Figure 3, for different pH values. An isosbestic point is shown at 255 nm in Figure 3a while a second isosbestic point is shown at 261 nm in Figure 3b; finally, a third isosbestic point, at 265 nm is shown in Figure 3c.These three isosbestic points seem to be related with three acid-base equilibria.

Fig. 3 UV absorption spectra for [LQM314] = 6.9 × 10⁻⁵ M. a) 1.511 ≤ pH ≤ 4.912. b) 5.653 ≤ pH ≤ 7.931. c) 8.278 ≤ pH ≤ 11.597.
The absorption spectra shown in Figures 2 and 3 were introduced to program SQUAD for each LQM. For a two acid-base equilibria model for LQM303 and a three acid-base equilibria model for LQM314, the absorptivity coefficients obtained in the fitting are shown in Figure 4; the fitting obtained is good, as it can be shown in Table 2.
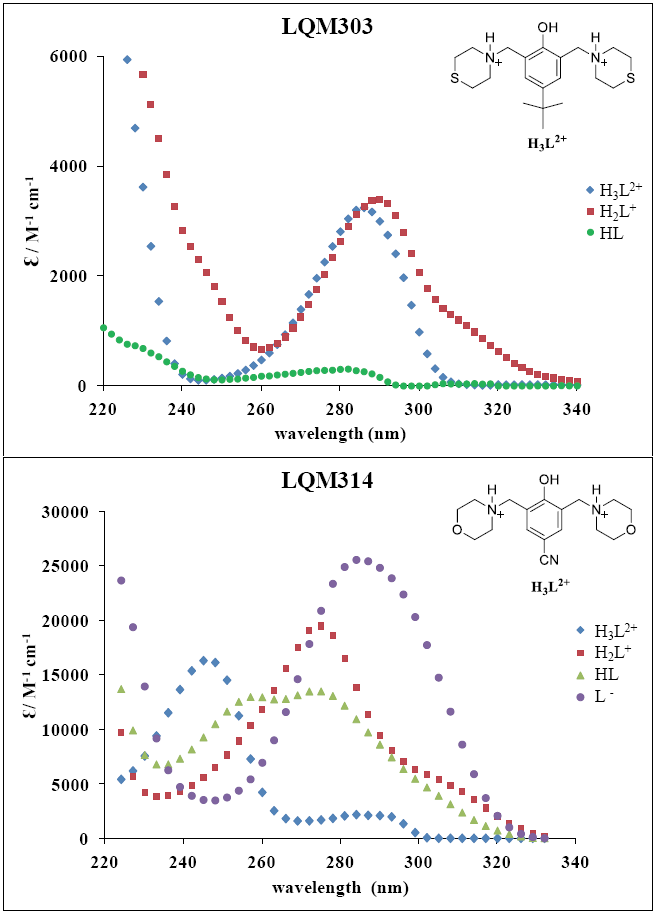
Table 2 pKa values obtained under pseudophysiological conditions (T = 310.15K and I = 0.15M), refined with SQUAD from spectrophotometric data.

a σreg represents the standard deviation of the regression while U takes into account the sum of squares.
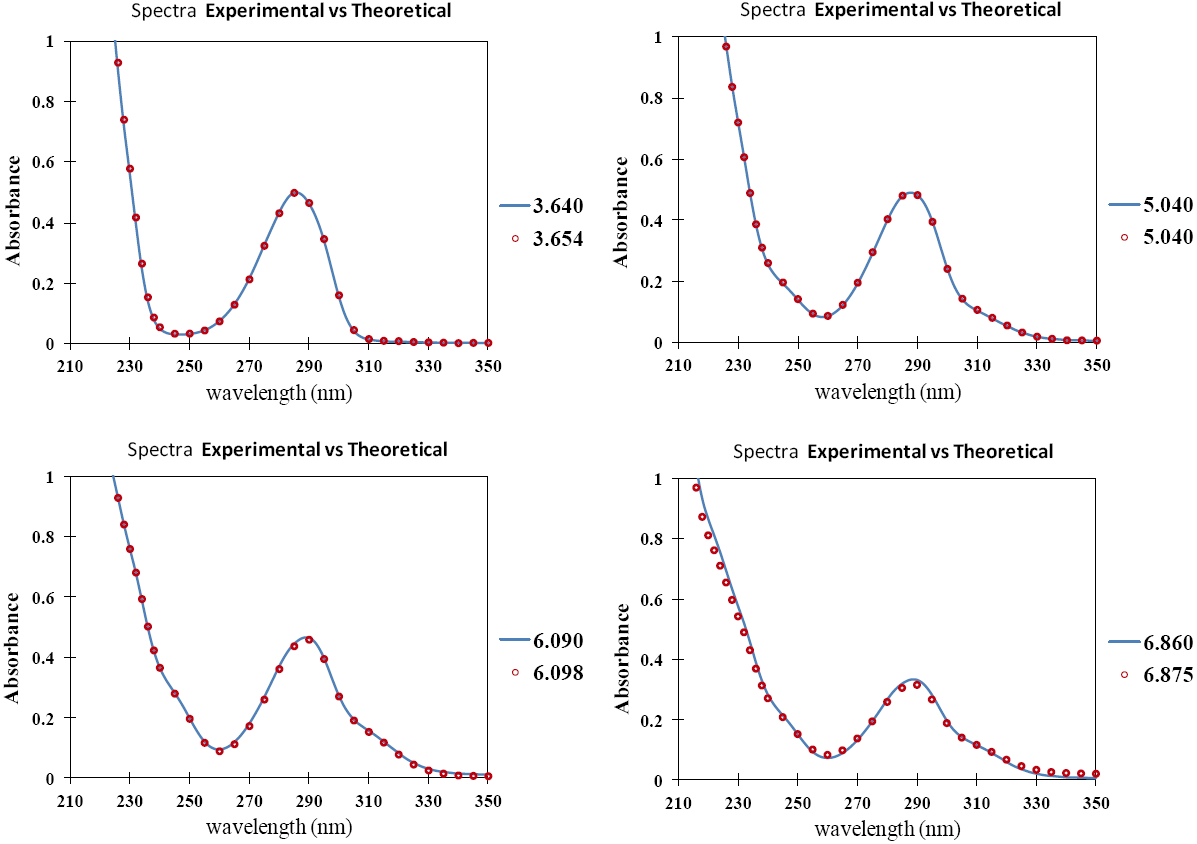
The calculated absorption spectra were obtained from global formation constants and molar absorptivity coefficients determined by SQUAD. Figure 5 presents a graphical comparison of the experimental with the calculated spectra, for different pH values. As it is shown in Figure 5, the fitting achieved is good, which strongly suggests that the refining procedure of the calculated constants is appropriate.
LogP Values between Water and 1-Octanol Obtained at Ambiance Temperature
Using direct experiments of liquid-liquid extraction between 1-octanol and water for each LQM, followed by the absorption spectra determination in the alcoholic phase, the partition coefficient of the LQM at neutral pH were determined. The logP values determined are shown in Table 3.
Table 3 Experimental logP values between water and 1-octanol for LQM compounds.
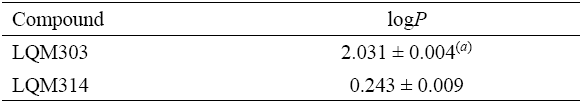
(a) Good agreement with the value reported in [10].
The logP = 2.031 obtained for LQM303 agrees very well with some values reported previously for similar thiomorpholine compounds [23]. The lower value obtained for LQM314, logP = 0.243, practically one order of magnitude lower, may be due to the oxygen atoms of morpholine rings present in the structure of this compound. Then LQM303 is more akin to the organic phase, as expected by its lower solubility in water than LQM314. It is important to remark that both compounds meet the corresponding Lipinski rule (logP < 5), for compounds with great potential to develop drugs to treat diseases. The determined values in this work are in the expected range, compared with the values of two commercial antihypertensives: captopril (logP = 1.02) and losartan (logP = 4.01) [10].
Theoretical Study
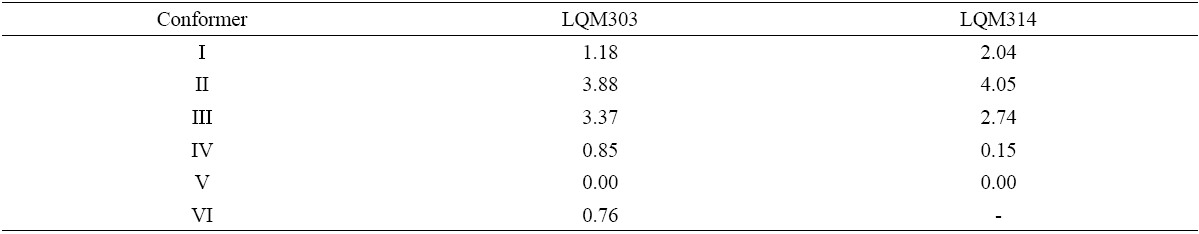
The first step of the theoretical study was to perform conformational studies of the involved species. Six conformers were located for LQM303 compound, and five conformers for LQM314 compound (Tables 1S and 2S, Supporting Information), and their relative energies are provided in Table 4. The optimized structures of the conformers identified as the lowest in energy are shown if Figure 6.

After identifying the most likely conformers for the complete protonated species (H3L2+), they were used as starting points in the search for the most likely deprotonation route. There are three possible deprotonation sites for both investigated compounds, one corresponding to a phenolic site and two to protonated tertiary amine sites. The values of Gibbs free energies corresponding to the deprotonation from each of these three possible acid sites were calculated (Table 5). It was found that the first deprotonation takes place from the phenolic site for both studied compounds. Thus it is identified as H2L+. For the second deprotonation only the two amino sites remain acid. Among them the most acidic one was found to be that in ring A. These results were used to predict the deprotonation routes of the studied compounds (Scheme 2).


Experimental section
Reagents
Common
HCl (36.5-38%, Baker) was used to prepare acidic solutions for spectrophotometric experiments. H3PO4 (85.2%, Baker), CH3 COOH (99.7% Latiz) and HBO3 (99.5% Technical Chemistry) were employed in order to prepare the buffers for capillary zone electrophoresis (CZE experiments. NaOH (98%, Baker) was used to adjust the pH of interest. All aqueous solutions were prepared with deionized water (18.2 MΩ cm) using a Millipore Milli-Q Gradient equipment.
Synthsesis of LQM compounds
An appropriate phenol (1 equivalent), formaldehyde (4 equivalents) thiomorpholine or morpholine (2 equivalents) were mixed in a round flask fitted with a condenser, under solvent free conditions. The mixture was irradiated with IR light using a medicinal lamp (250 watts). The reaction temperature is in the range of 120°C to 180°C. The reaction was monitored by thin layer chromatography (TLC) using silica gel as stationary phase and mixture hexane/ethyl acetate (1:4) as mobile phase. The final mixture was separated by column chromatography with the same stationary phase than in TLC and a gradient mixture of hexane/ethyl acetate as mobile phase.
LQM303 (4-tert-buthyl-bis-(2,6-thiomorpholin-4-ylmethyl)-1-phenol) characterization
Reaction time: 20 min. MP: 95-97°C. Yield: 80%.
IR (CHCl3 film)
1H NMR (CDCl3) δ (ppm, TMS): 10.69 (1H, s, OH), 7.09 (2H, s,), 3.71 (4H, s, Ar-CH2), 2.86 (8H, m, -S-CH2-), 2.76 (8H, m, -N-CH2-), 1.27 (9H, -CH3).
13C NMR (CDCl3) δ (ppm, TMS): 153.6 (C), 141.14 (C), 125.79 (CH), 121.22 (C), 58.81 (Ar-CH2-), 54.42 (-N-CH2-), 33.78 (C), 31.47 (-CH3), 27.74 (-S-CH2-).
FAB-MS m/z: (M + 1) 381 (35%), 278 (100%), 175 (50%).
LQM314 (4-hydroxy-3,5-bis(morpholin-1-ylmethyl)benzonitrile) characterization
Reaction time: 15 min. MP: 104-106°C. Yield: 87%.
IR (CHCl3 film)
1H NMR (CDCl3) δ (ppm, TMS): 11.40 (1H, s, OH), 7.14 (2H, s,), 3.72 (8H, m, -O-CH2-), 3.63 (2H, s), 2.54 (8H, m, -N-CH2-).
13C NMR (CDCl3) δ (ppm, TMS): 162.2 (C), 132.48 (C), 123.48 (CH), 119.34 (C), 101.75 (-O-CH2-), 66.56 (Ar-CH2-), 58.34 (-N-CH2-), 53.03 (-CN).
FAB-MS m/z : (M + 1) 318 (34%), 230 (100%), 229 (45%).
Capillary Zone Electrophoresis (CZE) Study
Experimental conditions
The technique used was CZE. The experiments were performed with a Beckman Coulter P/ACE MDQ with diode array detector (DAD) equipment. A fused silica capillary with 50 mm of internal diameter, a total length (Lt) of 50.2 cm, and an effective length to detector (Ld) of 40 cm on the long side. The sample injection was hydrodynamic using 1.0 psi for 5 seconds. The working temperature was maintained at 37°C, the voltage (V) applied in the separation was 20 kV (using direct polarity). Acetone was used as electroosmotic flow marker.
Capillary Conditioning
Before measuring the experimental activity, the capillary was washed with deionized H2O for 5 minutes at 30 psi and 25°C; followed by 0.1M NaOH for 10 minutes at 30 psi and 25°C; 0.1M NaOH for 10 minutes at 30 psi and 40°C; H2O for 10 minutes at 30 psi and 25°C; finally washed with buffer for 10 minutes at 30 psi and 25°C. Each run was started by a 1 min at 20 psi, wash with 0.1M NaOH, followed by a 1min at 20 psi, deionized water wash and, then, a 2 min at 20 psi, Britton-Robinson buffer wash of the desired pH. The capillary was stored full of deionized water.
Buffers Employed
Buffer (Britton-Robinson) pH solution, 50 mM, were prepared by mixing equimolar amount acetic, phosphoric and boric acids, adjusting the pH of each solutions with 0.5M NaOH or HCl as required. Sample solutions of LQM303 and LQM314 were prepared by dissolving 5 mg of compound LQM in 500 microliters of 1.0M HCl before filling to the mark with deionized water the 5.0 mL volumetric flask.
Methodology to obtain effective mobility of LQM [24,25]
Electropherograms of a group of LQM solutions at different pH were obtained. Acetone was used as a marker of electroosmotic flow (eof). Each solution was tested in triplicate and the migration times of acetone (teof) and LQM (tLQM) were obtained. The electroosmotic mobility (ueof) and apparent mobility (uap) were obtained by Equations 6.
 (6)
(6)
Effective mobilities (ueff = uLQM) were determined as the difference between the apparent mobility (uapp) and the mobility of the electroosmotic flow marker (uoef) in agreement with the Equation 7.
 (7)
(7)
Spectrophotometric Study
Experimental conditions
A Perkin-Elmer UV-Vis spectrometer, model Lambda 950, was used for the spectrophotometric determination of acidity constants. The pH was measured with a pH-meter model PHM240 and a combined Ag/AgCl, both Radiometer Analytical brand. Assessments were made at constant temperature.
Experimentation
A LQM solution for spectrophotometric measurements was prepared by dissolving 10 mg of the LQM desired on a volume of 100 mL of 0.01M HCl. A basic solution of 0.01M NaOH is used as titrant. In both solutions the ionic strength is imposed to 0.15M by adding the necessary amount of NaCl. Then, for each LQM, the acidic solution was titrated with the NaOH solution. The temperature of the titration cell was maintained at 37°C with a recirculator. The solution was maintained with a constant stirring. The atmosphere over the solution was kept inert through a nitrogen flow.
pH Measurements
The pH values were measured with a PHM240 potentiometer equipped (± 0.001 resolution) with a Radiometer Analytical combined pH electrode Ag/AgCl pHC3001-8. The pH of solution was corrected by cell efficiency with Equation 8.
 (8)
(8)
Ef is an empirical parameter related to potentiometric cell efficiency that tends to zero while cell efficiency tends to 100% [17]. Wescott and Bates propose a method to correct the pH, which gives results similar to Equation 8 [26, 27].
Determination of pKa values
The equilibrium constants were obtained by fitting UV absorption spectra [20] or effective mobilities [21] with chemical composition of the solutions and the pH, a chemical model of two (for LQM303) or three acid-base equilibria (for LQM314), all this with the program SQUAD. The concentration values used in the refinement with SQUAD were taken considering the dilution.
Determination of logP of LQM compounds between water and 1-octanol
1-Octanol (Baker) and deionized water obtained from a Milli-Q equipment of Millipore (0.182 MΩ· m) were presaturated to maintain the volume ratio constant during liquid-liquid extraction processes [23]. The UV absorption spectra for the organic phase were recorded in the Perkin-Elmer 950 spectrophotometer, using quartz cells with an optical path length of 1 cm.
Calibration Curve
A calibration curve was prepared, by solving adequate amounts of each LQM in n-octanol presaturated with water.
The linear regression equations of the calibration curves obtained were

and
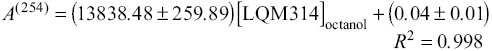
where [LQM]octanol represents the concentration of corresponding LQM in the octanolic phase, given in molarity units (mol/L).
Partition of LQM Compounds between Water and 1-Octanol
A mixture of 10 mL of LQM stock solution in 1-octanol (with a concentration sited around the middle of the calibration curve) and 10 mL of deionized water (presaturated with 1-octanol) was placed in a separating funnel of 30 mL. Vigorous stirring was undertaken during 2 min, and the phases were allowed to separate. A similar mixture in each case was used as a blank for absorbance measurements, but changing 1-octanol presaturated of deionized water in the place of the LQM314 stock solution.
In the case of LQM303, 10 mL of LQM303 organic solution were used with 90 mL of deionized water.
The concentration of the corresponding LQM compound in the octanolic phase was obtained by interpolation of the absorbance measured for the extracted solution on the calibration curve. This determination was repeated three times.
Extracted Fractions and logP Values Determination
The extracted fractions (E LQM,oct ) of the corresponding LQM were obtained from the equation

Where [LQMoct]0 represents the concentration of corresponding LQM in the octanolic phase before the extraction. Finally, the logP values were obtained from the equation

r, is the volume ratio between 1-octanol and water.
Computational Details
All the electronic calculations were carried out with the Gaussian 09 package of programs [28]. Geometry optimizations and frequency calculations were performed with the 6-31+G(d) basis set and the solvation model based on density (SMD), and the Density Functional Theory (DFT), in particular the B3LYP functional [29]. This functional has been successfully used for studying similar molecules [23]. The energies were improved by single point calculations, using the 6-311++G(d,p) basis set. Local minima were identified by the absence of imaginary frequencies. Relative energies were calculated including thermodynamic corrections at 298.15 K. All the relative energies are reported at the 1M standard state.
Conclusions
The pKa values of LQM303 and LQM314, compounds with good antihypertensive properties, were obtained by CZE and UV spectrophotometry. These results demonstrated that solubility, relative acidity and affinity to 1-octanol with respect to water are affected by the substituent in the position 4 of the phenol ring. The tert-butil group (LQM303) causes low solubility in water while the cyano substituent (LQM314) increases the solubility and the acidity of the phenolic proton. The affinity for 1-octanol of LQM303 was greater than that of LQM314, almost for 10 times, as expected; even though both compounds meet the Lipinski rule that establishes that it is necessary that logP < 5 for substances that could be considered for the development of drugs. The differences in lipofilicity and solubility of both compounds should be related to the S or O atoms in the alkyl rings where N atom is present.
The conformational theoretical study undertaken with Gibbs’ energy calculations the structure with minimal energy was found for the most protonated species. From this structure the deprotonation order was determined for each LQM. It can be seen that the more acidic site corresponds to the proton of phenol group, for subsituents morpholine, as well as thiomorpholine, for any group in the para- position to the phenolic -OH.

